Baseline fertility status of a gravelly Alfisol in a derived savannah agro-ecological zone of Nigeria
←
→
Page content transcription
If your browser does not render page correctly, please read the page content below
Open Agriculture 2020; 5: 573–581
Research Article
Kehinde Abodunde Adegbite, Aruna Olasekan Adekiya*, Ojo Timothy Vincent Adebiyi,
Elizabeth Temitope Alori, Wutem Sunny Ejue, Adeniyi Olayanju, Charity Aremu
Baseline fertility status of a gravelly Alfisol in a
derived savannah agro-ecological zone of
Nigeria
https://doi.org/10.1515/opag-2020-0059 that the soils of the project site are very fragile and poor in
received November 13, 2019; accepted April 27, 2020 native fertility. Compound fertilizers low in nitrogen
Abstract: Farmers have not tested their soils for nutrient contents but high in phosphorus and potassium are
status and therefore are unaware of the fertility status of recommended for gravelly Alfisol in a derived savannah
their soils. Therefore, a baseline fertility survey of ecological zone of the Kwara State, Nigeria to avoid a
50 hectares of land of a gravelly Alfisol in the Teaching nutrient imbalance that may create artificial deficiencies of
and Research Farm of Landmark University, Omu-Aran, otherwise adequate nutrient elements.
Kwara State, Nigeria was carried out with a view to Keywords: soil fertility, textural class, nitrogen, phos-
identifying soil health constraints and site-specific phorus, potassium, cropping systems, Omu-Aran
sustainable land management practices for optimizing
crop production. Standard field protocols and laboratory
analytical procedures were employed for all sample
parameters measured. Results show that the soil textural 1 Introduction
classes vary from sand to loamy sand, exchangeable
acidity, Ca, Mg, K, and Na and the effective cation Food is one of the most important basic necessities of
exchange capacity has the surface and subsurface man. Low soil fertility could threaten the security of food
soil values of 0.0–0.92 and 0.00–0.89 cmol kg−1, 1.6–7.7 in the sub-Saharan Africa (Adekiya and Agbede 2009).
and 2.0–5.8 cmol kg−1, 1.2–11.5 and 0.7–8.0 cmol kg−1, This is so because, soil provides food, fodder and fuel for
0.09–0.33 and 0.09–0.43 cmol kg−1, 0.0–0.16 and meeting the basic human and animal needs (Schoonover
0.04–0.16 cmol kg−1, 7.2–12.10 and 0.9–12.5 cmol kg−1, and Crim 2015). However, continuous cultivation and
respectively. P values lie in the ranges of 2.5–68.9 mg kg−1 indiscriminate deforestation through the use of fuel
and 2.0–37.7 mg kg−1 in the surface and subsurface soils, wood as a source of alternative energy are attributed to
respectively, organic C values were 0.86–2.81% and be the main sources of decline in productivity and
0.68–3.49%, respectively, in the surface and subsurface fertility, especially in savanna soils (Umar et al. 2018).
soils while the values of N were 0.12–0.61% in the surface In addition, farmers have not tested their soils for
and 0.11–0.56% subsurface soils. Land evaluation shows nutrient status and therefore are unaware of the fertility
status of their soils (Knight et al. 2010). Asgelil Dibabe
(2000) reported that for tropical soils, nitrogen (N) and
phosphorus (P) are low and hence are limiting crop
* Corresponding author: Aruna Olasekan Adekiya, Department of production. Little information is currently available to
Agriculture, College of Agricultural Sciences, Landmark University,
farmers on the available soil fertility nutrient management
PMB 1001, Omu-Aran, Kwara State, Nigeria,
e-mail: adekiya2009@yahoo.com, of their soils. This information is necessary if the soils are to
tel: +234-803-481-3715 produce crops on a sustainable basis (Hassan et al. 2013).
Kehinde Abodunde Adegbite, Ojo Timothy Vincent Adebiyi, For a given soil to be sustainable according to Greenland
Elizabeth Temitope Alori, Wutem Sunny Ejue, Charity Aremu: (1975), chemical nutrients removed by crops must be
Department of Agriculture, College of Agricultural Sciences,
assessed and replenished and even the physical condition
Landmark University, PMB 1001, Omu-Aran, Kwara State, Nigeria
Adeniyi Olayanju: Department of Agricultural & Bio-system
of the soil must be regularly assessed and improved.
Engineering, Landmark University, PMB 1001, Omu-Aran, Generally, there is scarcity of information on the
Kwara State, Nigeria fertility status of the derived savanna soil of Nigeria.
Open Access. © 2020 Kehinde Abodunde Adegbite et al., published by De Gruyter. This work is licensed under the Creative Commons
Attribution 4.0 International License.574 Kehinde Abodunde Adegbite et al.
Shehu et al. (2015) found organic carbon, total N and forest if communal burning is stopped. The terrain is
effective cation exchange capacity (ECEC) within the highly undulating and rugged with a rolling landscape
very low and low fertility classes in Sudan savanna of various slopes in various directions, and is generally
ecological zone of Nigeria, whereas very low and low well drained with the main hydrological feature being
available P was found in the majority of locations. river Orisa, a perennial rivulet. The mean annual rainfall
Majority of the soils were also low in K. The authors in the area is about 1,300 mm and falls under the Typic
recommended that the current fertilizer needs to be Ustic moisture regime (FDALR 1990). The concept of the
reviewed and should contain other nutrients in addition Ustic moisture regime (USDA 1999) is one of limited
to primary macronutrients. However, Adeboye et al. moisture, but the moisture is present at a time when
(2009) recommended for southern guinea savanna of conditions are suitable for plant growth. Temperature
Nigeria the judicious use of inorganic and organic varies throughout the year. The mean annual tempera-
fertilizers for soil fertility maintenance in the ecological ture is about 32.5°C, with an estimated annual soil
zone for optimum and sustainable soil fertility. Oyinlola temperature of about 34°C. Thus, the area can be
and Chude (2010) recommended that boron (B) and zinc regarded as an iso-hyperthermic temperature regime
(Zn) applications are needed for a successful and (USDA 1999). Relative humidity seldom varies from the
profitable crop production in northern guinea and Sudan average of about 60% throughout the year. This results
savanna zones of Nigeria. For the derived savanna in substantial evapotranspiration which effects a critical
ecological belt of Nigeria, such data and recommenda- balance situation between water supply and water that is
tion are lacking. It is therefore imperative to provide a available to crops. The area enjoys an average of 8–10 h
baseline fertility of a derived savanna soil, so that such of sunshine daily, the sun being directly overhead
information will provide a useful guide for the manage- throughout the year. This facilitates a sufficient photo-
ment of soil. Therefore, the objectives of this study were synthetic activity necessary for crops.
to determine the baseline fertility status of the soils of The area has been completely cleared of most of the
the area and to offer soil management strategies to tree vegetation for farming. However, in the surrounding
improve it and hence sustain crop production. areas, the vegetation can presently be regarded as
anthropogenic because it has suffered various degrees
of human interference. The present vegetative cover is in
between secondary forest (this vegetation is as a result of
2 Materials and methods the heavy rainfall incidence which usually occurs in the
area, and the forest species include Milicia excelsa,
Anogeissus leiocarpus, Daniellia oliveri, Elaeis guineensis
2.1 Ecology, soil and land use types of (oil palm), Borassus (palm) and savanna woodlands
the area (Vitellaria paradoxa, Terminalia avicenmioides, Annona
senegalensis and Bauhinia monandra). The communities
The research was conducted in the Landmark University surrounding the project site (Landmark University) are
Teaching and Research farms, Omu-Aran, Kwara State mainly agrarian, and the University is an Agriculture-
in the transitionally derived savanna agro-ecological based University. This area is well recognized for
zone of Nigeria, which lies within Latitudes 08° 37′ and intensive agricultural activities. The major crops pro-
12° 59′N and Longitudes 03° 10′ and 07° 27′E. The main duced in this area include root and tuber crops like yam
occupation of the people of Kwara State is agriculture. (Dioscorea spp.), cassava (Manihot esculenta), cocoyam
Because this state falls along the middle belt of Nigeria, (Colocasia esculenta) and sweet potatoes (Ipomoea
the climate favours the growth of several varieties of batatas). Other crops include cereals like maize (Zea
food and cash crops. About 70% of the population mays), rice (Oryza sativa) and guinea corn (Sorghum
practise subsistence agriculture with more importance spp.). Vegetables like okra (Abelmoschus esculentus),
attached to food crops than cash crops. The food crops tomatoes (Lycopersicuum spp.), pepper (Capsicum spp.),
include yam, cassava, maize, plantain and millet. eggplant (Solanum spp.) as well as leaf vegetables like
The area lies in the derived savanna vegetation zone green (Amaranthus spp.), Ewedu (Corchorus olitorius)
of Nigeria. Derived savanna is evolved from the rain and Ugwu (Telfairia occidentalis) are produced in large
forest by human activities such as regular fire, defor- quantities. Legumes like groundnut (Arachis hypogaea),
estation and farming (Adekiya et al. 2018). Only a few soybean (Glycine max), cowpea (Vigna unguiculata) and
fire-tolerant trees are found and the area can advance to bambara groundnut (Voandzeia subterrenea) are alsoBaseline fertility status of a gravelly Alfisol 575
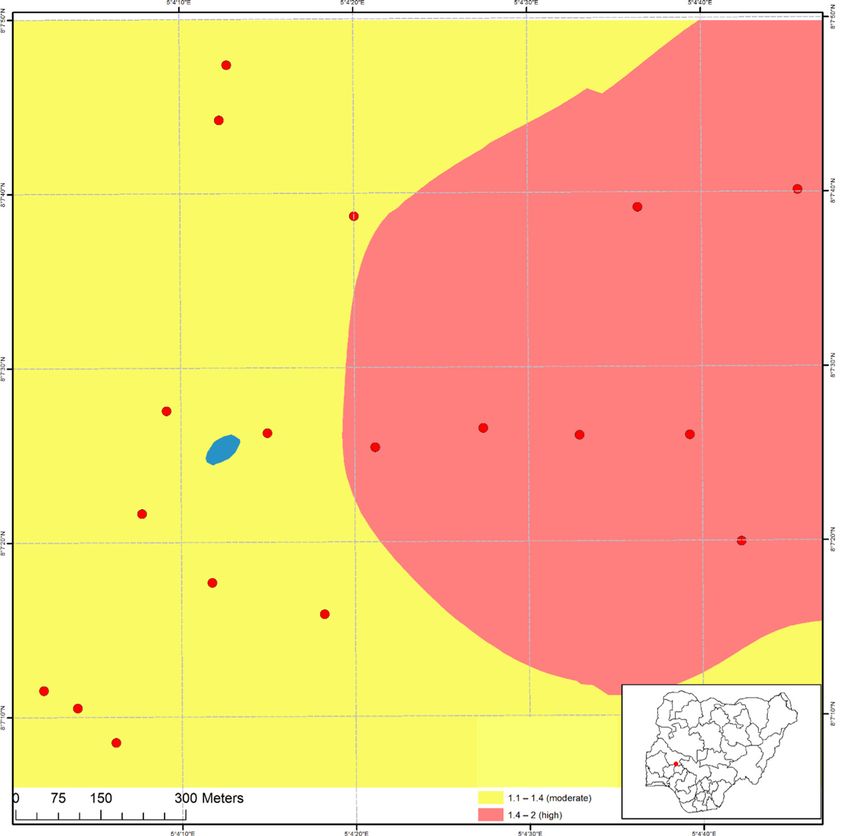
commonly grown. Shifting and fallow systems of The perimeter survey map provided by the University
cultivation are predominant among the indigenous at a scale of 1:10,000 was used as a base map for the
farmers of the area. There is a dearth of soil information exercise. At each sampling point, the following observa-
in this area, despite its strong agrarian culture. tions were recorded: coordinate (longitude, latitude and
elevation) using a handheld GPS (Figure 1), land use,
topography, erosional and depositional features, surface
pans, rock outcrops, vegetation, etc. Also at each
2.2 Field study sampling point, soil samples were collected from 0 to
15 cm and 15 to 30 cm soil depth. Soil samples collected
The area was 50 hectares of land of a gravelly Alfisol in were kept in a polythene bag for laboratory analyses.
the Teaching and Research Farm of the Landmark
University. The base maps that were used for the surveys
were obtained from the Director of Physical Planning 2.2.1 Laboratory analysis
and Development of the University. The entire area was
then gridded into rectangular polygons 200 m by 200 m The soil samples collected were air-dried and sieved
to obtain one composite soil sample in 4 hectares. A using a 2 mm sieve and later analysed for soil physical
strict grid method was thus employed for the survey, and and chemical properties using the method described by
where possible and feasible, this method was supple- Carter (1993). The particle size distribution was deter-
mented with a free system of survey. mined by the hydrometer method (Sheldrick and Hand
Figure 1: A map of the sample collection point with coordinates.576 Kehinde Abodunde Adegbite et al.
Wang 1993). The soil pH was determined using a glass samples. The data were subjected to one-way Analysis
electrode pH meter (Ibitoye 2006). Total nitrogen content of Variance to determine the significant difference at 5%
was determined using the micro-Kjeldahl digestion level of acceptance using SPSS Version 21 (SPSS IBM
method (Bremner 1996). Phosphorus was determined Corp 2012).
by the Bray 1 method followed by molybdenum blue
colourimetry (Frank et al. 1998). Organic carbon was
determined by the Walkley and Black method using the
dichromate wet oxidation method (Nelson and Sommers 3 Results and discussion
1996). Exchangeable cations (potassium, calcium, so-
dium and magnesium) were extracted using 1 N ammo- 3.1 Physical characteristics of the soils of
nium acetate. K and Na in the extract were read on a the area
flame photometer, while Ca and Mg were read on an
Atomic Absorption Spectrophotometer (Model: Buck 205; Soil textural classes vary from sand to loamy sand (Table 1),
Brand: Buck Scientific; Country of manufacture: USA). thus implying light textured soils. Sand composition
Effective CEC was the summation of NH4OAc bases and varies from a minimum of 78.1% to a maximum of
KCl exchangeable Al and H. The base saturation was 87.1%. Silt varies from 8.6% to 15.6%, while clay varies
obtained by expressing total exchangeable bases as a from 4.3% to 8.3%. The variability of gravel, clay and
percentage of ECEC (Adegbite et al. 2019). sand in the 0–15 cm soil level is less compared with the
same soil particles in the 15–30 cm soil depth. The
variability of silt in the 15–30 cm soil layer is less
2.2.2 Statistical analysis compared with that of silt in the 0–15 cm layer. It is
also significant that the soils of the area generally have
Data collected from each soil sample were expressed as high plinthite contents ranging from a minimum of
means ± standard deviation of the various other 25.4% to a maximum of 79.3%, a situation that has
Table 1: Soil texture and gravel contents
Grid code 0–15 cm 15–30 cm
% Gravel % Clay % Silt % Sand % Gravel % Clay % Silt % Sand
TR1 59.5 5.3 9.6 85.1 58.6 4.3 8.6 87.1
TR2 69.6 5.3 11.6 83.1 71.4 6.3 11.6 82.1
TR3 70.3 6.3 11.6 82.1 70.4 4.3 12.6 83.1
TR4 56.4 5.3 8.6 86.1 56.7 6.3 9.6 84.1
TR5 63.0 7.3 11.6 81.1 53.0 8.3 12.6 79.1
TR6 61.6 4.3 10.6 85.1 60.0 4.3 9.6 86.1
TR7 57.7 5.3 10.6 84.1 52.2 6.3 12.6 81.1
TR8 47.2 5.3 11.6 83.1 47.2 6.3 13.6 80.1
TR9 75.7 5.3 11.6 83.1 70.4 6.3 10.6 83.1
TR10 55.1 4.3 10.6 85.1 44.8 6.3 11.6 82.1
TR11 75.9 6.3 15.6 78.1 74.1 6.3 12.6 81.1
TR12 65.0 8.3 8.6 83.1 68.4 4.3 9.6 86.1
TR13 51.3 5.3 10.6 84.1 48.8 5.3 9.6 85.1
TR14 71.1 4.3 9.6 86.1 67.3 4.3 12.6 83.1
TR15 69.0 4.3 10.6 85.1 61.6 4.3 11.6 84.1
TR16 75.1 5.3 11.6 83.1 66.6 6.3 8.6 85.1
TR17 78.9 4.3 10.6 85.1 79.3 4.3 8.6 87.1
TR18 25.4 4.3 14.6 81.1 17.4 5.3 12.6 82.1
Median 64.0 5.3 10.6 83.6 60.8 5.8 11.6 83.1
Mean 62.66 5.36 11.1 83.5 59.3 5.5 11.04 83.4
SD± 13.00 1.11 1.76 2.06 14.4 1.17 1.69 2.35
CV 20.7 20.7 15.9 2.46 24.3 21.3 15.3 2.81
Note: TR1, TR2, TR3,…,TR18 are sample points in the Teaching and Research Farm, Landmark University.Baseline fertility status of a gravelly Alfisol 577 negative implications for land preparation implements. between 0.13 and 0.31 cmol kg−1 as being moderately The soil physical condition observed in the site does endowed with K, while those having exchangeable K not pose any serious limitation to crop production; that is greater than 0.31 cmol kg−1 were regarded as even in areas where the soil depth is
578 Kehinde Abodunde Adegbite et al.
Table 2: (a) Chemical properties of the soils. (b) Chemical properties of the soils
Grid code 0–15 cm 15–30 cm
cmol (+)/kg % BS cmol (+)/kg % BS
Ca2+ Mg2+ K+ Na+ Al + H CEC Ca2+ Mg2+ K+ Na+ Al + H CEC
(a)
TR1 2.4 5.8 0.29 0.07 0.00 8.6 100.0 2.5 7.2 0.29 0.04 0.40 10.4 96.0
TR2 2.5 4.7 0.30 0.04 0.20 7.8 97.2 2.6 6.1 0.30 0.07 0.30 9.4 96.6
TR3 2.7 5.0 0.29 0.04 0.00 8.0 99.8 2.5 3.9 0.28 0.04 0.90 7.6 88.0
TR4 2.5 4.4 0.27 0.04 0.00 7.2 100.0 2.1 4.9 0.27 0.07 0.00 7.3 100.0
TR5 2.6 5.1 0.30 0.04 0.72 8.8 91.8 2.3 4.1 0.31 0.04 0.12 6.9 98.3
TR6 2.4 5.7 0.30 0.04 0.22 8.7 97.5 2.1 5.7 0.28 0.07 0.22 8.4 97.4
TR7 3.2 4.3 0.30 0.04 0.00 7.8 100.0 2.9 4.2 0.28 0.07 0.12 7.6 98.4
TR8 3.1 3.9 0.29 0.04 0.22 7.5 97.1 2.5 4.1 0.29 0.07 0.62 7.6 91.8
TR9 3.8 4.4 0.30 0.07 0.00 8.6 100.0 2.6 4.7 0.29 0.04 0.22 7.8 97.2
TR10 2.5 5.4 0.28 0.04 0.22 8.4 97.4 2.4 4.1 0.26 0.04 0.32 7.1 95.5
TR11 3.0 3.8 0.25 0.04 0.42 7.5 94.4 2.7 5.1 0.25 0.07 0.00 8.1 100.0
TR12 2.4 5.6 0.25 0.04 0.62 8.9 93.0 2.1 6.0 0.27 0.13 0.72 9.2 92.2
TR13 2.9 4.6 0.25 0.07 0.92 8.7 89.5 2.3 5.4 0.26 0.04 0.62 8.6 92.8
TR14 2.3 4.8 0.25 0.04 0.22 7.6 97.1 2.0 5.2 0.24 0.04 0.12 7.6 98.4
TR15 2.6 4.6 0.28 0.07 0.42 8.0 94.7 3.5 4.2 0.26 0.07 0.82 17.8 45.0
TR16 4.5 3.8 0.30 0.07 0.42 9.1 95.4 3.4 6.4 0.27 0.04 0.62 10.7 94.2
TR17 4.5 9.2 0.28 0.04 0.82 14.8 94.5 2.2 5.3 0.25 0.04 0.32 8.1 96.1
TR18 1.6 6.0 0.27 0.04 0.72 8.6 91.7 — — 0.29 0.07 0.52 — —
Median 2.6 4.7 0.28 0.04 0.22 8.5 97.1 2.45 5.0 0.27 0.06 0.32 7.9 96.1
Mean 2.87 5.06 0.28 0.05 0.34 8.59 96.17 2.37 4.81 0.27 0.06 0.89 8.34 87.6
SD ± 0.75 1.24 0.02 0.01 0.31 1.65 3.26 0.72 1.52 0.02 0.02 2.40 3.24 25.2
CV 26.1 24.5 7.1 20.0 91.1 19.2 3.39 30.4 31.6 7.41 33.3 269.6 38.8 28.7
Grid code 0–15 cm 15–30 cm
pH (1:2) %N %C Avail. P mg/kg pH (1:2) %N %C Avail. P mg/kg
Water 0.01 M CaCl2 Water 0.01 M CaCl2
(b)
TR1 6.30 5.78 0.14 1.02 17.1 6.38 5.53 0.12 1.06 14.6
TR2 6.34 5.70 0.16 1.20 13.6 6.24 5.00 0.13 0.68 13.6
TR3 6.44 5.62 0.17 1.46 21.6 6.07 5.61 0.15 1.04 13.8
TR4 6.07 5.24 0.14 1.20 36.7 6.12 5.22 0.14 0.92 20.2
TR5 6.02 5.28 0.15 1.22 14.7 5.90 5.24 0.15 1.20 16.0
TR6 6.53 5.94 0.12 1.16 12.0 6.52 5.97 0.18 0.80 10.2
TR7 6.44 5.85 0.18 1.10 10.7 6.00 5.79 0.15 1.20 21.6
TR8 6.53 5.73 0.13 1.08 12.9 6.07 5.70 0.14 0.92 13.1
TR9 6.20 5.98 0.61 1.08 12.7 6.14 5.72 0.56 1.18 8.9
TR10 6.40 6.02 0.42 1.80 8.9 6.37 5.60 0.41 2.03 10.4
TR11 6.55 6.02 0.23 1.78 25.8 6.48 5.31 0.24 1.58 14.6
TR12 6.36 5.56 0.24 1.56 10.0 6.43 5.60 0.20 1.28 12.2
TR13 6.05 5.83 0.14 1.60 10.0 6.48 5.68 0.15 1.00 7.3
TR14 6.67 5.83 0.19 1.80 15.5 5.88 5.66 0.16 1.78 8.0
TR15 6.27 5.70 0.23 2.00 8.9 6.30 5.58 0.23 2.00 10.6
TR16 5.90 5.46 0.22 1.82 16.0 6.01 5.68 0.21 2.57 20.0
TR17 6.33 6.03 0.24 2.21 15.3 7.23 6.60 0.24 1.74 9.8
TR18 6.42 5.32 0.17 1.00 8.5 6.67 5.18 0.17 0.90 6.9
Median 6.35 5.75 0.18 1.34 13.2 6.27 5.60 0.17 1.19 12.6
Mean 6.32 5.72 0.22 1.45 15.05 6.29 5.59 0.21 1.33 12.88
SD± 0.21 0.26 0.18 0.38 7.04 0.33 0.35 0.11 0.51 5.42
CV 3.3 4.5 81.8 26.2 46.8 5.24 6.26 52.4 38.3 42.1
Note: TR1, TR2, TR3,…,TR18 are sample points in the Teaching and Research Farm, Landmark University.Baseline fertility status of a gravelly Alfisol 579
range of pH values favours nutrient availability to crop requirement for the production of most arable crops
plants since the pH of most agricultural soils in Nigeria within the savanna ecology of Nigeria (FFD 2011). Idoga
has been reported to range from 4.00 to 6.5. (Hartly and Azagaku (2005) also reported that the percentages of
1988; Ojomah and Joseph (2017) also found that for Kogi organic C and N are moderately high for savannah soils.
East agro-ecological zone of Kogi State Nigeria, the pH of This they adduced to the “aquic” conditions of the
soils was within the critical level of 5.0–6.8 for crop floodplains which reduce soil temperature and conse-
production. quently lower the rate of organic matter decomposition.
Available P was generally adequate (>10 mg kg−1) in Thus, production of any crop on the soil of this farm site
the surface and subsurface horizons (Akinrinde and will require a minimum input of supplementary nitrogen
Obigbesan 2000) of the soils, although there are very fertilizer for the first one or two cropping seasons for
few areas with low values. For this study, samples that optimum yield. The variability of Ca, Mg, K, Na, CEC,
were adequate in P were 77.8%, while those inadequate pHw, pHk and organic C in the surface soil was less
were 22.2% for both the surface and the subsurface soil compared with the same soil chemical properties in the
layers. subsurface soil. However, the variability of N and P in
Available P in these soils ranged between 8.5 mg kg−1 the subsurface soil was less compared with that in the
and 36.7 mg kg−1 in the surface horizons and 6.9– surface soil. The litter on the soil surface layers and high
21.6 mg kg−1 in the subsurface samples (Table 2b). Also, biomass production generally result in a high biological
Olaniyan (2013) reported on the characterization, classi- activity in the soil surface and hence a high organic C at
fication and agricultural potential of some selected soils the surface compared with the sub-surface. Organic
of Kwara State, Nigeria under derived savannah agro- matter affects both the chemical and physical properties
ecological zone and that available values of P range of the soil and its overall health. Properties influenced by
between moderate and high. Likewise, Ahukaemere et al. organic matter include: soil structure; moisture holding
(2016) reported higher P contents of the soil in the acid capacity; diversity and activity of soil organisms; hence,
sand soil of southeastern Nigeria. The soils had moderate it is expected that there will be better nutrient
to high organic carbon contents. Organic carbon content availability and soil fertility at the surface soil compared
of the surface soils ranged between 1.0% and 2.21%, while with the sub-surface. It also influences the effects of
the subsurface horizons had organic carbon contents that chemical amendments, fertilizers, pesticides and herbi-
ranged from 0.68% to 2.57%. The high values observed in cides (Bot and Benites 2005).
some of the subsurface samples were most likely due to Land evaluation shows that the soils of the project
the poultry manure dump. The surface and subsurface site are very fragile and poor in native fertility. According
horizons of these soils had average values of organic to the FAO (2006), preservation of the surface soil with
carbon greater than the critically recommended level of its all-important organic matter is of utmost importance
1.2% for agricultural land in Nigeria (FFD 2011). At the in the conservation and management of these soils.
surface and subsurface layers, 55.6% and 38.9% soil Fertilizers low in nitrogen contents but high in
samples were adequate, while 44.4% and 61.1% were phosphorus and potassium are required for this soil.
inadequate respectively. Application rate of 15–20 tonnes of poultry manure per
The total nitrogen (N) contents of the soil were hectare and compound fertilizer containing NPK in the
generally adequate (>0.15%) in all the samples, except in ratio of 10:20:20 at the rate of 300 kg ha−1 are recom-
few cases. This is in sharp contrast to trends in Savannah mended. Cereals, especially rice, are important crops
ecology. For this study, samples that were adequate in N grown in the agro-ecological zone. Smith (2006) recom-
were 66.7% and 55.6% for 0–15 cm and 15–30 cm, mended 100 kg ha−1 N, 400 kg ha−1 P and 150 kg ha−1 K
respectively. fertilizer for paddy rice. Also, in Owo, the forest –
Generally, in the savanna ecology of Nigeria, reports savannah transition zone of Nigeria, Agbede and
from several sources indicated that the nitrogen content Adekiya (2012) recommended 10–40 t ha−1 poultry
of the soils was low due to high rate of mineralization, manure for improved soil productivity and increased
immobilization, volatilization and the effects of annual yam yield. Agbede et al. (2013) also recommended
bush burning. The total nitrogen content of the area 20 t ha−1 of organic manures in the form of goat manure,
ranged from 0.12% to 0.61% in the surface, with the sub- poultry manure, oil palm bunch and spent grain and
surface horizons ranging from 0.11% to 0.56%. The total their combinations for improved soil productivity on an
N content of the soil is thus generally above the critical Alfisol located at Owo, Nigeria.580 Kehinde Abodunde Adegbite et al.
4 Conclusions and [4] Adekiya AO, Agbede TM. Growth and yields of tomato
(Lycopersicon esculentum Mill) as influenced by poultry
recommendations manure and NPK fertilizer. Emirate J Food Agric.
2009;21(1):10–20.
The soils are of less optimum nutrient values due to [5] Adekiya AO, Aboyeji CM, Dunsin O, Agbede TM, Bazuaye H.
excessive cropping and will therefore require regular Effects of cocoa pod ash and urea on soil chemical properties
and the performance of kale (Brassica oleracea L.) in derived
rehabilitation and management practices if it would be
savanna zone of Nigeria. Trop Agric. 2018;95(2):115–23.
sustainably used for profitable agricultural production. [6] Agbede TM, Adekiya AO. Effects of poultry manure and soil
The sparse surface vegetal cover due to initially fertility, growth and yield of white yam and yellow yam. U. of
excessive bush clearing and over-cropping will lead to K. J Agric Sci. 2012;20(3):286–303.
low aggregate stability, water infiltration and this will [7] Agbede TM, Adekiya AO, Ogeh JS. Effects of organic fertilizers
on yam productivity and some soil properties of a nutrient-
make the land prone to more erosion as a result of
depleted tropical Alfisol. Arch Agron Soil Sci.
exposure to the direct impact of raindrops. 2013;59(6):803–22.
For agricultural activities, high plinthite and stoni- [8] Ahukaemere CM, Onweremadu EU, Akamigbo FOR,
ness at shallow soil depth are also major limitations. Ndukwu BN. Suitability evaluation of soils of the coastal plain
This makes mechanization a little bit difficult. Mounding sands for rain – fed maize production in acid sands of south-
and minimum tillage practices are the only tillage options eastern Nigeria. Nigerian J Soil Sci. 2016;26:138–45.
[9] Akinrinde EA, Obigbesan GO. Evaluation of the fertility status
that can be used to manage these soils productively.
of selected soils for crop production in five ecological zones of
Soil fertility management on gravelly Alfisol in a Nigeria. In: Babalola O, editor. Proceedings of the 26th Annual
derived savannah ecological zone of Kwara State, Conference of Soil Science Society of Nigeria; 2000 Oct
Nigeria should combine organic and inorganic fertilizer 30–Nov 3. Ibadan, Nigeria; 2000. p. 279–88.
amendments in an integrated system. Sound manage- [10] Dibabe A. Effect of fertilizer on the yield and nodulation
pattern of Faba bean on a Nitosol of Adet North Western
ment of organic residue should be adopted and cropping
Ethiopia. Ethiopian J Nat Resour. 2000;2:237–44.
systems, such as crop rotation and intercrops including [11] Ayodele OJ, Omotosho SO. Nutrient management for maize
legumes, should be encouraged. Fertilizers low in production in soils of the savannah zone of south-western
nitrogen contents but high in phosphorus and potassium Nigeria. Int J Soil Sci. 2008;3(1):20–7.
are recommended to avoid nutrient imbalance that may [12] Bot A, Benites J. The importance of soil organic matter. Key to
create artificial deficiencies of otherwise adequate drought-resistant soil and sustained food and production.
FAO land and plant nutrition management service. FAO Soils
nutrient elements. Presently, an application rate of
Bull. 2005;80:95.
15–20 tonnes of poultry manure per hectare and com- [13] Bremner JM. Nitrogen-total. In: Sparks DL, editor. Methods of
pound fertilizer containing NPK in the ratio of 10:20:20 soil analysis. Part 3. Chemical methods. 2nd edn. SSSA
at the rate of 300 kg ha−1 are recommended. However, Book Series No. 5 Madison, WI: ASA and SSSA; 1996.
soil tests for nutrient evaluation should be carried out at p. 1085–121.
[14] Carter MR. Soil sampling and methods of analysis. Canadian
least once in two years.
society of soil science. Boca Raton, FL: Lewis Publishers; 1993.
p. 823.
Conflict of interest: Authors declare no conflict of [15] FAO. Guidelines for soil description. Rome: FAO; 2006. p. 109.
interest. [16] FDALR. The Reconnaissance Soil Survey of Nigeria. 1990;
vol. 2.
[17] FFD. Fertilizer use and management practices for crop
production in Nigeria. 4th edn. Abuja Nigeria: Fed. Min. of
Agric. and Rural Dev; 2011. p. 1–300.
References [18] Frank K, Beegle D, Denning J. Phosphorus. In: Brown JR, editor.
Recommended chemical soil test procedures for the North
[1] Abreu Jr CH, Muraoka K, Lavorante AF. Relation between Central Region, North Central Regional Research Publication
acidity and chemical properties of Brazilian soils. Sci Agri. No. 221 (revised). Columbia, MO: Missouri Agric. Exp. Station;
2003;60(2):337–43. 1998. p. 21–6.
[2] Adeboye M, Osunde A, Ezenwa M, Odofin A, Bala A. Evaluation [19] Hartly CWS. The oil palm (Elaeis guinensis jacq). 2nd edn.
of the fertility status and suitability of some soils for arable London and New York: Longman; 1988. p. 824.
cropping in the southern guinea Savanna of Nigeria. Nigerian J [20] Hassan M, Saddiq AM, Ibrahim A. Fertility evaluation of some
Soil Sci. 2009;19(2):115–20. soils in Adamawa State, Nigeria. Nigerian J Soil Sci.
[3] Adegbite KA, Okafor ME, Adekiya AO, Alori ET, Adebiyi OTV. 2013;23(1):110–4.
Characterization and classification of soils of a toposequence [21] Ibitoye AA. Laboratory manual on basic soil analysis. 2nd edn.
in a derived savannah agroecological zone of Nigeria. Open Akure, Ondo State: Foladaye Publishing Company; 2006.
Agric J. 2019;13:44–50. p. 82.Baseline fertility status of a gravelly Alfisol 581
[22] Idoga S, Azagaku DE. Characterization and classification of Nigeria savanna. Tropic Subtropic Agroecosyst.
soils of Janta area, Plateau state of Nigeria. Nigerian J Soil Sci. 2010;12:229–37.
2005;15:116–22. [31] Parfitt RL. Potassium–calcium exchange in some New Zealand
[23] Kirkman JH, Basker A, Surapaneni A, MacGregor AN. soils. Australian J Soil Res. 1992;30:145–58.
Potassium in the soils New Zealand – a review. New Zealand J [32] Samadi A. Potassium Exchange Isotherms as a Plant
Agric Res. 1994;37:207–27. Availability Index in Selected Calcareous Soils of Western
[24] Knight JD, Buhler R, Leeson JY, Shirtliffe SJ. Classification and Azarbaijan Province. Iran Turk J Afric For. 2006;30:21–222.
fertility status of organically managed fields across [33] Schoonover JE, Crim JF. An introduction to soil concepts and
Saskatchewan, Canada. Can J Soil Sci. 2010;90:667–78. the role of soils in watershed management. J Contemp Water
[25] Mutscher H. Measurement and assessment of soil potassium Res Educ. 2015;154(1):21–47.
IPI Research Topics No 4 (revised version). Switzerland: [34] Shehu BM, Jibrin JM, Samndi AM. Fertility status of selected
International Potash Institute Bassel; 1995; p. 102. soils in the Sudan savanna biome of northern Nigeria. Int J Soil
[26] Nelson DW, Sommers LE. Total carbon, organic carbon and Sci. 2015;10(2):74–83. doi: 10.3923/ijss.2015.74.83.
organic matter. In: Sparks DL, editor. Methods of Soil [35] Sheldrick B, Hand Wang C. Particle-size distribution. In:
Analysis, Part 3. 2nd edn Madison, WI, USA: ASA and SSSA; Carter MR, editor. Soil Sampling and Methods of Analysis. Ann
1996. p. 961–1010. SSSA Book Series No. 5. Arbor, MI, USA: Canadian Society of Soil Science, Lewis
[27] Ojomah FO, Joseph PO. Assessment of soil fertility status in Publishers; 1993. p. 499–511.
some areas of Kogi east agroecological zone of Kogi State. [36] Smith B. The farming handbook. South Africa: University of
J Agric Rural Res. 2017;1(2):44–50. KwaZulu-Natal Press Scottville 3209; 2006.
[28] Olaniyan JO. Characterization, classification and agricultural [37] SPSS. IBM Corp. Released 2012. IBM SPSS Statistics for
potential of some selected soils of Kwara State, Nigeria. Windows, Version 21.0. Armonk, NY: IBM Corp.
Nigerian J Soil Sci. 2013;23(1):94–101. [38] Umar B, Idris S, Ali S, Abdullahi BU, Aliyu MD. Evaluation of
[29] Oluwatosin GA, Are KS, Adeyolanu OD, Idowu OJ. indigenous soil fertility assessment of the sudan savannah
Characteristics and agricultural potential of soils with plinthic agro-ecological zone of Nigeria – a paper review. IOSR J Agric
materials in the savanna ecology of south western Nigeria. Vet Sci. 2018;11(10):1–9.
Arch Agron Soil Sci. 2019. doi: 10.1080/03650340.2019. [39] USDA Soil Taxonomy. Soil Survey Staff, Agriculture Handbook,
1696017 No. 436, 2nd edn. Washington, DC: United States Department
[30] Oyinlola EY, Chude VO. Status of available micronutrients of of Agriculture, Natural Resources Conservation Service;
the basement complex rock – derived Alfisols in northern 1999. p. 869.You can also read