Behavioral Research and Practical Models of Drivers' Attention
←
→
Page content transcription
If your browser does not render page correctly, please read the page content below
Behavioral Research and Practical Models of
                                                                     Drivers’ Attention
                                                                                Iuliia Kotseruba and John K. Tsotsos
                                                                          Department of Electrical Engineering and Computer Science
                                                                                   York University, Toronto, ON, Canada
arXiv:2104.05677v1 [cs.CV] 12 Apr 2021

                                                                                 yulia k,tsotsos@eecs.yorku.ca

                                                                                                April 13, 2021

                                                                                                      Abstract
                                                   Driving is a routine activity for many, but it is far from simple. When on the road, drivers must concurrently
                                               deal with multiple tasks. Besides keeping the vehicle in the lane, they must observe other road users, anticipate
                                               their actions, react to sudden hazards, and deal with various distractions inside and outside the vehicle. Failure to
                                               notice and respond to the surrounding objects and events can potentially cause accidents.
                                                   The ongoing improvements of the road infrastructure and vehicle mechanical design have made driving safer
                                               overall. Nevertheless, the problem of driver inattention has remained one of the primary causes of accidents.
                                               Therefore, understanding where the drivers look and why they do so can help eliminate sources of distractions and
                                               identify optimal attention allocation patterns for safer driving. The outcomes of research on driver attention have
                                               implications for a range of practical applications such as revising existing policies, improving driver education,
                                               enhancing road infrastructure and in-vehicle infotainment systems (IVIS), as well as designing systems for driver
                                               monitoring (DMS), advanced driver assistance (ADAS) and highly-automated driving (HAD).
                                                   This report covers the literature on how drivers’ visual attention distribution changes depending on various
                                               factors, internal to the driver, e.g. their driving skill, age, and physical state, and external ones, e.g. the presence
                                               of outside distractions and automation. Various aspects of attention allocation during driving have been ex-
                                               plored across multiple disciplines, including psychology, human factors, human-computer interaction, intelligent
                                               transportation, and computer vision, each with specific perspectives and goals, and different explanations for the
                                               observed phenomena. Here, we link cross-disciplinary theoretical and behavioral research on driver’s attention to
                                               practical solutions. Furthermore, limitations are discussed and potential directions for future research in this fast-
                                               moving field are presented. Statistical data and conclusions shown here are based on over 175 behavioral studies,
                                               nearly 100 practical papers, 20 datasets, and over 70 surveys published in the last decade. A curated list of papers
                                               used for this report is available at https://github.com/ykotseruba/attention_and_driving.

                                         1    Introduction
                                         Driver inattention has been recognized as a major cause of accidents since at least the late 1930s [141] and, sadly,
                                         continues to be so. To this day, much of the research on drivers’ attention is motivated by safety. Early studies
                                         on drivers’ behavior addressed attention only indirectly via observations of vehicle control. Some of the factors
                                         considered were engagement in secondary tasks [335], lighting [324] and environmental conditions [67], fatigue
                                         [343], and the effect of alcohol consumption [280], all of which are still relevant.
                                             Driving is primarily a visuomanual task, i.e. drivers’ motor actions are guided by vision, with some information
                                         obtained via auditory or somatosensory modalities. Thus the main questions of interest are where, when, and why
                                         drivers look in different environments and situations. A natural first step towards the answers is gathering objective
                                         and precise recordings of drivers’ gaze. Since eye-tracking equipment was not easily accessible until the 1970s
                                         when some of the first commercial offerings started to appear, other methods of observing drivers’ visual behaviors
                                         were explored. These included an aperture device that reduced the driver’s peripheral vision [143], a helmet with
                                         a translucent shield that could be lowered to control the driver’s visual input [350], and wooden planks in front of
                                         the windshield to artificially limit the view of the road [328] (Figure 1).
                                                                                                          1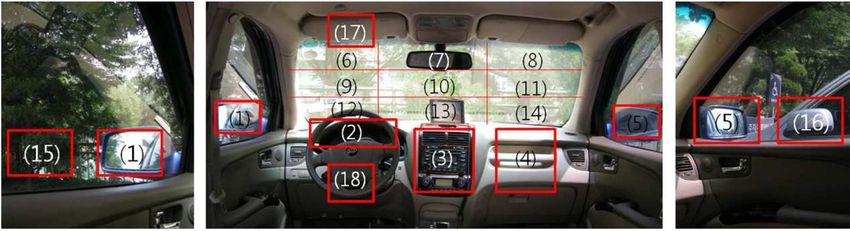
(a) Helmet                                          (b) Veiling luminance device

                 Figure 1: Devices used for studying drivers’ attention. Source: a) [350], b) [328].

                                 (a)                                               (b)

                      Figure 2: Mobile eye trackers used in 1970. Source: a) [189], b) [328].

     Early models of mobile eye-trackers (shown in Figure 2), despite being unwieldy, intrusive, and lacking in
precision, afforded valuable insights into drivers’ gaze behavior. Modern eye-tracking technology offers even more
detailed and high-resolution recordings of eye movements. Although gaze does not provide complete information
about drivers’ perception and decision-making, eye-tracking data has proved useful in both theoretical and applied
research on drivers’ attention. Continued efforts are dedicated to discovering common patterns of drivers’ visual
behavior, their causes, and possible links to road accidents. This knowledge can inform regulation and help improve
driver training. For example, studies indicate that bright colors and motion of the digital roadside billboards distract
the drivers; therefore policies prescribe how many billboards can be installed along the roads and how often the
images on them should transition. Driver training is another problem. Worldwide, new drivers are over-represented
in crash statistics, partly because they do not possess visual skills for safe driving after finishing driving school,
as established in the early work by Zell [471] and Mourant & Rockwell [274], and confirmed by countless studies
since. Research towards improving driver education includes developing methods that accelerate the acquisition
of the necessary visual scanning strategies.
     Recent technological advances in intelligent transportation, computer vision, and AI promise to reduce acci-
dents by monitoring where the driver is looking to prevent them from engaging in distracting activities, daydream-
ing, or falling asleep at the wheel. Driver assistive technologies, such as forward collision warning, further improve
safety by attracting drivers’ attention to the source of imminent danger. An ultimate solution to driving safety is
replacing the driver with an autonomous system controlling the vehicle.
     Besides safety considerations, driving provides a useful testbed for studying human visual attention because
it is a widespread activity familiar to many people of different ages and backgrounds. A traffic scene is a prime
example of a noisy, dynamic, and complex environment that humans can actively navigate and explore by se-
lectively sampling the information. The driving task itself consists of multiple competing sub-tasks, each with
different and sometimes conflicting demands. Consequently, driving makes it possible to investigate the control of
eye movements to prioritize and accomplish current goals and study the link between vision and motor actions.
     Attention during driving is explored across multiple disciplines that provide different perspectives and explana-
tions of the observed phenomena. This report summarizes the past decade of research on various factors that have
been linked to drivers’ attention allocation, internal mechanisms of attention, and efforts towards building practical
models of attention while driving. The literature review focuses on studies that explicitly measure drivers’ atten-
tion using eye-tracking data as opposed to studies that rely on indirect measures such as driving performance. The
final set of publications reviewed comprises 175 behavioral studies, 100 practical works, and 65 surveys published
                                                           2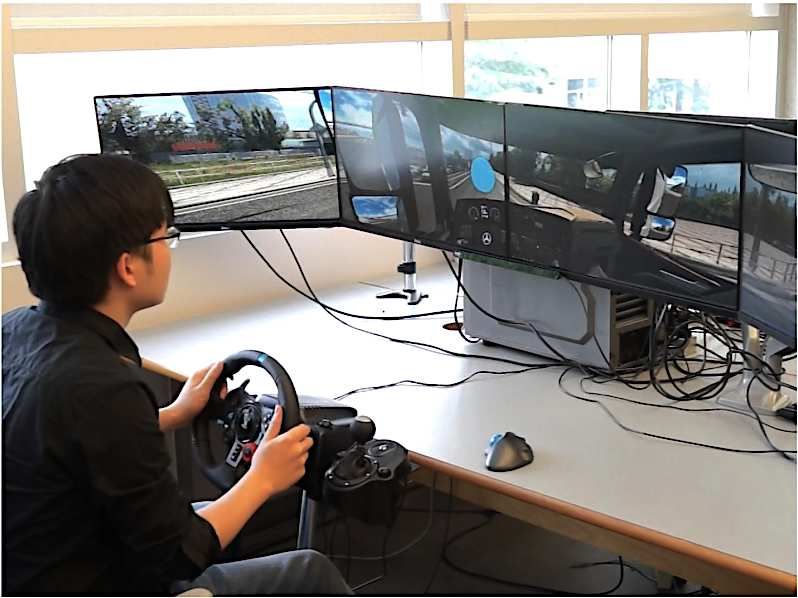
since 2010 (inclusive).
    This report is structured as follows: Section 2 provides the necessary background for why eye movements are
needed and the advantages and limitations of using gaze as a proxy of drivers’ attention. Section 3 covers various
gaze data collection methodologies, and Section 4 lists measures of attention based on gaze and links them to
various phenomena observed in behavioral literature. Section 5 introduces external and internal factors studied with
respect to drivers’ attention, establishes connections between them, and highlights historical trends in the literature.
Section 7 continues by reviewing the literature associated with each group of factors in detail. Analytical models
of drivers’ attention are covered in Section 8. Practical works, including publicly available datasets, algorithms
for predicting drivers’ gaze and monitoring drivers’ behaviors, as well as applications of attention in self-driving,
are reviewed in Section 9. Discussion of the results, outstanding questions for future research, and conclusions are
presented in Section 10.

2     What can and cannot be revealed about attention by gaze?
Even though vision does not constitute 90% of the sensory input to driving [363], as previously claimed [321, 157],
it is generally acknowledged that drivers’ decisions are largely based on what they see, and accidents may happen
when drivers fail to look at the right place at the right time [409].
     Driving is not a single activity but rather a set of concurrent tasks with different and sometimes conflicting
visual demands. For example, drivers observe the forward path, sides of the road, and lane markings to keep the
vehicle in the center of the ego-lane and within a safe distance of the cars ahead. Besides controlling the vehicle,
they must follow the traffic rules and keep track of signs and traffic signals. They might sometimes need to verify
the route to the destination by checking the guiding signs or in-vehicle navigation system. Various maneuvers such
as changing lanes, turning, and avoiding obstacles require looking at different parts of the scene around the vehicle.
Finally, unexpected hazards, e.g. a lead vehicle braking or pedestrian crossing the road, may suddenly appear.
     Besides task demands and anomalous events, physical and emotional condition of the drivers affect where and
when they look, as well as their driving skills and the presence of distractions. The analysis of statistical relation-
ships between changes in drivers’ gaze patterns, their internal states, and external factors comprises the bulk of
behavioral research (covered in Section 7) and is widely used in practical applications (Section 9). Even though
drivers’ gaze has been an indispensable tool in attention research for decades now, eye movements provide an
incomplete representation of the drivers’ sensory experience and processing. Thus, the nature of internal mecha-
nisms involved in attention allocation, processing of the selected regions, and generation of motor actions remain
an area of active research. This section will briefly discuss the biological characteristics and limitations of human
vision and visual attention, how they relate to various driving-related tasks, and what insights into drivers’ attention
can and cannot be gained from the gaze.

2.1    Covert, overt and divided attention
Limitations of gaze as a proxy for attention. Human vision is foveated, i.e. visual acuity is highest in the center
of the visual field (fovea) and degrades towards the periphery due to the non-uniform distribution of receptors in
the retina [286, 100] and neural tissue dedicated to processing visual stimuli in the cortex (cortical magnification)
[84]. The visual field is commonly divided into fovea (2◦ in diameter), parafovea (up to 5◦ ), together referred to as
the central vision, and the periphery that covers the remainder of the visual field. Since only a small portion of the
environment in the parafovea (Figure 3a) can be captured with high resolution, eye movements are necessary to
bring new targets into the central visual field. Such sampling of visual information via eye movements is referred
to as overt attention. Covert attention, or changing the focus of attention without explicit gaze change, plays a
role in planning future eye movements. Overall, attention towards various elements of the scene is enabled by a
set of mechanisms that perform selection, restriction, and suppression of features, objects or areas [397], and is
influenced by both the demands of the current task and involuntary attraction towards salient regions (as explained
later in Section 2.3). Even though gaze is strongly correlated with overt spatial attention, it does not provide full
information of the driver’s sensory experience for reasons discussed below.
Foveal vision 6= awareness. Looking at a specific object or area in the scene does not guarantee processing;
in other words, the relationship between awareness and attention is not symmetrical. Even if an object or event
falls within the foveal region, it may still be missed. It is well-documented that people often fail to notice things

                                                           3
UFOV
                                                                     Fovea

                                                                 o
                                                            20

                                                                 o
                                                            40

                                                                 o
                                                            60

                                                              o
                                                            80

                                                       Binocular FOV

                                            (a) Human binocular visual field

                              +                                                     +

                                         (b) Foveated images of the traffic scene

Figure 3: a) Visualization of the human binocular visual field (gray area), fovea, and useful field of view (UFOV);
b) Foveated images of the traffic scene. Right: distortion in the periphery according to the Texture Tiling Model
[333]. Left: loss of resolution in the periphery according to Geisler & Perry model [140, 396]. In both images the
green cross shows the point of gaze and the blue circle indicates the UFOV with a diameter of ≈ 30◦ . Source:
[438].

that are in plain sight. One example of this is change blindness – missing a significant and obvious change in
the environment. This phenomenon may be caused by incomplete, nonexistent, or overwritten internal visual
representations as well as comparison failures [178]. The established experimental paradigm for studying change
blindness is as follows: the scene is briefly shown to a subject, followed by a blank, and then again the same
scene is shown, either unchanged or with some objects removed or added [319]. Similar conditions occur naturally
during driving due to blinking, saccades, and physical occlusions, however, motion and illumination cues usually
mitigate the effects of change blindness [464]. When these additional cues are reduced or removed, drivers fail to
notice changes to the traffic signs even when explicitly told to look for them [268, 148] and miss changes to other
objects in the environment [44].
Divided attention. Drivers are often required to divide their attention between two or more concurrent tasks,
which typically affects their performance in some or all tasks. A common theory behind this observation is that
attention allocates limited resources between tasks with stronger negative effects when different tasks compete for
the same resources [311]. For example, driving as a visuomanual activity is affected by the tasks that are visual
(reading), manual (eating), or visuomanual (texting), although cognitive distractions likewise have adverse effects
(discussed later in Sections 6.1 and 7.5.2).
    Inattention blindness, i.e. failure to notice an event or object when attention is diverted towards another activity
[178], is a commonly observed phenomenon caused by divided attention. Some examples are reduced attention
to safety-critical objects such as signs due to “zoning out”, i.e. driving without awareness, especially on familiar
routes [73], and failing to see hazards while talking to a passenger [433]. Shallow processing due to inattention

                                                            4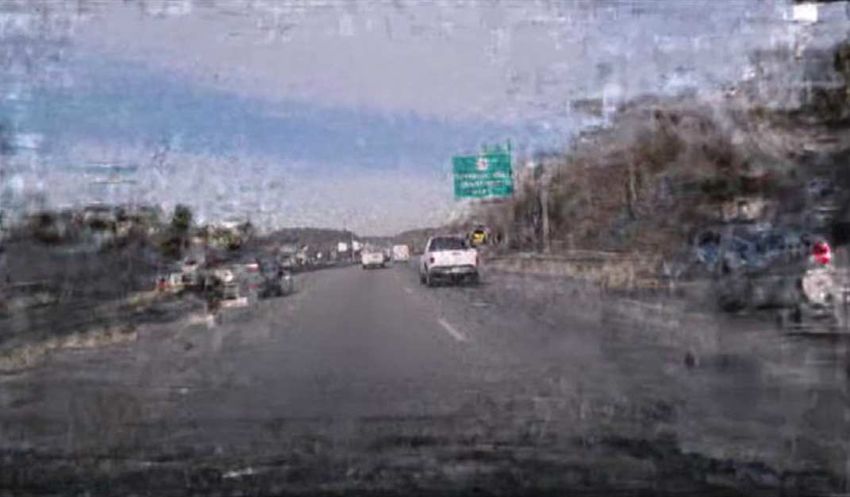
blindness may lead to “looked but failed to see” (LBFTS) errors that cause many accidents, particularly violations
of right-of-way at T-intersections. In such cases, drivers fail to see the approaching motorcycle, bicycle, or another
car and pull out in front of it [94, 433, 400, 327].
The role of peripheral vision. The area outside of the fovea, referred to as periphery, comprises more than
95% of the visual field that spans over 200◦ horizontally and 125◦ vertically [371] (see Figure 3a). Although
acuity decreases with eccentricity, peripheral vision is not merely a blurry version of foveal vision. For instance,
perception of contrast [227], color [147], motion [429, 393], size, shape [36] and category [63] of objects is
different in foveal and peripheral vision. Some of these differences (e.g. contrast sensitivity and acuity [41])
stem from a higher concentration of receptors in the fovea and cortical magnification and can be minimized by
scaling the stimuli so that they appear larger in the periphery. However, some differences in motion perception
or symmetry detection are not scalable (see [372] for a comprehensive review). Another well-known property of
peripheral vision is crowding, defined as an inability to discern fine details and properties of individual objects at
high eccentricities [434, 332, 371].
    Most of the research on peripheral vision is conducted using artificial stimuli (e.g. gratings and characters)
presented at eccentricities not exceeding 20◦ , whereas investigations of real-world scene perception are rare and
fragmented [250]. Therefore less is known about peripheral perception for everyday tasks. In driving, for instance,
relevant cues often appear in the periphery, away from the center of the road, where both crowding and loss of
resolution are apparent (see Figure 3b). Nevertheless, most research on attention and driving focuses on foveal
vision, while peripheral vision has been historically relegated to detecting global motion cues, such as optical flow
[275]. This property is useful for lane maintenance; in fact, experienced drivers can control the vehicle relying
on peripheral vision alone, as demonstrated by Summala et al. [375]. Besides lateral control [95, 96], peripheral
vision plays a role in hazard detection [352, 439, 441] and recognition of road signs [89].
    Even though some driving tasks can be done with peripheral vision, it is not safe to do so. The forced-peripheral
conditions elicited slow responses to road hazards such as suddenly braking lead vehicles [374]. Likewise, reaction
times and miss rates for target detection increased with eccentricity [312, 439]. Limitations of peripheral vision
may contribute to LBFTS errors and reduce sign identification ability. For instance, at intersections, motorcycles
and vehicles located the same distance away have different spatial frequencies and present different sizes of the
images on the retina. Vehicles appear as large blocks of moving color, whereas motorcycles are small and easily
blend into the surrounding clutter with high-frequency textures such as road markings, signposts, and trees [94].
For similar reasons, signs with singular shapes (e.g. cross sign) can be identified even far in the periphery, however,
uniformly shaped signs with pictograms or text are more easily confused with one another and other elements of
the road scene [89].

2.2    What can be captured with one glance?
Useful (or functional) field of view (UFOV) is a theoretical construct widely used in the transportation literature
(see reviews in [292, 388, 438]. UFOV, first proposed by Sanders in 1970 [340], describes a visual field from which
information can be extracted in a single fixation. The diameter of UFOV is 30◦ around the fovea as shown in Figure
3a. Based on this measure, Ball et al. [37] developed a test (also called UFOV) to map out the functional field of
view of older drivers who may be at risk for an accident due to vision impairments. UFOV test examines processing
speed, divided and selective attention using foveal identification and peripheral localization tasks. These tasks are
performed separately and together, with and without distractors, while the presentation duration and eccentricity
of stimuli within UFOV are manipulated. These conditions simulate peripheral detection and orientation tasks that
drivers perform while focusing on the forward roadway.
    The inability to perceive safety-critical information due to reduced UFOV in older drivers has been linked to
increased risk of crashes in multiple independent studies [291, 83, 39, 46, 97]. Besides age, the reduction of UFOV
can be caused by changes in cognitive workload [38, 399, 50] and fatigue [329].
    Despite its widespread use, UFOV has limitations. The implication of UFOV that areas outside of it are
minimally processed or not processed at all have been questioned lately [438]. “Visual tunneling”, i.e. narrowing
of the UFOV during an increased workload, implies a reduction of sensitivity in the periphery of the visual field
[261]. More recent literature, however, suggests that the performance reduction is not localized in the periphery but
covers the entire retina and the apparent tunneling is a result of interference of the two concurrent tasks [464]. The
original definition of UFOV covers only a small portion of the visual field, however peripheral areas beyond UFOV
are also useful. As shown in Figure 3b, cars and edges of the road remain distinguishable at high eccentricities.

                                                          5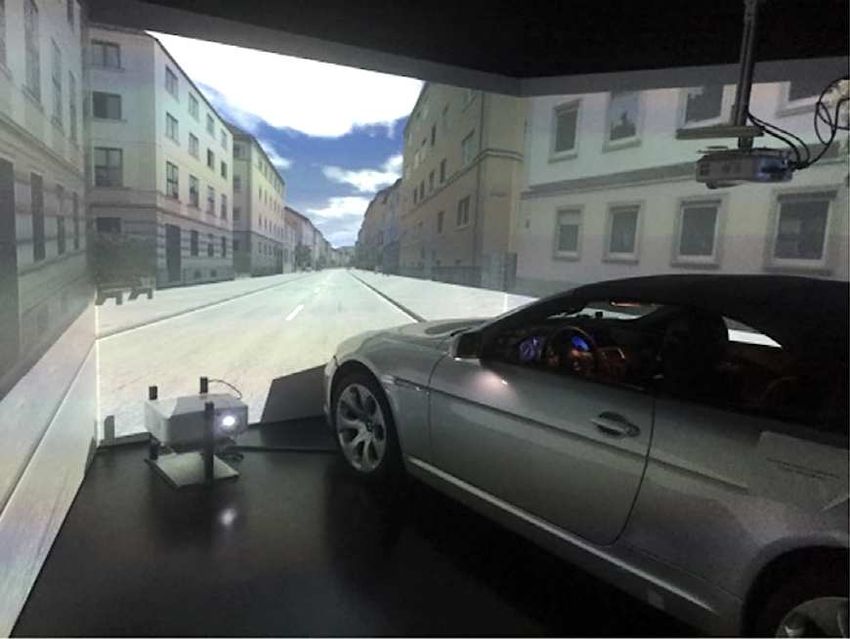
As a result, later studies considered extending UFOV to 70◦ in diameter [169]. Lastly, UFOV does not take into
account depth. There is evidence suggesting that declining detection performance is a function of target eccentricity
as well as distance. In other words, attention is optimal at some 3D point in the scene and declines as targets are
farther away from that position in 3D [29, 30].

2.3     What determines where we look?
What prompts changes in gaze locations is a major topic of research in attention. Mechanisms of attentional control
are commonly divided into the bottom-up and top-down [457]. The former is viewed as a process guided primarily
by the properties of the scene and depends on the saliency of objects which attract gaze, unlike featureless areas
[394, 171]. In contrast, top-down attention is driven by the demands of the current task [458]. In other words,
even salient stimuli may fail to attract attention if they are irrelevant to the task. Some researchers argue that the
bottom-up/top-down dichotomy does not describe a full range of selection phenomena. Selection history [33] or
memory-based attention [380, 167], i.e. attentional control based on past experience and rewards, is proposed as an
additional category of control mechanisms that are neither fully stimulus- nor task-driven. Although this category
is not explicitly considered in driving literature, multiple studies indicate that where and when drivers look depends
on their experience [72, 207] and familiarity with the route [262, 62].
    Both bottom-up and top-down control are involved in driving, but their relative contributions or how they
are integrated remain open research problems (see Sections 8 and 9 for existing theories and implementations).
Experimental evidence suggests that top-down attention plays a large role in driving. For instance, drivers’ vi-
sual strategies change when the priorities of driving tasks are manipulated. For instance, drivers monitor their
speedometer more often when maintaining speed is prioritized over vehicle following) [373]. The fact that the
horizontal spread of search is not affected during nighttime driving similarly suggests that it is not dictated by the
bottom-up stimuli whose influence would be reduced in the dark [207]. Furthermore, change blindness depends
on the relevance of objects to the task, e.g. changes involving trees and buildings were missed more often than
changes involving vehicles and signs [44].
    Bottom-up strategies for driving are investigated as well. Experiments show that it is possible to make stop-and-
go judgments after viewing scenes with high-saliency regions masked or scenes where only high-saliency regions
are visible (saliency is determined by a bottom-up algorithm [170]). This is not surprising as many important
objects in the scene, such as signs, traffic lights, and vehicle signals, are salient by design. At the same time,
because bottom-up cues are not optimal more information from larger non-salient areas is required for better
decision-making which reinforces the role of experience in locating critical information within the scene [266].
Low bottom-up saliency contributes to LBFTS errors involving motorcyclists and bicyclists at the intersections
[94, 400]. Here too, top-down strategies may mitigate some of these effects as drivers who are also experienced
motorcyclists make fewer mistakes [94].

2.4     Summary
The neurophysiological properties of vision in the central visual field differ from those in the periphery. Since
sharp vision is available only within a small area in the fovea, the observed scenes are sequentially processed
via eye movements towards different areas and objects. It is often presumed that during driving, most of the
information is processed in the fovea; therefore, gaze can tell where the drivers looked at any given moment of
time but cannot serve as a proxy of their attention. Another common assumption is that drivers’ eye movements are
guided primarily by the demands of the task. Thus gaze can, to some extent, shed light on their decision-making.
    On the other hand, gaze has a number of limitations:
      • Gaze alone does not reveal whether visual processing was successful. Ample experimental evidence shows
        that in many instances foveal vision does not guarantee awareness, e.g. due to attention being diverted
        elsewhere.
      • Gaze does not reveal anything about covert changes in attention and provides very limited insight into pro-
        cessing in the periphery which comprises over 95% of the visual field. As recent studies indicate, peripheral
        vision, despite its limitations, plays a larger role in driving than initially thought.
      • Eye movements are prompted by a complex interplay between involuntary attraction to salient areas and
        task-driven attention, but the relative contributions of the bottom-up and top-down factors are unknown.
                                                          6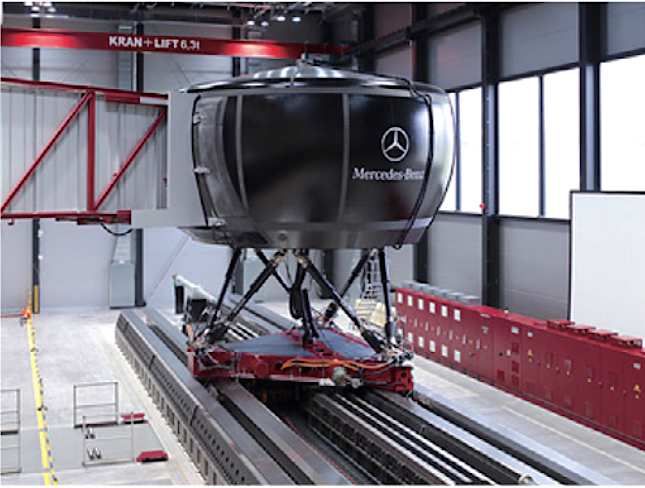
Besides theoretical interest, understanding internal mechanisms that result in the observed gaze distribution
        has practical implications, e.g. with regards to the effects of the driving experience or environment on gaze
        allocation.

3       How to collect drivers’ gaze data?
Besides the limitations of gaze as a proxy for drivers’ attention that stem from the biological characteristics of
human vision, its utility may be further affected by the data collection procedures. Driving has unique characteris-
tics, such as the active nature of the task, dynamic environment and observer, 3D visual field, and, particularly, the
risk of harming oneself or others. Unlike other visual tasks commonly studied via eye movement analysis, such
as reading, visual search, and saliency, driving requires a data collection methodology that can accommodate its
properties.

3.1     Conditions for gaze data collection
When collecting gaze behavior data, there are three important considerations: active vehicle control, physical and
visual realism of the in-vehicle and external environment, and gaze recording equipment. Driving is a visuomotor
task, meaning that there is a strong link between motor actions and gaze. Therefore, allocation of attention should
be studied by analyzing fixation patterns and other gaze-related statistics coupled with motor actions. Ideally, such
data should be recorded in a naturalistic setting in an actual vehicle while the person is actively engaged in the
task, except when it is not safe or legal (e.g. for studying hazard perception or drowsy driving). Driving simulators
are often used as an alternative to real vehicles but differ significantly in the level of physical and visual realism
they provide. Finally, equipment for recording gaze should have high resolution and precision without limiting the
driver physically.
    The diagram in Figure 4 shows the relative proportions of data collection methods in the behavioral literature. It
can be seen that only one-third of the studies are conducted on-road, and the rest in driving simulators. Nearly 20%
of all experiments are done without active control of the vehicle, instead, subjects passively view the prerecorded
driving videos on the monitor. ”Shadow driving“ is a recently introduced technique where subjects are asked to
use vehicle controls to match driver’s actions in the recorded videos. Below we discuss these experimental setups,
their advantages, and limitations.

3.1.1    On-road studies
All on-road studies are conducted in instrumented commercial vehicles and usually involve active vehicle control
(except for studies involving highly-automated vehicles), but within this group, there are gradations in the level
of realism they provide. We further subdivide on-road studies from the least to most restrictive into naturalistic,
directed, and closed track.

      • Naturalistic studies, i.e. when participants use instrumented vehicles for their daily activities, comprise
        about 40% of all on-road studies. While this method offers a look into real driving patterns, it is not without
        downsides: 1) Because driving tasks are not specified in advance, drivers’ behaviors are highly variable.
        Hence, a large volume of data should be gathered to study rare or specific scenarios. This, in turn, leads to
        other issues such as processing, storing, and analyzing large volumes of data. 2) There may be geographic
        and population biases as the studies are conducted with a limited population of drivers, and within a certain
        geographic area. 3) Specifically for studies of driver attention, the data may be of insufficient quality. It is
        costly to instrument the vehicle with eye-tracking equipment, which requires maintenance and may suffer
        from data loss. As a result, nearly all large-scale naturalistic studies resort to annotating drivers’ gaze from
        driver-facing cameras installed inside the vehicle. These issues are further discussed in Sections 3.2.3 and
        3.2.2.
      • Directed on-road studies are also conducted on public roads but allow for more control over the experimental
        conditions. The drivers are given a route and may be accompanied by the researcher during the experiment
        to deal with technical issues as they arise. Fixed route and/or task reduces the variability of the driver’s be-
        havior, thus removing the need for large-scale data collection. However, if the vehicle used in the experiment
        is not owned by the participant there is a concern that lack of familiarity with the vehicle may affect their
                                                            7
passive
    shadow driving

                                                                                       active
                                                                    low

                                                      simulator
                     active
                                    med
                                                                             cl osed tr ack
                                                                                              active
                                                             on-road
                                                                          naturalistic

                                               high                                      active
                                                            directed

                                      active
                                                                active
                  shadow driving

Figure 4: Data collection methods used in behavioral studies. The innermost circle represents the types of en-
vironments: driving simulator or real vehicle. The inner ring shows fidelity/realism of the environment and the
outermost ring specifies whether the control of the vehicle was active (the experiment subject drove the car) or
passive (the experiment subject watched a prerecorded driving video or vehicle control was automated). “Shadow
driving” indicates that subjects used vehicle controls to mimic the prerecorded driving videos. The areas of the
individual segments are proportional to the number of papers that used the corresponding data collection method.

      behavior [460, 213] and that few minutes of practice in the new vehicle before the start of the experiment are
      not sufficient [88, 194]. Furthermore, to reduce risk, on-road experiments are often conducted during off-
      peak hours [116, 90, 460] which may bias the results. Despite these restrictions, it is still difficult to replicate
      conditions exactly across participants as there is inevitable variability in the environmental conditions and
      vehicle control. Thus ecological validity of the on-road studies imposes a loss of experimental control and
      data interpretation challenges [218].
    • Closed track studies are conducted in specially built environments or isolated parking lots. Such environ-
      ments have been used for experiments that would be otherwise risky to conduct on public roads (e.g. hazard

                                                           8
15
                                                                                                   high
                              12
             Fidelity score

                              9                                                                    med

                              6

                              3                                                                     low
                              0

                                     visual              motion               physical

Figure 5: A bar plot showing the distribution of simulator fidelity scores. Each stacked bar corresponds to a single
study. Scores for visual, motion and physical fidelity are shown in blue, green, and yellow colors respectively.
Based on the total score, simulators are divided into three groups: high (12 − 15), medium (7 − 11) and low (1 − 6).
Examples of simulators above the bar plot (left to right): 1) high-fidelity simulator with the dome providing 360◦
FOV, full cab inside the dome with a movable base, 2) medium-fidelity simulator with a full cab and no moving
base with 3 projectors providing 135◦ FOV; 3) low-fidelity PC-based simulation with arcade seat and 4 monitors
with FOV < 180◦ ; 4) low-fidelity simulation with a single monitor and a joystick. Sources: 1) [121], 2) [256], 3)
[186], 4) [342].

        response during automated driving [411] or parking [200]). At the same time, reduced risk and lack of
        interaction with normal traffic may reduce participants’ sense of danger and bias their behavior.

3.1.2    Driving simulators
Driving simulators offer advantages unattainable in on-road conditions: an identical route for all subjects, the abil-
ity to trigger events at known times and to limit vehicle control variability. Besides replicating the same conditions
across many subjects, some simulation experiments are more scalable and cost-efficient (for the history and ex-
tensive review of driving simulators see [69]). Despite these desirable properties, the validity of the simulation
studies, i.e. whether the conclusions translate to on-road conditions, is not guaranteed and should be verified.
Absolute validity, i.e. matching results from the simulated and on-road studies, is preferred. In most cases, relative
validity is acceptable, meaning that the trends, patterns, and effects found in the simulation study are similar to
those observed on-road but differ in absolute numerical terms [69].
Simulator fidelity and validity. The simulator fidelity defines how faithfully it can reproduce the environment
inside and outside the vehicle along multiple dimensions such as visual appearance, motion, and sound. A large
variety of commercial and custom-made simulators range from a PC-based simulation showing recorded driving
footage on a monitor to state-of-the-art setups with 360◦ field of view and an actual vehicle placed on a moving
base (see Figure 5). In the literature, simulators are broadly divided by fidelity level into low, medium, and high,
but there are no fixed criteria for how these levels are defined, to the best of our knowledge. As a result, the same
simulator model may be assigned different fidelity types in different studies. For consistent fidelity assessment,
we adopt the scoring system proposed in [449] where the visual, motion, and physical fidelity scores determine
the fidelity of the simulator (Table 1). Based on the total score, simulators are divided into three groups: high
(12 − 15), medium (7 − 11), and low (1 − 6). Figure 5 shows the distribution of the scores for simulators used in
the 125 behavioral studies reviewed.
     Contrary to intuition, simulator’s fidelity is not directly associated with validity and depends on what measures
are being compared, as shown in the recent meta-review of validation studies by Wynne et al. [449]. Although
the review focuses primarily on validating driving performance measures such as steering, speed variation, and
                                                          9
Score
                        1                     2                     3                    4                     5
 Fidelity type
                                     Projector/PC monitor    < 180◦ FOV         180 − 270◦ FOV         > 270◦ FOV
 Visual          PC monitor
                                     > 2500 diag             (PC monitors)      (PC monitors)          (projector)
                                                             < 6DoF or                                 Motion-base or
 Motion          No motion base      -                                          -
                                                             partial plate                             full motion plate
                                     PC with                 Arcade seat with   Vehicular controls,    Full vehicular cab
 Physical        Keyboard/joystick
                                     steering wheel          steering wheel     no or incomplete cab   and controls

Table 1: Simulator fidelity scoring table with criteria for evaluating fidelity of visual input, motion, and physical
vehicle controls. Adapted from [449].

lane maintenance, the authors noted that only non-valid results are reported for gaze measures regardless of the
simulator sophistication. In our review, only a handful of results were validated, mostly across different types of
simulators. For example, Kim et al. [196] examined the effect of vehicle control on attention distribution and
Mangalore et al. [293] showed that hazard perception using a virtual reality (VR) headset produces the same
results as an advanced driving simulator. The study by Robbins et al. [326] is the only one where the results
obtained in an on-road experiment are compared to those from a high-fidelity driving simulator. They conclude
that the absolute validity of the simulator is reached for medium- to high-demand situations.
Visual fidelity. Scores proposed in [449] are defined by the field of view, which has been shown to affect validity
[27]. Recently, several studies proposed to use virtual reality (VR) headsets as a tool for studying driver attention.
VR headsets produce 360◦ immersive environment, thus eliminating the cost of projector arrays and the need to
install a full vehicle cab. Besides, many models may be fitted with eye-tracking equipment. The validity of VR
headsets for a variety of tasks is not yet established, as, to date, only one study validated a VR headset in a driver
hazard anticipation experiment [293].
    One other aspect of visual fidelity, the visual realism of the simulation, is less studied. Despite significant im-
provements computer graphics quality over the past years, most driving simulators still look undoubtedly artificial.
But does photo-realism matter at all for driving studies? So far, the studies on this are scarce, and evidence is
inconclusive. For instance, Ciceri et al. [80] found that experienced drivers had distinctly different gaze patterns
when watching driving footage vs video game recordings. In a more recent study, Kim et al. [196] showed that
gaze behavior was the same when watching real or computer-generated videos, however, only hazard perception
scenarios were considered. A validation study by Robbins et al. [326] established that visual behavior at real
and simulated intersections was similar as long as the task demands were at least moderate. Differences in gaze
measurements were small when the driving maneuver was easy, such as going straight, and more pronounced when
turning right (the experiment was conducted in the UK).
    The amount of visual detail provided by the simulated environment matters too, as shown in the study by van
Leeuwen et al. [404]. During the experiment, the route remained the same for all participants while the simulated
graphics was manipulated. Depending on the condition, the full environment was shown, with or without roadside
objects, or only lane markings and the road center were visible. Significant differences were observed in the
steering activity, lane-keeping, and speed between the highest and the lowest fidelity conditions.
Physical and motion fidelity. Driving simulators vary significantly in the appearance and authenticity of con-
trols, from a full vehicle cab to a steering wheel mounted on the office desk to a computer keyboard. Although
visuomotor coordination during driving is well-studied and strong links have been established between driving
performance and visual attention measures (as will be discussed later in Section 4.3), there are not many investi-
gations into changes in attention distribution without active vehicle control. For instance, it was found that drivers
who controlled the vehicle scanned the environment less and looked closer to the vehicle. Their reaction time to
hazards was 1−1.5s longer than that of the subjects who were passively watching prerecorded videos [259]. When
negotiating the curves, the drivers who were actively steering made fewer look-ahead fixations and focused on the
areas that were important for visuomotor coordination [260].
    In some studies, to compensate for the lack of vehicle control in low-fidelity simulators, the subjects are asked
to “shadow drive”, i.e. rotate the steering wheel and use pedals to match what they see in the prerecorded driving
videos [238, 80]. Alternatively, drivers can use the wheel to control a digital crosshair superimposed on top of
the driving video to simulate vehicle control [195, 196]. According to these studies, the mimicking task creates
a more immersive experience and increases cognitive workload in simulation, matching real driving. Kim et al.

                                                            10
Single-session
250 (duration n/a)
250
250
Single-session
51%
200 (duration n/a)
200
(min)
200
More females51%
(min)
Duration (min)
250
150
150 150 More8%
females
Duration
200 Unspecified
8%
Duration
Unspecified
Duration (min)
100
100 150
76
76
18%
100 50 76
18%
Longitudinal
50 100
0
76 2%
50 Single-session Longitudinal
50 Multi-session
0 41% 2%6%
0
0 350 Single-session
312 Multi-session
300 (a) Session durations 41%Balanced
Balanced (b) Sessions 6%
350 30%
350
Number of subjects
250
312
30%
350 312 300 More females
200 Unspecified
300 312 8%
Number of subjects
250
300 150
More females 18%
200 Unspecified
8%
subjects
250 100
18%
subjects
250 150
50 40 Balanced
200 100 30%
200 0
Balanced
of of
50
150
40
More males
Number
30% More males
150 44%
Number
0
100 More44%
males
100 44%
50 40 More males
50 40
44%
0
0
(d) Gender balance
(c) Number of participants
Figure 6: a) Bar plot of single-session study durations, one bar shown per study. The dashed line indicates the
average session duration. b) Pie chart showing proportions of studies that are conducted within one session, during
multiple sessions, and longitudinal studies which take course over weeks or months. 51% of the studies do not
specify duration. c) Bar plot of the number of subjects, one bar shown per study. The dashed line indicates the
average number of participants. 10 studies that did not specify the number of subjects are not shown. d) Pie chart
showing participant gender balance across studies. Balanced studies are ones where the difference between the
numbers of female and male participants is ≤ 5% of the total number of participants.
[196] show that “shadow driving” leads to the same visual attention allocation as active vehicle control.
We were not able to find research that validated eye-tracking data across intermediate levels of physical validity
or measured the effect of vehicle motion on gaze patterns.
3.1.3 Effects of laboratory setting and experiment design
Besides the environmental realism, the experimental procedure in the laboratory setting itself affects the transfer of
findings to the on-road driving conditions. Below we discuss issues that include the short duration of experiments,
a small number of subjects, high exposure to warning signals, and low workload and arousal levels of participants
(see also [159] for a more detailed analysis of these and other factors).
Experiment duration. As shown in Figure 6a, half of the studies take just over 1 hour that may also include the
instruction, post-experiment surveys or interviews, breaks between trials, etc., so the actual time spent driving is
likely shorter. It was observed in the 100-Car Naturalistic Driving Study that during the first hour, participants
were more attentive and involved in fewer incidents [110]. Thus, 5-10 minutes given to participants to familiarize
themselves with the vehicle or simulator before experimental drives might not be sufficient [127]. Only 6% of the
studies involve multiple sessions spread across different days, e.g. study on the effect of hazard perception training
for young drivers [387] and the experiment on the effect of route familiarity conducted over 28 sessions [460].
Longitudinal studies where information is collected over several weeks [213] or months [361] comprise only 2%
of all studies we reviewed.
Prevalence effects. In simulated studies, the frequency of events does not correspond to their real-world distri-
bution [442]. For example, during a single hazard perception session, drivers may be exposed to tens or even
hundreds of instances of events that are exceedingly rare in real driving environments. In addition to that, drivers
are often told to anticipate hazards or are primed to expect them based on the preceding trials. Thus, there is a
concern that such conditions may artificially inflate their performance [441].
11Manual
Static
annotation
2%
18%
Remote
40%
Head-mounted
40%
Figure 7: Pie chart showing the distribution of different eye-trackers used in the studies. Illustrative examples
of each eye-tracker type are shown next to labels. Sources: static [259], manual annotation [417], head-mounted
[377] and remote [175].
Lower workload/arousal is an issue, particularly for studies that do not involve any vehicle control and require
the subjects to passively view prerecorded videos. Since the participants’ actions do not affect the behaviors of
other road users, there is no risk involved. Therefore, participants may perform better on visual search tasks,
e.g. pedestrian detection [74]. When active control is required, simulator studies usually provide optimal driving
conditions, with reduced traffic and good weather [344, 355]. Lower workload may also result from the visually
impoverished simulated environment, even in high-fidelity simulators [326].
Number and diversity of participants. Most of the studies involve a small number of participants. As shown
in Figure 6c, the largest study involved 312 subjects, while the smallest study used only 1, with 40 subjects on
average. The majority of the studies use more males and only 30% of the studies are balanced across gender.
Demographics of the participants are often limited to university students or car company employees who are more
likely to be exposed to and have a positive attitude towards new technologies, affecting conclusions of studies
involving automation [123].
3.2 Recording drivers’ gaze
3.2.1 Eye trackers
Unlike the early days, where custom-built setups were common, most experimental work was done using com-
mercially available eye-trackers with different capabilities and costs in the past decade. Below we will discuss
properties of eye-trackers relevant to the studies in the automotive domain: type of the eye-tracker, sampling rate
(measured in Hz), accuracy, and precision.
• Type of the eye-tracker. Eye-trackers are subdivided into static (remote and tower-mounted) and head-
mounted. Naturally, eye-trackers that restrict head movement offer a better quality of data. For instance,
tower-based eye-trackers have high precision and support sampling rates up to 2000 Hz [12] but require the
use of a chin rest. Modern head-mounted eye-trackers allow for normal head movement and support reliable
head tracking and sampling rates up to 120 Hz. Remote eye-trackers are the least intrusive ones since the
image of the driver’s face and eyes is analyzed via camera(s) installed on the vehicle dashboard. According
to [161], tower-mounted systems have the highest accuracy and precision, followed by head-mounted and
remote eye-trackers.
As shown in Figure 7, only a few (2%) studies use static tower-mounted eye-trackers. Such experiments
require passively watching driving videos since most driving tasks cannot be performed without some head
movement. Less invasive head-mounted and remote trackers are used equally often (each in ≈ 40% of
studies), and the remaining 18% of works rely on manual coding of gaze from videos (as will be discussed
in Section 3.2.2).
Despite the growing number of commercially available eye-trackers, they are rarely compared head-to-head
on the same task. One such study by Funke et al. [133] evaluated multiple remote eye-trackers and reported
12on the calibration success rate, accuracy, and precision metrics. The authors concluded that calibration was
severely affected when subjects wore eyeglasses and that the quality of eye-tracking data degraded with
eccentricity (measured as the distance from the center of the screen). There are no comparative studies of
eye-trackers relevant to the driving task to the best of our knowledge. Meta-studies such as [190] aggregate
the results from multiple sources but the exact numerical comparisons are impossible due to variations in the
reported metrics and task conditions.
• Sampling rate of 30-60 Hz is common as this is also a typical resolution of video cameras. What rate is
sufficient or optimal depends on what is being measured. For instance, one of the primary metrics used in
many studies of drivers’ attention is fixation duration (see Section 4.2.1). When sampling at 50 Hz, there will
be a 20 ms window between samples, meaning that the fixation duration may be over- or under-estimated
at most by this amount. At 250 Hz this window shrinks to 2 ms. When measuring fixation duration, the
low sampling frequency may be mitigated by simply collecting more data, but for other common measures
such as saccadic velocity and acceleration, a higher sampling frequency is a must [161]. In the studies we
reviewed, there appears to be no relationship between sampling rate and amount of data gathered (in terms
of the number of participants and/or the duration of experiments), however, studies involving measurements
of saccades do tend to use higher sampling rates (> 60 Hz).
• Accuracy and precision measure the quality of the eye-tracking data. The accuracy of the eye-tracker is
defined as the average difference between the actual position of the stimulus and the measured gaze position.
Precision reflects how reliably it can reproduce repeated gaze measurements.
Most commercial eye-trackers provide accuracy and precision for various conditions and gaze angles. Typ-
ical accuracy in optimal conditions is within 0.25 − 0.5◦ of visual angle for static and head-mounted eye
trackers, and up to 1◦ for remote eye-trackers. Precision is rarely reported; where available it ranges be-
tween 0.01 − 0.05◦ root mean square (RMS) error. Both precision and accuracy degrade significantly in low
illumination conditions and for gaze angles beyond 15◦
Most in-lab experimental procedures include drift checks before each trial and recalibration of the equipment
during breaks to ensure good recording quality. In on-road studies, calibration is typically done once before
each driving session. A considerable length of some on-road experiments (e.g. 25 min [460], 40 min
[116, 144]) and suboptimal on-road conditions with changing illumination and frequent large gaze angles
[228] make it more challenging to maintain data recording quality. Only a few on-road studies incorporate
stops for recalibration [168, 76] or trigger recalibration automatically [24].
3.2.2 Manual coding of gaze
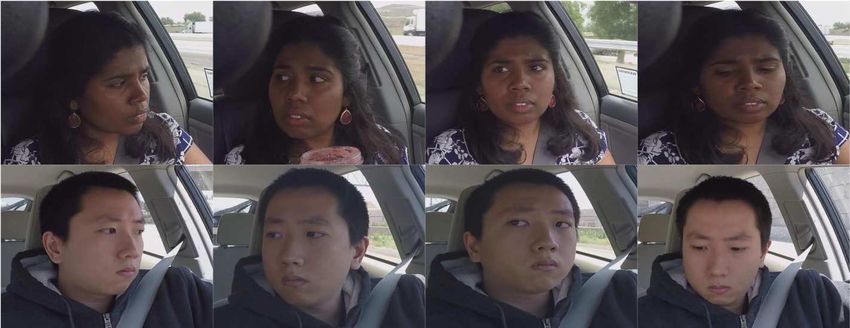
Manual coding of gaze is the process of annotating each frame of the video from the driver-facing camera with
a text label specifying in what approximate direction the driver is looking at the moment, e.g. rearview mirror,
straight ahead, or eyes closed (see definitions of areas of interest in Section 4.1.3). It is more common in naturalis-
tic driving studies due to the low cost, low maintenance, and non-intrusiveness of the cameras. At the same time,
human annotation of the data is a labor-intensive process, often requiring multiple trained annotators to reduce
subjectivity [276, 409, 240]. Due to subtle differences in drivers’ appearances depending on what area they focus
(e.g. moving eyes down to switch between the road ahead and speedometer) and large individual differences be-
tween drivers (as shown in Figure 8), consistent annotations are difficult to obtain, thus typical inter-rater reliability
reported in the papers is around 90% [205, 90].
Another aspect is the sampling rate of the driver-facing cameras which can be as low as 10 Hz [272, 351, 389,
240, 301, 290] and rarely exceeds 30 Hz (the most common frame rate for commercial cameras). Thus, manual
annotation of fixations may miss many fine details. For instance, eye movements occur at a high rate of once every
0.2 to 0.5 seconds [200], and at 10 Hz many short fixations are missed, increasing bias towards more prolonged
glances. It is also difficult to establish a gaze direction precisely from the video, hence gaze is coded with respect
to coarsely defined areas of interest [389] (see Section 4.1.3).
3.2.3 Data loss
More than 12% of the reviewed behavioral studies report issues with gaze data collection in both laboratory and
naturalistic settings. The reasons include the inability to calibrate the eye-tracker [27, 369] (especially at far
13Figure 8: Images from driver-facing cameras. Drivers are looking at (from left to right): left mirror, right mirror,
rearview mirror and radio. Source: [406].
(a) Reflection from eyewear (b) Blink (c) Large head angle
Figure 9: Examples of the common issues leading to data loss. Source: [224].
eccentricities [327]), large tracking errors up to 3◦ [168], and significant data loss from 10% up to 50% [317, 208,
267, 116, 229, 82]. Changes in the illumination and presence of eye-wear also affect studies that rely on manual
annotation of gaze from videos (see Figure 9). For example, in [194] it is reported that over 25% of recorded data
was not suitable for coding due to glare, and in [389, 301, 206] the videos with subjects wearing sunglasses were
not used.
Data loss is an issue not only for research, since it effectively reduces the participant pool, but also for practical
applications that depend on eye-tracking data, such as driver monitoring systems. Sun glare, the presence of facial
hair, glasses, and baseball caps, as well as physical occlusions (e.g. driver’s hand), can result in inaccurate or
missing data [301, 402, 166]. For example, in a field test of the distraction algorithm [24], data was of sufficient
quality only for 77% of the total distance driven by the participants.
3.3 Summary
The fidelity of the environment and the type of eye-tracking equipment determine how the drivers’ gaze is recorded.
Realistic surroundings and vehicle controls offered by on-road studies often come at the cost of losing control over
subjects’ behaviors and other aspects of the experiment. On the other hand, simulation studies allow the same
scenario to be replicated for participants, which is useful for studying specific behaviors. Still, validation is needed
to ensure that the results translate to on-road conditions.
The choice of equipment for recording gaze matters. Eye-trackers, remote or head-mounted, can precisely
capture where the driver is looking and allow for free head movement, however most models are expensive and
require maintenance, limiting their use in large-scale naturalistic driving studies. As an alternative, approximate
attended locations can be derived from images of drivers’ faces captured by the driver-facing camera via labor-
intensive manual annotation.
Significant data loss may result from eye-tracker failures, illumination changes, the presence of eye-wear, and
occlusions. The design of the experiments should account for such events by carefully selecting suitable equipment
for the given conditions and increasing the number of participants.
4 Measuring drivers’ attention
There are four types of movements that human eyes can make:
141. Saccades or fast eye movements to change gaze from one location to another;
2. Stabilizing movements stabilize gaze against head and body motion (vestibulo-ocular reflex) and retinal slip
(optokinetic reflex);
3. Smooth pursuit movements align fovea with targets that move at speeds not exceeding 15◦ s−1 (saccades are
used at higher velocities);
4. Vergence movements help focus on objects at different distances [248].
Research on driving and attention focuses predominantly on the episodes when the gaze is stationary, referred
to as fixations, and transitions between them or saccades. Other types of eye movements are rarely considered.
Although vergence may reveal information about the 3D location of gaze [248] or drowsy state of the driver [436],
detecting this type of eye movements is difficult in the driving environment due to changing lighting conditions
[162]. Likewise, microsaccades are not studied in the driving domain due to challenges in recording them outside
of laboratory conditions, as well as lack of understanding of their underlying neurological mechanisms and function
in spatial attention [303].
Raw gaze data recorded via eye-trackers is a set of timestamps and corresponding 2D coordinates. Although it
is possible to analyze raw data, further processing is necessary to extract fixations and saccades and alleviate noise
issues. Glance is a coarser unit, usually obtained by manual coding of gaze from videos ,but can also be derived
from eye-tracking data. Gaze coordinates, fixations, and glances are often assigned to predefined areas of interest
(AOI) inside or outside the vehicle. Multiple measures derived from these data points can be used to examine
various aspects of the driver’s attention allocation, e.g. how long and how frequently the driver was looking at
specific areas. Below we discuss data preprocessing and standard attention measures in detail.
4.1 Preprocessing raw eye-tracking data
4.1.1 Fixation definitions across studies
Fixation is defined as a brief period of time lasting from a fraction of a second and up to several seconds when
eyes are held steady at a single location. In reality, eyes rarely remain completely still due to small eye move-
ments such as drifts, tremors and microsaccades (also called fixational saccades) [248]. Even though research on
microsaccades has seen a steady rise, they are not addressed in the driving literature to the best of our knowledge.
Fixation extraction from eye-tracking data is done based on several parameters: fixation duration threshold,
gaze velocity, and dispersion (the spread of gaze coordinates that are aggregated into a single fixation). Since
microsaccades cannot be distinguished from saccades based on physical parameters (amplitude or velocity) [287],
care should be taken when determining fixation and saccade detection settings. Only some of the behavioral
and virtually none of the practical studies specify what fixation duration cut-off was used and even fewer mention
velocity or dispersion thresholds set for fixation detection algorithms. Values for these thresholds vary significantly
from study to study, from as low as 50 ms [373] and up to 333 ms [330]. In some cases, the authors use the default
settings provided by the eye-tracking software, e.g. 60 ms (Tobii [326]), 75 ms (Fovio [149]), or 80 ms (BeGaze
SMI software [116, 231, 232, 120, 354]). The most common setting is 100 ms (3 frames in a video recorded at 30
fps [433, 135] or 1 frame at 10 fps [425]), however proper justification for this choice is rarely given. Holmquist
et al. [161], often cited in this regard, use 100 ms threshold as an example but never claim that it is an appropriate
choice for all purposes.
Since driving is a dynamic task with continuous motion in the scene, lower fixation durations are used in some
studies. For instance, Costa et al. [88] suggest using a low threshold of 66 ms arguing that in dynamic visual
scenes short fixations and saccades account for a significant portion of all fixations (5.9%) and almost as many as
100 ms fixations which comprise 7.9% of the total.
Some studies use a higher threshold of 200 ms [414, 402]. The justification for this choice is the work by
Velichkovsky et al. [407]. The authors found that fixations below 90 ms result from large saccades, are followed
by very small saccades, and can be interpreted as stops on the way of correcting the eye position. Fixations of
90 − 140 ms produce large saccades of over 4◦ , beyond the parafoveal region of the retina, i.e. aim at blobs
not individualized objects - the case for preattentive processing. Longer fixations 140 − 200 ms are related to
focal processing and initiate saccades within the parafoveal region where objects are easily seen and continuously
attended.
15You can also read