BIG WHEEL KEEP ON TURNING - JASON MCNAMARA, CNA SUPPLY CHAIN FLOW - NEMA
←
→
Page content transcription
If your browser does not render page correctly, please read the page content below
Kathy Fulton, ALAN   Dave Kaufman, CNA Jason McNamara, CNA   Lars Hanson, CNA

                     Big Wheel Keep on Turning
                               Supply Chain Flow

                       Oct 28, 2019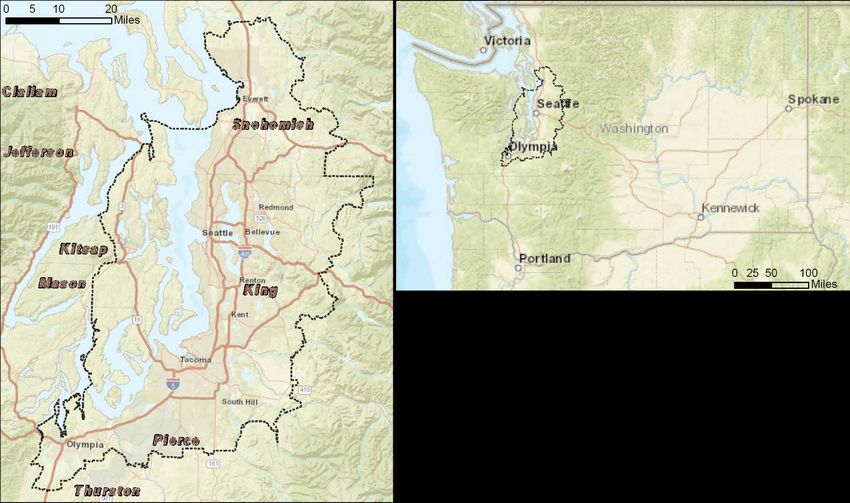
Baseline: The Disaster that Keeps you Awake at Night
            •       Picture your “White Whale” disaster
                     • East Coast: Hurricane
                     • Northeast: Blizzard, Nor’Easter
                     • West Coast: Earthquake
                     • Midwest: Historic Floods/New Madrid
            •       Describe your initial response actions
            •       What information do you require to guide your decision-making?
                     • What are the questions you will ask?
            •       What are your principal concerns?
                     • Population Safety
                     • Public Infrastructure Damage
                     • Security
                     • Resources/Logistics
            •       With respect to resources and logistics:
                     • How do you assess the needs of the population?
                     • How do you assess the health of supply chain systems?
                     • What are the your existing partnerships with private sector?
                     • What are your main information collection mechanisms?

Copyright © 2019 CNA. All rights reserved
                                                                                      |   2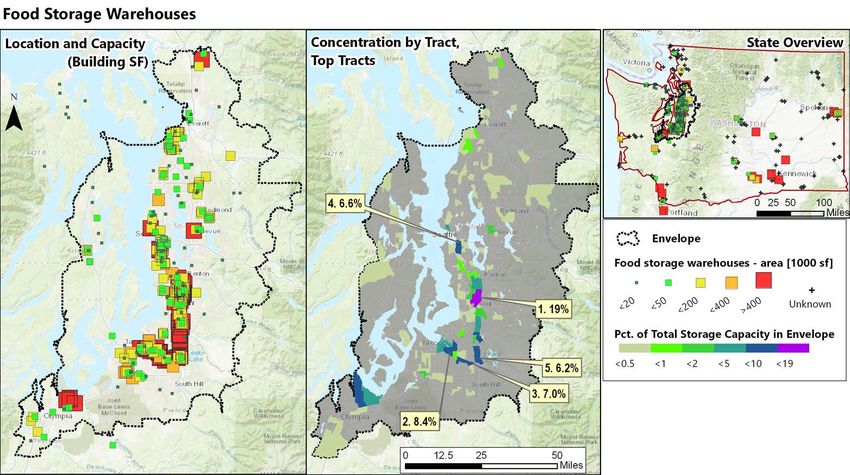
Engaging the Private
                                                  Sector

Copyright © 2019 CNA. All rights reserved
                                                                   |   3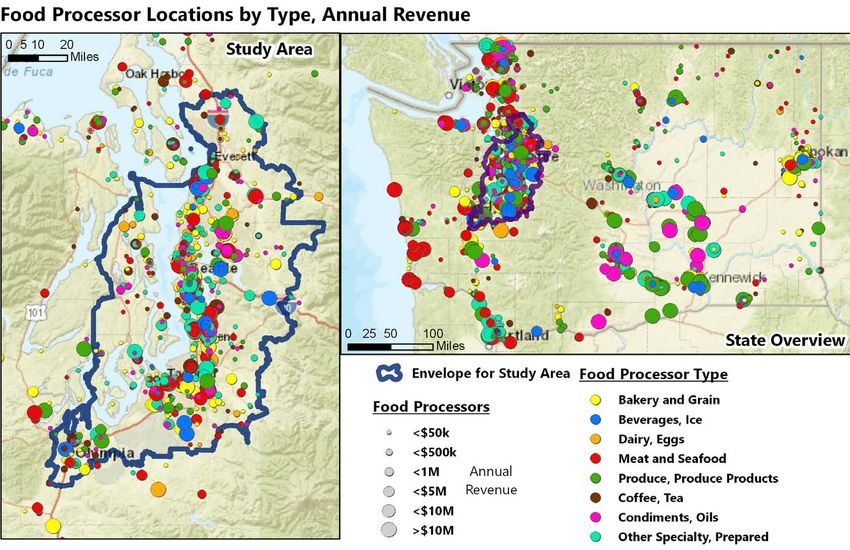
Discussion – communicating with the private sector

            1. What information are you asking for (and receiving)?

            2. What information would you like to have?

            3. What information are you sharing with them?

Copyright © 2019 CNA. All rights reserved
                                                                      |   4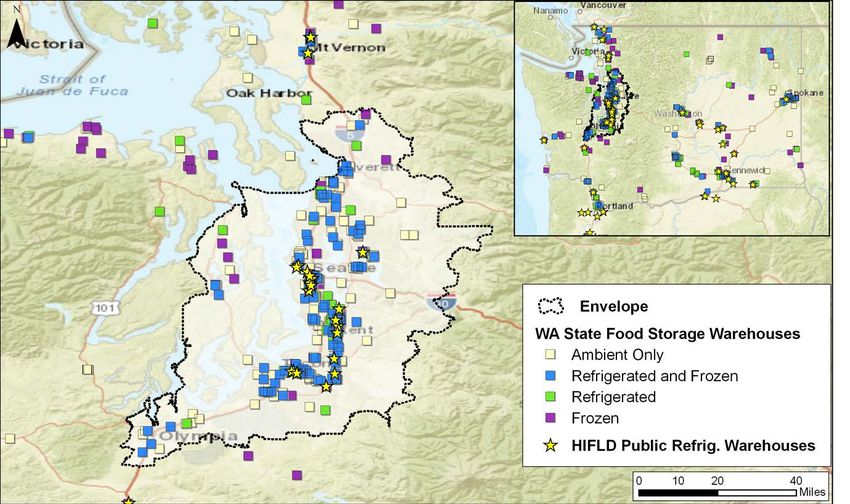
Examining supply chain
                                       flow in the real world
                                            I. Fuel in Florida
                                            II. Food in Puerto Rico
                                            III. Groceries in Puget Sound

Copyright © 2019 CNA. All rights reserved
                                                                            |   5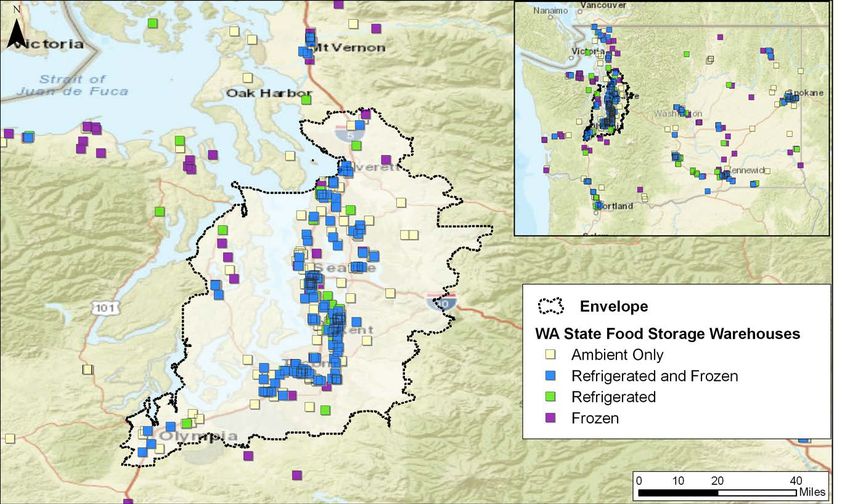
I. Fuel in Florida -
            • Hurricane Irma resulted in large scale retail fuel outages across the State of Florida
            • Florida gets nearly all of its fuel from petroleum terminals that receive deliveries by ship, and
              has few pipelines; Nearly all fuel stations receive fuel by truck from petroleum terminals

            • Quiz: Which major metropolitan area
              in Florida had the highest percentage of
              retail fuel stations without fuel during Irma?

Copyright © 2019 CNA. All rights reserved
                                                                                                                  |   6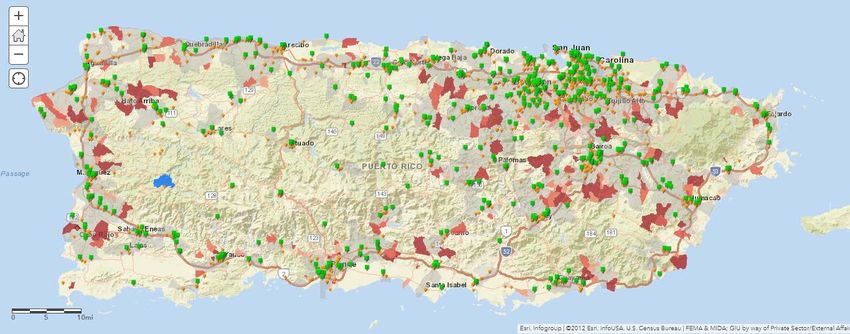
Understanding how the system works

                                            Landfall –1d       Landfall   Landfall +2d

           Sep 7, 6 p.m.
                                            Source: GasBuddy

Copyright © 2019 CNA. All rights reserved
                                                                                         |   7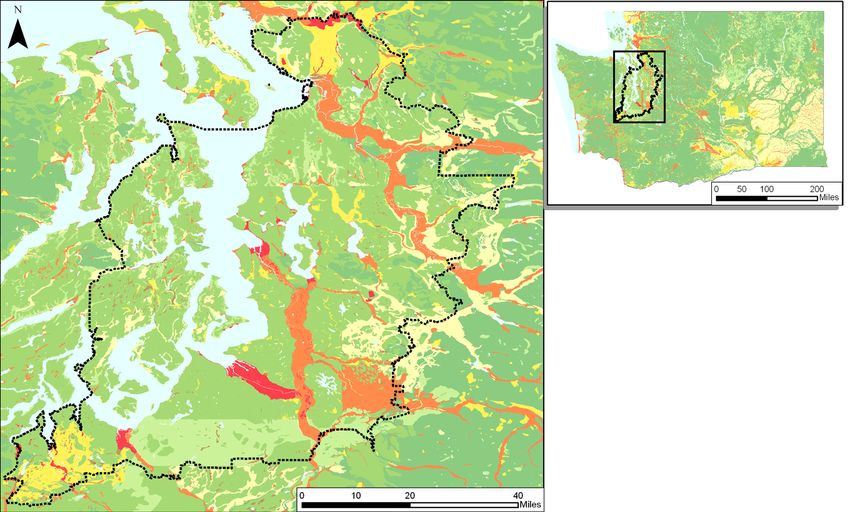
Fuel issues - Further confirmation during Dorian
                                                                         Areas furthest from fuel racks again show the
                                                                         highest percentage of stations with outages.

                                                                         If the petroleum terminals and fuel racks are
                                                                         operational, this is a case of demand exceeding
                                                                         supply capability, and will resolve on its own in
                                                                         a few days as deliveries catch up.

                        (w. truck access)    Gainesville area

                                                                Fort
                                                                Pierce

                                                   Naples,
                         (minutes, typical         Fort Myers
                         conditions)

                                                                             Gasbuddy, as of 12:30 8/30/2019

Copyright © 2019 CNA. All rights reserved
                                                                                                                         |   8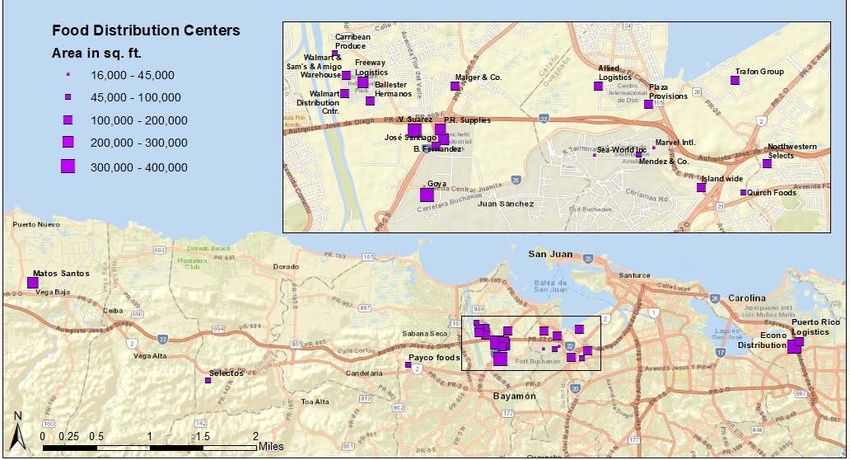
I. Florida and Fuel disruptions
            • Lessons learned- understanding how the system works:
               • Disruption influenced by predictable network characteristics: distance from
                 fuel racks, power outage and generator status.
               • Terminals with fuel racks are a critical node type and can be a bottleneck
               • Truck drivers and large truck stops are key parts of the system – What
                 about their needs?

            • Considering your “white whale” disaster, how would these lessons influence
              your thinking?

Copyright © 2019 CNA. All rights reserved
                                                                                               |   9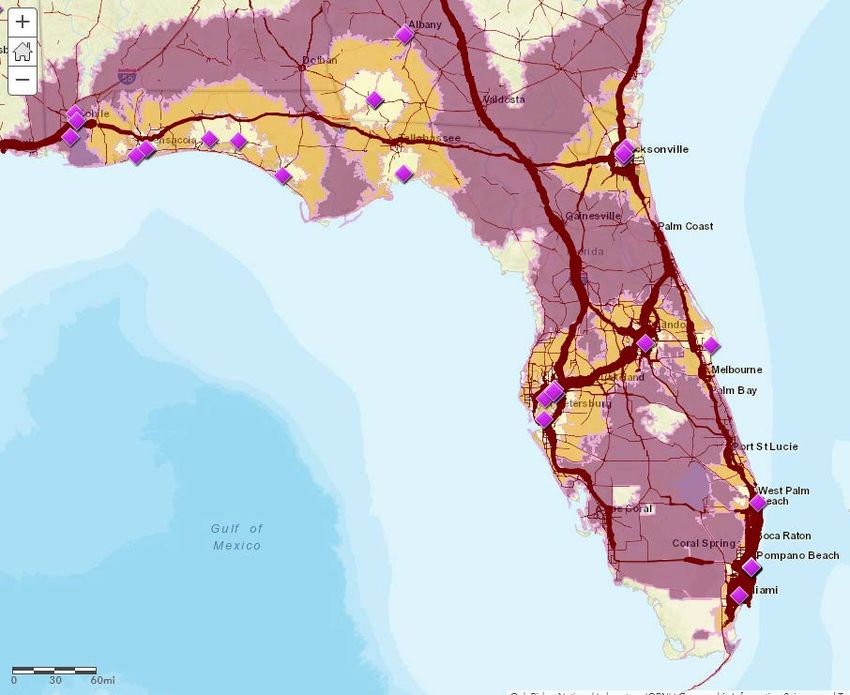
II. Food in Puerto Rico
            • Remember:
               • FEMA’s support to Puerto Rico after Maria was the largest food mission in
                 US history, over 62 million meals in the first 6 months
               • Puerto Rico’s population has a very high poverty rate
                                • Little food storage at home
                                • Over 40% of population dependent on SNAP benefits (called PAN in Puerto Rico),
                                  which require payment systems to be working

Copyright © 2019 CNA. All rights reserved
                                                                                                                   |   10
Largest food mission in US history
Where did it go?
• Responding to a request
(for >346M meals!) that
assumed total failure of
supply chains
• Long distance transport
from mainland delays
distribution
What do you observe about
distribution of food aid relative
to storm path?
Copyright © 2019 CNA. All rights reserved
| 11…but was aid sent to areas of greatest need?
Food deserts with dense population concentrated in peri-urban areas on eastern side of island
and near western coastal cities. Important areas for emergency food aid?
Indicators: Nodes, Pop. Vulnerability. Data Source: Dun & Bradstreet, FEMA . Vintage: 2018
Copyright © 2019 CNA. All rights reserved
| 12Was it enough to make a difference? A matter of scale
Irma/Maria - Monthly Retail Food Sales in Puerto Rico • Private sector actually displayed surprising
resilience
$600 Gov. Dev. Bank of PR Economic Development Bank for Puerto Rico • Food sales increased after landfall
$500 • Most retail locations receiving shipments in
3-7 days
$400 • Lack of power, payment systems hindered
but did not stop commodity flow or sales
Million $
$300
$200
$100
All FEMA food released to territory
$0
Jul-17 Aug-17 Sep-17 Oct-17 Nov-17 Dec-17 Jan-18 Feb-18 Mar-18
Maria Landfall
(The private sector is the “Big Wheel” here.) (It kept on turning, despite challenges.)
Copyright © 2019 CNA. All rights reserved
| 13Find concentrations of activity…and avoid disrupting them
Significant
concentration of
food distribution
centers near
Bayamon.
Heavily
dependent on
Port of San
Juan for
inbound
shipments.
Relief supplies
added to
bottleneck in
this area.
Copyright © 2019 CNA. All rights reserved
| 14Food in Puerto Rico
• Lessons learned –
• Monitor the system – Expected total collapse; Food was actually moving
soon after landfall, but few knew about it
• Learn dependencies – Criticality of PAN card (i.e., SNAP) processing
• Understand where and where not to assist – Bottlenecks at Port of San
Juan, competition for logistics capacity (containers, trucking), little aid to
most vulnerable areas
• How does this knowledge affect your thinking about your “white whale”
scenario?
Copyright © 2019 CNA. All rights reserved
| 15III. Puget Sound Grocery
• Cascadia Subduction Zone earthquake could cut off access to Puget Sound
by road and rail
• Greater Seattle further from alternate sources of supply of sufficient scale
than any other CONUS metro area
• In understanding how to feed survivors after a black sky event; any surviving
capacity to move food is potentially important
Copyright © 2019 CNA. All rights reserved
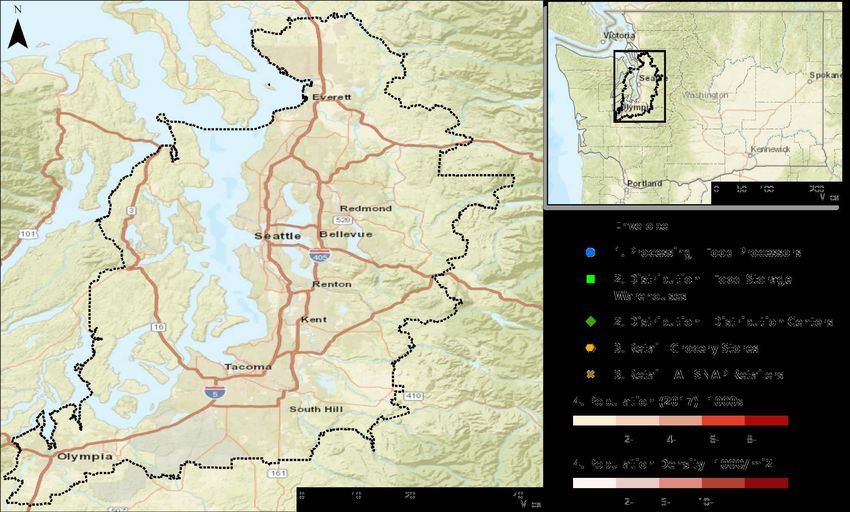
| 16Basic mapping is intriguing but not sufficient
Hazards
Liquefaction Susceptibility Select
Earthquake Scenarios
Shaking Intensity (MMI)
Select 4 5 6 7 8 9
Select Cascadia 9.0
Select Tacoma 7.1
Select Nisqually 7.2
Select
Select
Wait – Are we
jumping to
conclusions before
Select
we really understand
the system?
Copyright © 2019 CNA. All rights reserved
| 17The right datasets are important to building the picture
Example:
The HIFLD Public
Refrigerated
Warehouses data set
is much less robust
than the state level
data.
Data Sources:
WA State Department of
Agriculture, Food Storage
Warehouse Permits (2018)
HIFLD, Public Refrigerated
Warehouses (2018)
Copyright © 2019 CNA. All rights reserved
| 18Improving the picture - Categorization by Type, Size
Processing data to add
quantitative and qualitative
attributes helps build a
more informed picture.
Wherever possible, key
metrics for facilities should
focus on
1) commodity flow and
storage,
2) Flow capacity or storage
capacity
3) failing that, other
metrics of size.
Data Source:
WA State Department of
Agriculture, Food Processor
Licenses (2018)
Copyright © 2019 CNA. All rights reserved
| 19Analysis using capacity becomes actionable
Finding:
Top 5, 10 and 20 tracts
have 46, 71 and 86 % of
total storage by area in the
envelope.
Top 5 tracts have 111 of
368 warehouses in the
envelope (746 statewide).
Top tract has 46.
Data Sources:
WA State Department
of Agriculture, Food
Top Tract: 13.6 M sf Storage Warehouse
Top 5 total: 34.1 M sf Permits (2018)
In Envelope: 72.6 M sf Microsoft Building
Footprints layer (2018)
Copyright © 2019 CNA. All rights reserved
| 20Flow mapping brings together data and insight Top 5 brands
(90% market share)
Brand A
Brand B
Brand C
Brand D
Brand E
Market share served (%) Freight route truck traffic Select
1000 5000 10000 Getting this picture
Ann. Avg. daily trucks
0.2 1 2 10 20 30 requires data but also
Market Share flow (%)
Select validation from private
Primary Distribution Center passing through tract
Aux./Other Distribution Center NoneFlow mapping brings together data and insight Top 5 brands
(90% market share)
Brand A
Brand B
Brand C
Brand D
Brand E
Market share served (%) Freight route truck traffic Select
1000 5000 10000 Getting this picture
Ann. Avg. daily trucks
0.2 1 2 10 20 30 requires data but also
Market Share flow (%)
Select validation from private
Primary Distribution Center passing through tract
Aux./Other Distribution Center NoneGrocery in Puget Sound -
• Lessons learned:
• Engage private sector – Validate assumptions and validate the final picture
• Get the right data, make it usable
• Characterize the network: focus on 1) flow, 2) capacity, 3) all other
measures of size
• What is happening: process of validating and understanding regional picture
has reset public-private relationship
• How would this level of understanding of food flows influence your
preparedness and planning?
Copyright © 2019 CNA. All rights reserved
| 23Putting insights into practice:
Where do we go from here?
Copyright © 2019 CNA. All rights reserved
| 24Key lessons and observations
• Private sector supply chains and public sector relief supplies are separate flows; private
sector orders of magnitude larger
• No one has a complete picture of lifeline commodity movement, but the process of trying to
create a more complete one benefits many stakeholders
• Significant opportunity exists for the public sector to help facilitate the resilience of private
sector supply chains during disasters (or at least avoid doing harm), providing better
outcomes for survivors and reducing the demand for public sector relief supplies
• Focus on commodity flow, but failing that, capacity, and failing that, other measures of size
or scale
• Find the most complete, timely, and commodity-flow relevant data sources
• Engage the private sector to validate understanding of supply chain networks and build
partnerships to enhance network resilience before and during disasters
Copyright © 2019 CNA. All rights reserved
| 25CNA Supply chain operational engagement (CNA SCOPE™) method
STEP 1: DEFINE NETWORK SCOPE BY COMMODITY,
GEOGRAPHY
• CNA SCOPE™ method focuses on…
STEP 2: ACQUIRE AND PROCESS DATA TO BUILD • Commodity flow above all else
• Whole ecosystem rather than individual entities’
NETWORK CHARACTERIZATION
STEP 3: DEVELOP MAPS OF COMMODITY FLOW supply chains
• Supporting survivors in large urban areas
STEP 4: ASSESS NETWORK FOR CONCENTRATIONS, • First 4 steps are blue-sky tasks, and can be
VULNERABILITIES completed prior to an event. (Steps 2-4 are
difficult to do in just a few days before an
STEP 5: INJECT IMPACTS OF EXTREME EVENT, ASSESS
NETWORK FUNCTION AND CONSEQUENCES
event.)
• Step 5 is where disaster starts (either in
STEP 6: RANK BOTTLENECKS BY CONSEQUENCE AND reality or exercise)
• Step 6 and 7 is where Fed/State/Local,
IDENTIFY OPTIONS TO EXPLOIT SURVIVING CAPACITY
Private, VOAD, and Academic partners work
STEP 7: ANALYZE TOP BOTTLENECKS, TAKE ACTION TO
AMELIORATE, REPEAT together to make decisions to enhance
commodity flow to survivors.
Copyright © 2019 CNA. All rights reserved
| 26Getting started...
• Carefully select your region of interest, and your commodity
• Understand the supply chain for your selected commodity
• Find the right data sources to describe the whole ecosystem
• Focus on the large, proportional flows of commodities, and where possible,
deemphasize business sensitive metrics
• Engage the relevant supply chain operators to help answer questions about
network characterization, and to validate the overall picture
• Perform analysis on key portions of the supply chain to understand important
concentrations/bottlenecks
• Work to improve network characterization over time, and put it to use for
exercises and planning
Copyright © 2019 CNA. All rights reserved
| 27Closing thoughts
and discussion
Copyright © 2019 CNA. All rights reserved
| 28Acknowledgements
• DHS CISA NRMC, Region X • Supply Chain Analysis Network
• National Institute for • Philip J. Palin
Hometown Security • MIT Center for Transportation
Logistics
• FEMA NIC
• American Logistics Aid Network
• FEMA LMD • CNA
• National Academies of • Dewberry
Science, Engineering, and • State, regional, local
Medicine governments/agencies
• Southeast Pennsylvania • Private sector representatives
Regional Task Force
Copyright © 2019 CNA. All rights reserved
| 29You can also read