Biochar on Pukekohe market gardens
←
→
Page content transcription
If your browser does not render page correctly, please read the page content below
Monitoring Research Quarterly
July 2012 volume 5 issue 2
Monitoring Research Quarterly, MRQ is the newsletter of the Auckland Council’s Research, Investigations and
Monitoring Unit, RIMU. Each edition of the newsletter contains reports of RIMU’s current work including information
about recent publications, research, facts and trends about Auckland. RIMU publications are available on the
Auckland Council and Knowledge Auckland websites.
Biochar on Pukekohe market gardens
Pukekohe produces about a third of New Zealand’s vegetables on a total
vegetable production area of 8000 ha. Some fields have been continuously
growing vegetables for more than 100 years, often with more than one
crop each year. Over time, soils have become carbon depleted because of
the intensive market gardening operations. To address this issue, Dr Fiona
Curran Cournane, working with University of Auckland, Lincoln University
and AgResearch scientists is investigating the application of biochar as a soil
amendment in these carbon depleted soils.
Biochar, a charcoal like product, is made by Biochar New Zealand Ltd from
pine chips heated to 350-400°C without oxygen, a process known as pyrolysis.
The research trial, 40 plots on a 700m2 plot area in Pukekohe, will be conducted
over the next 2-3 years to determine if biochar can boost the carbon content
of the soil and improve soil quality. Bags of biochar
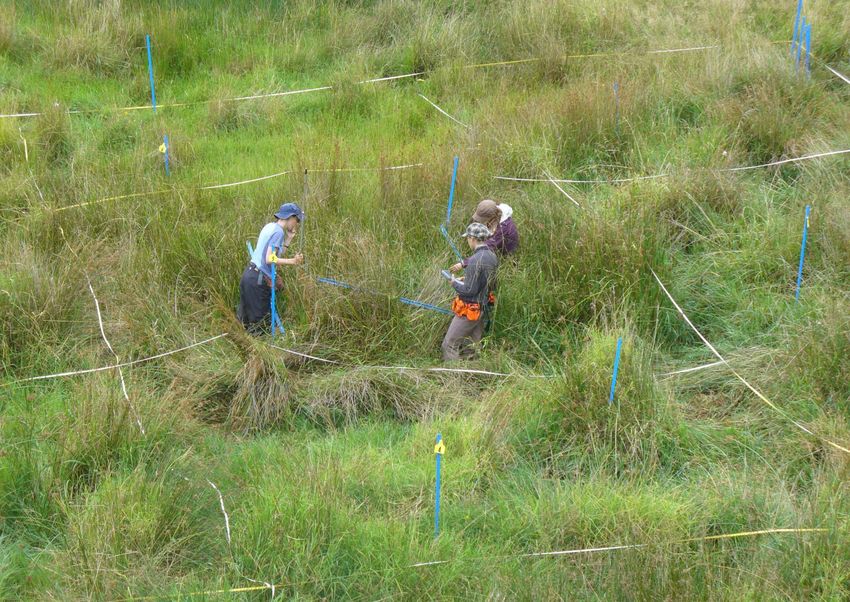
Monitoring terrestrial biodiversity
RIMU scientists monitor the current state and changes in indigenous biodiversity values for Auckland’s urban, rural and
forested landscapes.
The freshwater wetland programme, February to March and the forest and shrubland programme, November to December,
collect data from a region wide network of 400 forest and 220 wetland plots. Scientists are currently collecting baseline data
and plan to revisit the plots every five years to monitor change.
For each wetland or forest plot, detailed measures are collected including:
• species diversity
• abundance and regeneration of plants (including weed species)
• bird counts
• identifying pests present
• physical data (for example, information about geographical features)
• soil and foliage samples
• assessing the ecosystem condition and threats in the surrounding area.
This data is used to:
• report on the current state of the region’s biodiversity in the Auckland Council State of Auckland report cards
• report on how weeds and pests affect the distribution of native plants and animals
• provide baseline data for policy tools (for example, biodiversity offsets)
• quantify biodiversity gains in managed ecological areas such as Ark in the Park, Tawharanui and the Hunua Ranges
Kokako Management Area
• assist external researchers.
1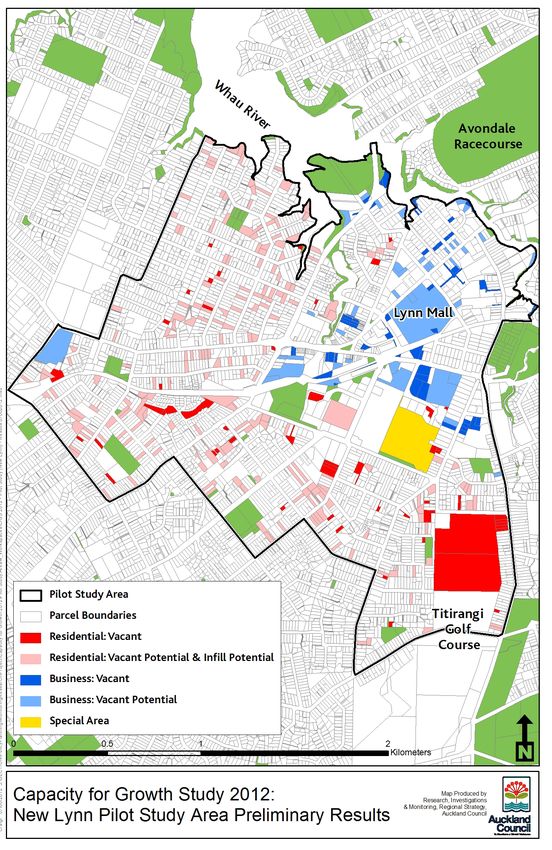
Although scientists are only half way through the baseline measures, a sneak peek at the bird data reveals how important
some of Auckland’s ecological areas are as indigenous species reserves – they are ecological gems. This is apparent when
looking at bird species richness from plots in urban areas – over 14 different birds, compared with birds on Little Barrier Island
– over 17 different birds, as shown in the charts below.

Valuing the Hauraki Gulf
Work estimating the impact of the amenity of the Hauraki Gulf on land prices has recently been completed by RIMU economists.
The researchers included the hedonic price method (HPM), a method that separates the environmental value (in this case, access
to the beach) from observed prices (land prices). The real estate market was selected as it is a commonly used surrogate in hedonic
pricing of environmental values.
The HPM was applied to 12 census area units on the North Shore (rates information from 8587 properties). The study used land
price per square metre derived from the Auckland Council July 2011 land valuations, as the dependent variable. Land value was
the independent variable. Using land value per square metre as the dependent variable streamlines the HPM. Furthermore, using
the land price rather than market price ensures consistency as the land prices are calculated on the same date and the model does
not have the bias of different selling dates. The study also considers the distance by road, to the nearest designated beach rather
than linear distance to the coastline.
Hedonic estimation results for the study area align with previous Auckland studies, which show the significant impact of water
amenity on land price. This impact increases with the scope of views (highest impact from “wide views” to lowest impact from
“slight views”) and decreases with the access distance to the beach.
The results show that land with a wide water view valued at $1000 per square metre located on the coastline, would cost per
square metre, keeping other characteristics constant:
$680, if located 100 metres from the beach
$520, if located 500 metres from the beach
$460, if located 1000 metres from the beach
$410, if located 2000 metres from the beach.
The land price of a property with a moderate view would cost on average 20 percent less if located at the coastline, 41 percent less
if located 100 metres from the coastline and 65 percent less if located two kilometres from the coastline compared to a similar
property with a wide view at the same location.
The full results of the study are published in RIMU’s working paper, Impact of Hauraki Gulf Amenity on the Land Price of
Neighbourhood Properties. An Empirical Hedonic Pricing Method Case Study North Shore, Auckland. Auckland Council Working
Paper, 2012/001

                                                                                                                                       2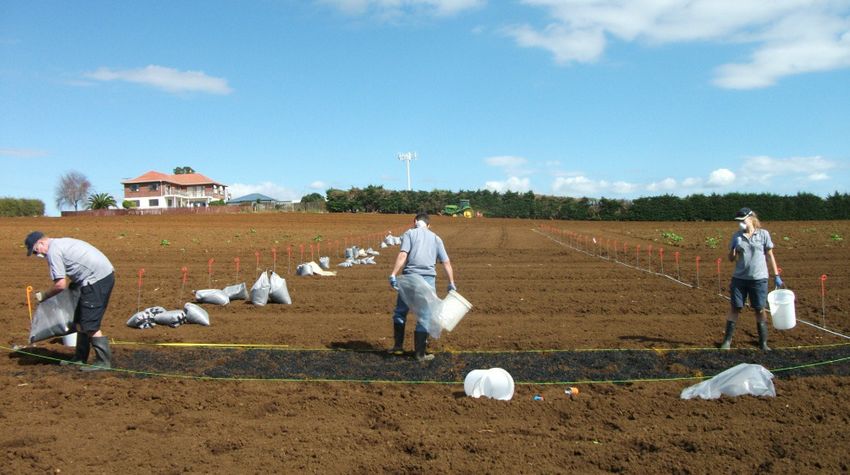
Aucklanders 50 and over                                                     The women in the sample exhibited a greater sense of contentedness
                                                                            than men in their later years. Despite being much more likely to
Although Auckland is a relatively young city compared with the rest         be widowed, divorced, separated or otherwise unpartnered than
of New Zealand, the overall population of the region is ageing slower       men, women had lower rates of loneliness and higher levels of life
than other centres. As Professor Natalie Jackson from the University        satisfaction than men did. One explanation for women’s resilience
of Waikato explains, “It is ageing numerically, as more people survive      is that being unpartnered means they reach out beyond immediate
to older ages, and structurally, as lower birth rates deliver relatively    family to build links in the broader community.
fewer babies and children. It is also ageing structurally as previous
youthful migrants grow older. Together these dynamics cause the             Although Maori participants reported high levels of happiness, life
proportions at younger ages to decrease, and the increased numbers          satisfaction and quality of life, their physical health is below that
at older ages to also become increased proportions.” 1                      of non-Maori. Maori were significantly more likely to have lower
                                                                            household incomes, higher housing costs and higher rates of income
Recognising the significance of this demographic shift, RIMU                poverty but their anticipated finances in retirement, assets and the
commissioned Aucklanders 50 and Over: a Health, Social, Economic            capital value of their dwellings were not significantly different from
and Demographic Summary Analysis of the Life Experiences of Older           others in the sample.
Aucklanders by Charles Waldergrave, Peter King and Elizabeth Rowe.
This research report provides insight into the well-being and quality       Low numbers of Pacific and Asian respondents means that the results
of life of Auckland residents aged between 50 and 84 years old. The         are indicative of trends and issues for these groups. Nonetheless,
authors analysed data from 707 Auckland residents who were part             the results for Pacific peoples are worrying. They have extremely
of the first group in the New Zealand Longitudinal Study of Ageing          high rates of poverty and hardship, more financial dependents,
(NZLSA).                                                                    much lower living standards and significantly fewer educational and
                                                                            material resources. They are much more likely to be renting and
The NZLSA’s main research questions concern the impact of a                 have few assets.
number of psychosocial and demographic factors on the well-
being and quality of life of people as they age. For those still in         The most marked difference between Asian peoples and the rest
employment, the survey asks questions about their work life and for         of the sample were their high level of educational qualifications,
those in retirement, the survey asks about their adjustment to this         even among this older population; high likelihood of living with
stage of their lives. The survey also included questions about:             their children and lack of reliance on (or access to) superannuation.
•   demographics                                                            Happiness and life satisfaction, self-rated health and living standards
                                                                            were all high.
•   general health
•   social support                                                          The authors of the report conclude that the majority of the study’s
•   giving or receiving care                                                participants are satisfied with their lives, health and living standards,
                                                                            and engaged with their families and communities. They note,
•   work or retirement status
                                                                            however, that there is a more challenging side to this story:
•   financial well-being
•   the characteristics of participants’ neighbourhood.                           The older people in this sample are increasingly facing a future
                                                                                  with less housing and income security. Many worry about their
The research shows that older Aucklanders are making significant                  personal security; over half of the sample is lonely and depression
contributions to their families and communities. Around 40 per cent               is present for a significant minority; too many experience
care for someone with a long-term illness, disability or frailty and              everyday discrimination because of their age, and a smaller
nearly a quarter care for someone else’s child. Most respondents are              proportion cannot visit shops, services and friends as freely as
in paid work: 38.3 per cent in full time work and 17.7 per cent in                they would like.
part time work. Nearly 19 per cent of those aged 65 to 74 remain in
full time paid employment and nearly 16 per cent in part time paid          The full report and an executive summary are available on
work.                                                                       Knowledge Auckland or from Dr Carina Meares from RIMU’s Social
                                                                            and Economic Research team.
Chart: Auckland demographic projections to 2031
                                                                            1. Jackson, N 2012. Auckland Region Socio-Demographic Profile
(Statistics New Zealand population projections)                             1986-2031

100%

  90%

  80%

  70%

  60%                                                                                                     65+ years

  50%                                                                                                     40–64 years
                                                                                                          15–39 years
  40%
                                                                                                          0–14 years
  30%

  20%

  10%

   0%
                                                                                                                                                    3
             2006           2011           2016           2021             2026           2031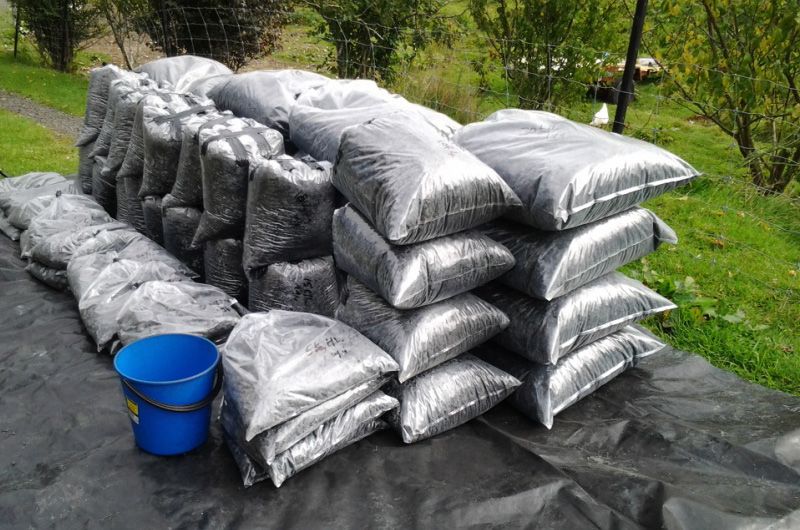
Capacity for growth 2012
The Land Use Research Team has begun the 2012 Capacity for Growth Study.
The study uses existing geo-spatial information and district planning rules
to determine the amount of permitted development capacity available for
all land parcels and titles in the region. The methodology was developed using
FME computer tools (software for manipulating spatial data) and a pilot study
was recently completed for an area surrounding the New Lynn metro centre.
The study results will indicate whether current capacity is adequate to
accommodate anticipated population growth by comparing development rates
with capacity outputs. The study includes a number of variables that allow test-
ing of different capacity yields (for example changing access widths or lot sizes),
and that will be useful in testing new zones in plan changes and the Unitary Plan.
The map below identifies areas of residential and business capacity in New Lynn.      For more information about Auckland
                                                                                      related research, data and monitoring
                                                                                      programmes visit the Research Unit’s
Map: Residential and busines capacity in New Lynn, pilot study area.                  websites, Knowledge Auckland,
Capacity for Growth Study, June 2012                                                  www.knowledgeauckland.org.nz
                                                                                      and Monitor Auckland http://
                                                                                      monitorauckland.arc.govt.nz

                                                                                      Research, Investigations and Monitoring
                                                                                      Manager
                                                                                      Grant Barnes
                                                                                      09 484 6234
                                                                                      grant.barnes@aucklandcouncil.govt.nz

                                                                                      Environmental Monitoring
                                                                                      Team Leader
                                                                                      Phil White
                                                                                      09 365 3077
                                                                                      phil.white@aucklandcouncil.govt.nz

                                                                                      Environmental Science
                                                                                      Team Leader
                                                                                      Greg Holland
                                                                                      09 484 6242
                                                                                      greg.holland@aucklandcouncil.govt.nz

                                                                                      Land Use, Built Environment and
                                                                                      Infrastructure Research
                                                                                      Team Leader
                                                                                      Regan Solomon
                                                                                      09 484 6248
                                                                                      regan.solomon@aucklandcouncil.govt.nz

                                                                                      Social and Economic Research
                                                                                      Team Leader
                                                                                      Eva McLaren
                                                                                      09 484 6244
                                                                                      eva.mclaren@aucklandcouncil.govt.nz

                                                                                      Auckland Council
                                                                                      1 Greys Avenue, Private Bag 92300,
                                                                                      Auckland 1142, New Zealand
                                                                                      Phone +64 9 301 0101
                                                                                      RIMU at level 4, 1 The Strand, Takapuna
                                                                                      www.aucklandcouncil.govt.nz
                                                                                      Copyright
                                                                                      Information in this newsletter may be freely used,
                                                                                      reproduced, or quoted unless otherwise specified.
                                                                                      In all cases, the Auckland Council must be acknowledged
                                                                                      as the source.

                                                                                      Liability
                                                                                      While care has been used in processing, analysing and
                                                                                      extracting information, Auckland Council gives no warranty
                                                                                      that the information supplied is free from error. Auckland
                                                                                      Council shall not be liable for any loss suffered through the
                                                                                      use, directly or indirectly, of any information, product or
                                                                                      service.
                                                                                      ISSN 2230-3693 (Print) | ISSN 2230-3707 (Online)

                                                                                                                                                      4
You can also read