Blood Pressure Lowering Decreases Intracerebral Hemorrhage Volume and Improves Behavioral Outcomes in Experimental Animals
←
→
Page content transcription
If your browser does not render page correctly, please read the page content below
Journal of Stroke 2020;22(3):416-418
                                                                                                                                       https://doi.org/10.5853/jos.2020.02390

                                                                                                                                                Letter to the Editor

Blood Pressure Lowering Decreases Intracerebral
Hemorrhage Volume and Improves Behavioral
Outcomes in Experimental Animals
Ferdinand O. Bohmann,a,b Alexander Seiler,a Sarah Gelhard,a Leonie Stolz,a Boris Brill,c
Robert Brunkhorst,a Helmuth Steinmetz,a Patrick N. Harter,b Michel Mittelbronn,b,d,e,f,g
Christian Foercha
a
  Department of Neurology, Goethe University, Frankfurt am Main, Germany
b
  Institute of Neurology (Edinger-Institute), Goethe University, Frankfurt am Main, Germany
c
  Georg-Speyer-Haus, Institute for Tumor Biology and Experimental Therapy, Frankfurt am Main, Germany
d
  Luxembourg Centre of Neuropathology (LCNP), Luxembourg City, Luxembourg
e
  NORLUX Neuro-Oncology Laboratory, Department of Oncology, Luxembourg Institute of Health (LIH), Strassen, Luxembourg
f
 Luxembourg Centre for Systems Biomedicine (LCSB), University of Luxembourg, Esch-sur-Alzette, Luxembourg
g
  Department of Pathology, Laboratoire National de Santé (LNS), Dudelange, Luxembourg

Dear Sir:                                                                                   by nifedipine orally to 126.0±8.8 mm Hg systolic) and a control
                                                                                            group (saline orally; 186.0±9.8 mm Hg systolic) (Supplementa-
Arterial blood pressure is often elevated in the acute phase of                             ry Figure 1). Hematoma volume as the primary endpoint was
intracerebral hemorrhage (ICH). It is a predictor of a poor prog-                           quantified photometrically 24 hours after ICH induction (end
nosis.1 The Intensive Blood Pressure Reduction in Acute Cere-                               of main hematoma expansion phase). Neurological deficits
bral Hemorrhage Trial II (INTERACT II) study revealed a strong                              were evaluated before sacrifice by a blinded rater using the
tendency towards improved outcomes in ICH patients subject-                                 modified Neurological Severity Score (mNSS). Additional histo-
ed to intensive blood pressure lowering,1 while the Antihyper-                              pathological analysis evaluated edema formation and blood
tensive Treatment of Acute Cerebral Hemorrhage Trial II                                     brain barrier dysfunction at 24 and 72 hours after ICH induc-
(ATACH II) trial reported worse outcomes.2 So far, the patho-                               tion (Supplementary Table 1). Ordinal histoscores were calcu-
physiologic consequences of intensive blood pressure lowering                               lated using a semi-quantitative assessment (Supplementary
in acute ICH are scarcely understood. Here we describe an ex-                               methods 1).
perimental model with translational reference to the INTERACT                                  Intensive blood pressure lowering reduced hematoma vol-
II and ATACH II trials. Our study allows for rapid blood pressure                           ume 24 hours after ICH induction (nifedipine group 88.6±36.6
lowering 30 minutes after ICH induction in rats. We aimed at                                μL vs. control group 146.3±58.7 μL, P=0.023, n=9) (Figure 1A).
assessing hematoma volume and functional outcome and                                        This implicated a decrease in hematoma growth within the
evaluated histological and magnetic resonance imaging (MRI)                                 first 24 hours by nifedipine. Neurological deficits were signifi-
parameters, including edema formation and blood-brain barrier                               cantly reduced 24 hours after ICH induction in the interven-
dysfunction.                                                                                tional group as compared to controls (median, 7 [interquartile
   For this study 84 spontaneously hypertensive rats (SHR) were                             range, IQR, 5.5 to 11] vs. 13 [IQR, 9.5 to 18]; P=0.011, n=9)
used. A detailed methodical description can be found in Sup-                                (Figure 1B).
plementary methods. In brief, striatal ICH was induced by ste-                                 Histopathological analyses revealed no differences in edema
reotactic collagenase injection.3,4 SHR were then randomized                                formation at 24 hours (histoscore: nifedipine median, 2 [IQR, 2
into an interventional group (intensive blood pressure lowering                             to 3] vs. control 3 [IQR, 2 to 3]; P=0.99, n=5) and 72 hours

Copyright © 2020 Korean Stroke Society
This is an Open Access article distributed under the terms of the Creative Commons Attribution Non-Commercial License (http://creativecommons.org/licenses/by-nc/4.0/) which
permits unrestricted non-commercial use, distribution, and reproduction in any medium, provided the original work is properly cited.

416      http://j-stroke.org                                                                                                           pISSN: 2287-6391 • eISSN: 2287-6405
Vol. 22 / No. 3 / September 2020

                                                                                                                 18
                                                                                                                 16
                         200

                                                                                   Neurological deficit (mNSS)
                                                                                                                 14
     Blood volume (µL)

                                                                                                                 12
                         150
                                                                                                                 10

                         100                                                                                     8
                                                                                                                 6

                         50                                                                                      4
                                                                                                                 2

                          0                                                                                      0
                               Control               Nifedipine              A                                        Control      Nifedipine                B

Figure 1. (A) Hematoma volume (µL) 24 hours after intracerebral hemorrhage (ICH) induction in rats subjected to intensive blood pressure lowering (nifedip-
ine) versus controls (P=0.02, n=9). Individual data points and mean values are given. (B) Neurological deficits 24 hours after ICH induction in rats subjected to
intensive blood pressure lowering (nifedipine) versus controls (P=0.01). Individual data points and median values are given. mNSS, modified Neurological Se-
verity Score.

(nifedipine median, 1 [IQR, 0.5 to 2] vs. control 1 [IQR, 0.5 to                        mal data in contrast affirms that blood pressure reduction
2], P=0.99, n=5) (Supplementary Figures 2 and 3). Concerning                            translates into a better functional outcome. In fact, in the
the extent of blood–brain barrier disruption the size of the ar-                        ATACH II trial more complications occurred in the intensively
eas showing positive immunoglobulin G staining did not differ                           treated group such as increased frequency of kidney failure.1,2
between groups at 24 hours (histoscore: nifedipine median, 3                            However, our model was not designed to capture systemic
[IQR, 3 to 4] vs. control 3 [IQR 2 to 4], P=0.99, n=5) and 72                           complications of intensive blood pressure lowering.
hours (nifedipine, 3 [IQR, 2 to 3] vs. control 2 [IQR, 1.5 to 3],                          We did not observe differences in other pathophysiological
P=0.68, n=5) (Supplementary Figures 2 and 3). An additional                             cascades that take place in the perilesional tissue after ICH
descriptive MRI of post-mortem rat brains confirmed findings                            formation (especially edema formation and blood brain barrier
(Supplementary Figure 4).                                                               disruption). It appears that the most critical mediator of the
   Our experimental data suggest that intensive blood pressure                          therapeutic effect of intensive blood pressure lowering is the
lowering in the acute phase of ICH reduces hematoma volume                              reduction in hematoma volume. However, our model can be
and improves functional neurological deficits. We did not find                          applied to future studies evaluating the pathophysiology of
a significant effect of the treatment on edema formation and                            blood pressure lowering in acute ICH in more detail.
blood-brain barrier dysfunction up to 72 hours after ICH induc-                            Limitations include missing longitudinal outcome data to
tion.                                                                                   prove long-term therapeutic effects (in line with 90 days out-
   From a translational perspective, the rapid drop of blood                            come of the randomized trials) of the intervention. Further-
pressure after nifedipine administration was well comparable                            more, we may have overestimated the therapeutic effect size
to what has been achieved in clinical trials (although different                        of the intervention because the control group was untreated,
in its absolute size).1,2 We consider it unlikely that nifedipine                       thus having higher blood pressure values than the control
has other effects on hematoma volume and functional out-                                groups of the pivotal clinical trials.1,2
come than what is mediated via blood pressure. Moreover, cal-                              In conclusion, blood pressure lowering with nifedipine de-
cium channel blockers were also used in the pivotal clinical tri-                       creases ICH volume and improves behavioral outcomes in SHR.
als.1,2 In experimental ICH, bleeding begins around 10 minutes                          Our findings may help to refine future clinical studies on blood
after collagenase injection. Thus, our model well covers blood                          pressure reduction in ICH patients.
pressure lowering during the phase of hematoma expansion.3-5
   The effect of rapid blood pressure lowering on functional                            Supplementary materials
outcome after ICH is not consistent between clinical and
translational studies. On the clinical side, INTERACT II reported                       Supplementary materials related to this article can be found
a strong trend towards a benefit of the intervention whereas                            online at https://doi.org/10.5853/jos.2020.02390.
ATACH II reported neutral or even worse outcomes.1,2 The ani-

https://doi.org/10.5853/jos.2020.02390                                                                                                http://j-stroke.org   417
Bohmann et al. Blood Pressure Lowering after ICH
References M, et al. Hemostatic therapy in experimental intracerebral
hemorrhage associated with the direct thrombin inhibitor
1. Anderson CS, Heeley E, Huang Y, Wang J, Stapf C, Delcourt C, dabigatran. Stroke 2011;42:3594-3599.
et al. Rapid blood-pressure lowering in patients with acute
intracerebral hemorrhage. N Engl J Med 2013;368:2355-
2365. Correspondence: Ferdinand O. Bohmann
Department of Neurology, Goethe University, Schleusenweg 2-16, 60528
2. Qureshi AI, Palesch YY, Barsan WG, Hanley DF, Hsu CY, Martin Frankfurt am Main, Germany
RL, et al. Intensive blood-pressure lowering in patients with Tel: +49-69-6301-4406
Fax: +49-69-6301-7084
acute cerebral hemorrhage. N Engl J Med 2016;375:1033- E-mail: ferdinand.bohmann@kgu.de
1043. https://orcid.org/0000-0001-6439-0667
3. Rosenberg GA, Mun-Bryce S, Wesley M, Kornfeld M. Collage- Received: June 17, 2020
nase-induced intracerebral hemorrhage in rats. Stroke 1990; Revised: August 19, 2020
Accepted: August 21, 2020
21:801-807.
4. Foerch C, Arai K, Jin G, Park KP, Pallast S, van Leyen K, et al. Michel Mittelbronn would like to thank the Luxembourg National Research Fond
(FNR) for the support (FNR PEARL P16/BM/11192868 grant). This study was
Experimental model of warfarin-associated intracerebral supported in part by a grant from the Goethe University Hospital Frankfurt.
hemorrhage. Stroke 2008;39:3397-3404.
The authors have no financial conflicts of interest.
5. hou W, Schwarting S, Illanes S, Liesz A, Middelhoff M, Zorn
418 http://j-stroke.org https://doi.org/10.5853/jos.2020.02390Vol. 22 / No. 3 / September 2020
Supplementary Table 1. Study design and animals per experimental group
24 hr after ICH induction 72 hr after ICH induction
Photometric hematoma quantification and 9 SHR per group (n=18) (primary endpoint) —
functional outcome (mNSS)
Histopathological analysis 5 SHR per group (n=10) 5 SHR per group (n=10)
- HE staining
- Immunohistochemical analysis
Explorative post-mortem MRI acquisition 3 SHR per group (n=6) 3 SHR per group (n=6)
Blood pressure evaluation was done separately in 8 SHR in total.
ICH, intracerebral hemorrhage; mNSS, modified Neurological Severity Score; SHR, spontaneously hypertensive rats; HE, hematoxylin eosin; MRI, magnetic res-
onance imaging.
https://doi.org/10.5853/jos.2020.02390 http://j-stroke.org 1Bohmann et al. Blood Pressure Lowering after ICH
220
210
Systolic blood pressure (mm Hg)
Systolic blood pressure (mm Hg)
200
190 180
180 160
170 140
160 120
100
0 A 0 B
9 10 12 13 Pre-OP 1st-10th min 20th-30th min 10 min post-OP
Week Time
Systolic blood pressure (mm Hg)
Systolic blood pressure (mm Hg)
180 180
160 160
140 140
120 120
100 100
0 C 0 D
Pre 0.5 1 2 4 24 48 72 Pre 0.5 1 2 4 24 48 72
Time (hr) Time (hr)
Supplementary Figure 1. Blood pressure evaluation (tail-cuff method). (A) Systolic blood pressure values (mm Hg) of spontaneously hypertensive rats strati-
fied according to age (weeks). In addition to individual data points, mean values are given (black lines). Intracerebral hemorrhage experiments were performed
with rats aged 10 weeks (blue symbols). (B) Perioperative systolic blood pressure values. Systolic blood pressure values (mm Hg) before (pre-operative, red
symbols), during (1st–10th minute, 20th–30th minute, blue symbols) and after (post-operative, blue symbols) isoflurane anesthesia. In addition to individual
data points, mean values are given (black lines). (C) Blood pressure lowering with nifedipine orally over 72 hours (intervention). Systolic blood pressure values
(mm Hg) before (red symbols) and during the application of nifedipine (15 mg/kg body weight, blue symbols) via a nasogastric tube (every 8 hours during the
first 24 hours, every 12 hours thereafter). In addition to individual data points, mean values are given (black lines). (D) Blood pressure levels during placebo ap-
plication orally over 72 hours (control group). Systolic blood pressure values (mm Hg) before (red symbols) and during the application of saline as placebo via
a nasogastric tube (every 8 hours during the first 24 hours, every 12 hours thereafter). Treatment and application volume were equal to nifedipine-treated
rats. In addition to individual data points, mean values are given (black lines).
Nifedipine Control
HE
Supplementary Figure 2. Representative hematoxylin eosin (HE) and anti-
rat-immunoglobulin G (IgG) staining sections for the intensive blood pres-
sure lowering vs. control group. Representative HE and anti-rat-IgG stain-
ing sections for the intensive blood pressure lowering group (nifedipine, left
side) and the control group (right side). No differences were found for ede-
ma formation (determined on HE sections) and for blood brain barrier dys-
function (as determined by anti-rat IgG immunohistochemical stainings)
between the groups. Whole brain sections are depicted at original magnifi-
cation 10 (bars=200 µm) and smaller images with magnification 2 in the
IgG upper left corner for orientation.
2 http://j-stroke.org https://doi.org/10.5853/jos.2020.02390Vol. 22 / No. 3 / September 2020
4 Histoscore HE 24 hr Histoscore HE 72 hr
4
Histoscore 3 3
Histoscore
2 2
1 1
0 0 A
Control Nifedipine Control Nifedipine
Histoscore IgG 24 hr Histoscore IgG 72 hr
4 4
3 3
Histoscore
Histoscore
2 2
1 1
0 0
B
Control Nifedipine Control Nifedipine
Supplementary Figure 3. Histopathological analysis using a semiquantitative histoscore. Ordinal histoscores were calculated using a semi-quantit ative as-
sessment for edema formation (hematoxylin eosin [HE] staining, brain edema reflected by vacuolated tissue around the hemorrhage compatible with vaso-
genic brain edema: 0=isolated hemorrhage without vacuolated tissue, reflecting brain edema; 1=edema minimal, means partial vacuolated tissue around
hemorrhage, no consecutive midline shift; 2=edema minimal to medium with vacuolated tissue involving cortex, no consecutive midline shift; 3=edema me-
dium to strong with consecutive midline shift; 4=strong edema bilateral, midline shift) and blood brain barrier dysfunction (immunoglobulin G [IgG] staining,
intraparenchymatous deposits of IgG as indirect marker of blood brain barrier dysfunction: 0=isolated hemorrhage, extravasation absent; 1=extravasation and
blood-brain-barrier breakdown minimal; 2=extravasation minimal to medium; 3=extravasation medium to strong; 4=extravasation strong and bilateral). Six
slides per brain prepared from needle entry site ±1 mm were analyzed. The slides were evaluated in blinded random order with a standard light microscopy. (A)
No differences in edema formation at 24 hours (P=0.99, n=5) and 72 hours (P=0.99, n=5). (B) Concerning the extent of blood-brain barrier disruption the size
of the areas showing positive IgG staining did not differ between groups at 24 hours (P=0.99, n=5) and 72 hours (P=0.68, n=5). Median scores and scatter dot
plot are presented.
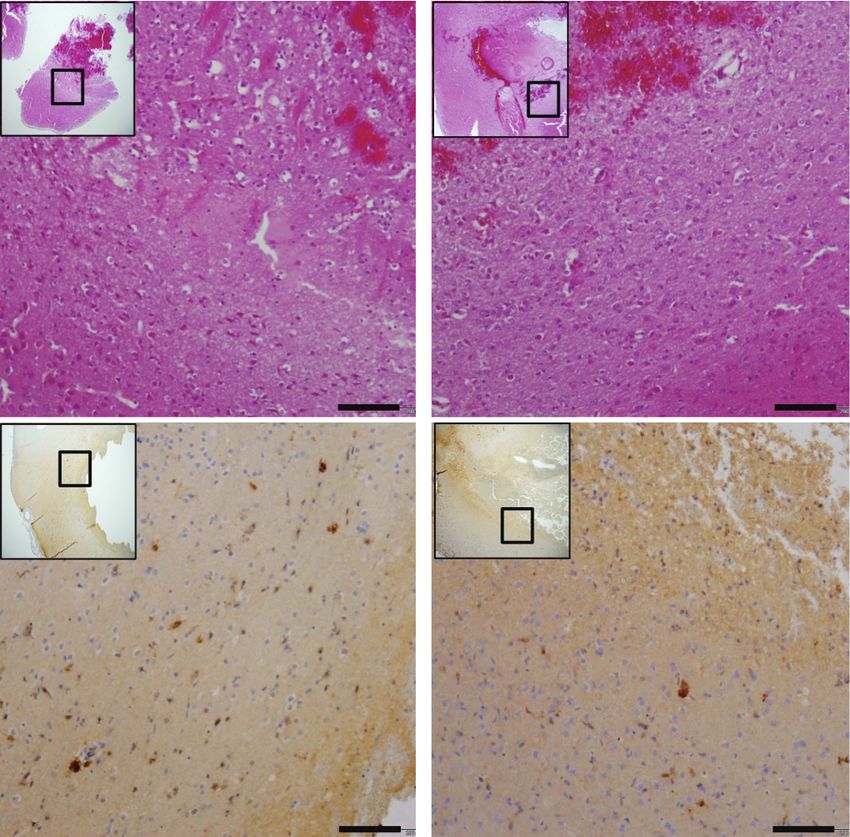
Supplementary Figure 4. Explorative magnetic resonance imaging (MRI)-
based edema quantification 24 hours after intracerebral hemorrhage (ICH)
A induction. Representative magnetic resonance image (T2) of two fixed rat
heads 24 hours after ICH induction with comparable hematoma volume
around 90 µL. (A) Control group without blood pressure lowering and (B)
with intensive blood pressure lowering (nifedipine-treated). The calculated
edema volume in both MRIs was around 20 µL (blue area). Afterwards his-
topathological analysis (hematoxylin eosin [HE] staining) from the same
B brains confirmed imaging results.
https://doi.org/10.5853/jos.2020.02390 http://j-stroke.org 3Bohmann et al. Blood Pressure Lowering after ICH
Supplementary methods Darmstadt, Germany) or saline alone were injected over 5 min-
utes using a microinfusion pump (Quintessential Stereotaxic
Animals Injector, Stoelting Co., Wood Dale, IL, USA). The needle was left
For this study 84 spontaneously hypertensive rats (SHRs) were in place for 10 minutes and was then slowly removed. After-
used (10 weeks old, male, body weight approximately 260 g; wards, the borehole was sealed with bone wax, the scalp was
Charles River Laboratories, Sulzbach, Germany). SHR constitute closed, and the rats were allowed to recover. The duration of
a well-established hypertensive rat model.1,2 All experimental the whole surgical procedure was approximately 35 minutes
procedures were conducted in accordance with the National for each rat. A closed-loop temperature system with a heating
Institutes of Health’s guide for the care and use of laboratory pad and a rectal temperature probe was used to maintain body
animals. The report of the data in this manuscript is compliant temperature.
with the Animal Research: Reporting of In Vivo Experiments
(ARRIVE) guidelines.3 This study was approved from the respon- Blood pressure lowering in acute ICH
sible regulatory authorities in Germany (Regierungspraesidium Intensive blood pressure management in acute ICH requires
Darmstadt, approval number FU/1070). specific qualities for the drug of choice: (1) orally applicable to
avoid stress induced hypertension; (2) quickly effective to en-
Study design and sample size calculation sure rapid blood pressure lowering after ICH induction; (3)
Previous studies showed a significantly worse functional out- non-sedating to allow neurological monitoring. Unlike cloni-
come for hypertensive vs. normotensive rats when intracerebral dine, nifedipine fulfils these criteria without relevant side ef-
hemorrhage (ICH) was induced.4 Thus, we assumed a beneficial fects. Nifedipine is a dihydropyridine calcium channel blocker.
effect of an intensive blood pressure lowering strategy after The anti-hypertensive effects of nifedipine in rats administered
ICH. Rats were randomized into an interventional (intensive by chow for up to 20 weeks are well characterized, no interac-
blood pressure lowering) group and a control group, respec- tion with collagenase VII-S is known.6
tively. Besides anti-hypertensive treatment, both groups were The intensive blood pressure lowering group received nife-
treated identically. Hematoma volume and neurological deficits dipine (oral liquid, 4 mg/mL, Ratiopharm, Ulm, Germany) per
were determined 24 hours after ICH induction (time point of nasogastric tube. Based on the results of explorative tests, a
expected maximum hemorrhage expansion and neurological dosage of 15 mg/kg body weight with an application volume
impairment). Histopathological analysis and magnetic reso- of 0.2 mL per treatment was chosen. In the control group sa-
nance imaging (MRI) were performed 24 and 72 hours after line alone was administered in the same frequency and volume.
ICH induction (to enhance sensitivity for secondary injury after The first oral administration of nifedipine or saline, respectively,
ICH during the first 3 days). An overview of animal numbers was scheduled at 30 minutes after ICH induction, to ensure the
per time point can be found in the Supplementary Table 1. swallowing reflex. Thereafter, rats were fed every 8 hours dur-
Based on the effect size of our previous studies (Cohens ing the first 24 hours, then every 12 hours.
D=1.75),5 we needed at least seven rats per group in order to Arterial blood pressure was measured non-invasively using a
detect a significant difference in hematoma volume between photoelectric tail cuff device (BP 2000, blood pressure system
the treatment regimens with a power of 80% and a type 1 er- for rats, Biomedical Instruments, Zöllnitz, Germany). This meth-
ror of 0.05 using a two-tailed Student’s t-test. Thus, we ran- od has previously been validated in SHR.2,7 Rats were placed in
domized nine rats per group. a restrainer on a heating plate with a temperature of 36°C. A
cuff was attached to the tail and gently tightened until detec-
ICH induction tion of the pulse signal. The animals acclimatized on the plate
All surgery was performed under isoflurane anesthesia (1.5% for 10 minutes, followed by 10 pre-measurements to reduce
to 2%) with spontaneous respiration. For analgesia, 0.1 mg/kg stress level. Ten measurements were then performed to gener-
buprenorphine were applied. For ICH induction, a small bore- ate mean values for systolic and diastolic blood pressure. To
hole was drilled and a 30-gauge 5 µL-microinjection needle avoid any impact of tail cuff measurements during critical
(Hamilton, Bonaduz, Switzerland; 75RN series) was slowly low- postoperative hours, blood pressure was not evaluated in ani-
ered into the right striatum at the following coordinates from mals scheduled for hematoma quantification, histopathological
bregma: 0.2 mm anterior, 3.5 mm lateral, and 5.5 mm depth. A analysis or outcome assessment. Instead, we analyzed separate
2 µL of saline containing 0.25 U collagenase VII-S (Sigma, animals after nifedipine/saline treatment up to 72 hours to en-
4 http://j-stroke.org https://doi.org/10.5853/jos.2020.02390Vol. 22 / No. 3 / September 2020
sure stable blood pressure lowering in the intervention group. OX-6, ab23990, dilution 1:500, Abcam). Sections were washed,
counterstained with hematoxylin and bluing reagent and
Functional outcome mounted. Evaluation of the stainings and photographic docu-
Neurological deficits were evaluated by a blinded rater 24 mentation were performed using an Olympus BX-50 light mi-
hours after ICH induction using the modified Neurological Se- croscope (Hamburg, Germany).
verity Score (mNSS).8,9 The 18-point mNSS includes testing for Ordinal histoscores were calculated using a semi-quantita-
hemiparesis, gait, coordination and sensory functions. Video- tive assessment for edema formation (HE staining, vacuolated
taped sequences were assessed for spontaneous motion activi- tissue compatible with vasogenic brain edema: 0=isolated
ty and the beam walking test, both parts of the mNSS. Rats hemorrhage, edema absent; 1=edema minimal, no midline
were not trained before the tests. Rats that died within the ob- shift; 2=edema minimal to medium with cortical involvement,
servation period were assigned the maximum of 18 points. no midline shift; 3=edema medium to strong with midline shift;
4=strong edema bilateral, midline shift) and blood brain barrier
Determination of ICH volume dysfunction (IgG staining, IgG extravasation as indirect marker
After mNSS assessment, rats were transcardially perfused with of blood brain barrier dysfunction: 0=isolated hemorrhage, ex-
50 mL phosphate buffered saline (PBS) under deep isoflurane travasation absent; 1=extravasation and blood-brain-barrier
anesthesia. Hemoglobin concentration was measured for each breakdown minimal; 2=extravasation minimal to medium;
hemisphere separately following a previously described proto- 3=extravasation medium to strong; 4=extravasation strong and
col.5 In brief, hemispheres were homogenized, subjected to ul- bilateral). Six slides per brain prepared from needle entry site
trasound for 60 seconds and centrifuged (13.000 rpm, 4°C, 30 ±1 mm were analyzed. The slides were evaluated in blinded
minutes). Photometric analysis of the supernatant mixed with random order with a standard light microscopy. Median scores
Drabkin’s Reagent solution (Sigma-Aldrich, Taufkirchen, Ger- were calculated.12
many) was then performed in duplicates at 540 nm. ICH vol-
ume was calculated based on a standard curve (data not Post-mortem MRI
shown in detail). Post-mortem MRI was applied as described elsewhere.13 Fol-
Rats found dead within the observation period could not un- lowing an identical experimental procedure as described above,
dergo transcardial perfusion. In this case, we performed a total 40 mL warmed saline-Prohance (in 0.9% saline, 37°C, 1:10
autopsy to exclude extracerebral bleeding. Afterwards, we de- solution of Prohance, Bracco, Princeton, NJ, USA) was used for
termined ICH volume as described above and subtracted 2.4 perfusion (4 minutes). Then 40 mL formalin-Prohance (in 10%
µL. This value was found to be the estimated cerebral blood formalin, 1:10 solution of Prohance, Milano, Italy) was given
volume in SHR.10 for another 4 minutes. Whole rat heads were removed and put
into 10% formalin for 24 hours without Prohance. Heads were
Histopathological analysis then transferred into Prohance-PBS (1:100 solution) and stored
After transcardial perfusion with 40 mL PBS and 40 mL buff- at 4°C. MRI was performed using a 7 Tesla small animal scan-
ered formalin (pH 7.4), rat brains were stored in buffered for- ner (PharmaScan, Bruker, Ettlingen, Germany) with a volume
malin and embedded in paraffin. Fixed brains were cut through coil. Data acquisition was performed using the Paravision 6.0.1
the needle entry site (identifiable on the brain surface) as well software (Bruker, Billerica, MA, USA). Modified driven equilibri-
as stepwise every 1 mm anterior and posterior to that plane. um Fourier transform (MDEFT) sequence was used for
Sections (3 µm) were obtained using a microtome (Quintessen- T1-weighted images with the following parameters: echo time
tial Stereotaxic Injector, Stoelting), placed on SuperFrost Plus (TE)=2 ms, relaxation time (TR)=4,000 ms. The matrix size was
slides, and deparaffinized. Hematoxylin eosin (HE) staining was 256×256 and the voxel size 0.17 mm. T2 sequences were mea-
performed. After incubation, slides were mounted in isopropa- sured afterwards (TR=2,200 ms; TE=33 ms). The matrix size
nol followed by xylene. was 512×512 and the voxel size 0.08 mm. Total imaging time
Immunhistochemical analysis was performed on the Discov- was 3 hours per rat head. Data analysis was performed by a
ery XT Immunohistochemistry System (Ventana, Strasbourg, blinded rater slide by slide quantifying hematoma and edema
France) as previously described.11 The following anti-rat anti- volume on T1 and T2-weighted images (MRIcro, Chris Rorden,
bodies were applied: rabbit anti-immunoglobulin G (IgG) (H&L, Columbia, SC, USA; www.mricro.com).
ab6703, dilution 1:2,000, Abcam, Cambridge, UK), and mouse
anti-major histocompatibility complex class II antibody (MRC
https://doi.org/10.5853/jos.2020.02390 http://j-stroke.org 5Bohmann et al. Blood Pressure Lowering after ICH Statistical analysis 5. Foerch C, Arai K, Jin G, Park KP, Pallast S, van Leyen K, et al. Prism 7 (GraphPad Software, San Diego, CA, USA) and SPSS ver- Experimental model of warfarin-associated intracerebral sion 22.0 (IBM Co., Armonk, NY, USA) were used for statistical hemorrhage. Stroke 2008;39:3397-3404. analysis. Blood pressure levels are presented as mean±standard 6. Motz W, Ploeger M, Ringsgwandl G, Goeldel N, Garthoff B, deviation (unless otherwise stated, systolic blood pressure val- Kazda S, et al. Influence of nifedipine on ventricular function ues are mentioned). Hematoma volume results are displayed in and myocardial hypertrophy in spontaneously hypertensive a scatter dot plot with mean values. Statistical significance was rats. J Cardiovasc Pharmacol 1983;5:55-61. assessed using the two-tailed t-test after passing Shapiro-Wilk 7. Kubota Y, Umegaki K, Kagota S, Tanaka N, Nakamura K, test. Neuroscore data are displayed in scatter plots with median Kunitomo M, et al. Evaluation of blood pressure measured by values and interquartile range (IQR). Statistical significance was tail-cuff methods (without heating) in spontaneously hyper- assessed using the Mann-Whitney U-test. For histoscore data tensive rats. Biol Pharm Bull 2006;29:1756-1758. medians and IQR are given and statistical significance was as- 8. Chen J, Sanberg PR, Li Y, Wang L, Lu M, Willing AE, et al. In- sessed using the Mann-Whitney U-test. Statistical significance travenous administration of human umbilical cord blood re- was set to P
You can also read