Preclinical evidence of mitochondrial nicotinamide adenine dinucleotide as an effective alarm parameter under hypoxia
←
→
Page content transcription
If your browser does not render page correctly, please read the page content below
Preclinical evidence of mitochondrial
                 nicotinamide adenine dinucleotide as
                 an effective alarm parameter under
                 hypoxia

                 Hua Shi
                 Nannan Sun
                 Avraham Mayevsky
                 Zhihong Zhang
                 Qingming Luo

Downloaded From: https://www.spiedigitallibrary.org/journals/Journal-of-Biomedical-Optics on 27 Sep 2020
Terms of Use: https://www.spiedigitallibrary.org/terms-of-use
Journal of Biomedical Optics 19(1), 017005 (January 2014)

                Preclinical evidence of mitochondrial nicotinamide
                adenine dinucleotide as an effective alarm parameter
                under hypoxia
                Hua Shi,a,b,† Nannan Sun,a,b,† Avraham Mayevsky,b Zhihong Zhang,a,b and Qingming Luoa,b,*
                a
                 Huazhong University of Science and Technology, Department of Biomedical Engineering, MoE Key Laboratory for Biomedical Photonics,
                Wuhan 430074, China
                b
                 Wuhan National Laboratory for Optoelectronics, Britton Chance Center for Biomedical Photonics, Wuhan 430074, China

                                 Abstract. Early detection of tissue hypoxia in the intensive care unit is essential for effective treatment. Reduced
                                 nicotinamide adenine dinucleotide (NADH) has been suggested to be the most sensitive indicator of tissue oxy-
                                 genation at the mitochondrial level. However, no experimental evidence comparing the kinetics of changes in
                                 NADH and other physiological parameters has been provided. The aim of this study is to obtain the missing data
                                 in a systematic and reliable manner. We constructed four acute hypoxia models, including hypoxic hypoxia,
                                 hypemic hypoxia, circulatory hypoxia, and histogenous hypoxia, and measured NADH fluorescence, tissue
                                 reflectance, cerebral blood flow, respiration, and electrocardiography simultaneously from the induction of hypo-
                                 xia until death. We found that NADH was not always the first onset parameter responding to hypoxia. The order
                                 of responses was mainly affected by the cause of hypoxia. However, NADH reached its alarm level earlier than
                                 the other monitored parameters, ranging from several seconds to >10 min. As such, we suggest that the NADH
                                 can be used as a hypoxia indicator, although the exact level that should be used must be further investigated.
                                 When the NADH alarm is detected, the body still has a chance to recover if appropriate and timely treatment is
                                 provided. © The Authors. Published by SPIE under a Creative Commons Attribution 3.0 Unported License. Distribution or reproduction of this work in
                                 whole or in part requires full attribution of the original publication, including its DOI. [DOI: 10.1117/1.JBO.19.1.017005]

                                 Keywords: nicotinamide adenine dinucleotide fluorescence; intensive care; monitoring; hypoxia; alarm; oxygen indicator.
                                 Paper 130591RR received Aug. 19, 2013; revised manuscript received Dec. 12, 2013; accepted for publication Dec. 16, 2013; pub-
                                 lished online Jan. 27, 2014.

                1       Introduction                                                                     earlier response (onset) signal than that in other tissues and
                Most deaths in the intensive care unit (ICU) arise from multiple                         organelles.
                organ dysfunction syndrome, which is widely recognized to be a                               Nicotinamide adenine dinucleotide (NADþ ) in its reduced
                result of tissue hypoxia1 and is associated with many life-threat-                       form, NADH, is an autofluorescent coenzyme involved in the
                ening conditions. The brain is the most vital organ that needs to                        mitochondrial respiration chain in all living cells. Under exci-
                be protected and precisely monitored in patients in the ICU and                          tation at 320 to 380 nm, NADH emits fluorescence at 420 to
                operating room (OR). Early detection and alarm signals are                               480 nm, while NADþ is unexcitable. Although NADH is an
                essential for the implementation of effective emergency mea-                             indirect index that reflects oxygen consumption, its particular
                sures and for saving lives. Current intensive care monitoring                            location at the very beginning of the respiration chain results
                includes the use of electrocardiography (ECG), blood pressure                            in it being the most sensitive oxygen indicator in mitochondria
                monitoring, central venous catheters, pulmonary artery cath-                             and tissues.5 Since, Chance et al. pioneered in vivo NADH
                eterization, cardiac output, pulse oximetry, airway CO2 monitor-                         measurement in 1962,6 >1000 related papers on NADH fluores-
                ing, transcutaneous blood gases, respiratory mechanics, respired                         cence combined with other parameters in vitro and in vivo stud-
                gas analysis, etc.2 Specifically, respired gas analysis determines                       ies have been published, and descriptions of typical NADH
                the oxygen uptake from inspiration and pulse oximetry provides                           changes in many pathological conditions have been provided.7
                an estimate of oxygen saturation in arteries. Central venous cath-                       However, to the best of our knowledge, no one has determined
                eters and pulmonary artery catheterization provide information                           the response speed of the NADH signal to hypoxia compared to
                regarding the oxygen saturation in veins, and transcutaneous                             other parameters.
                blood gases reflect the partial pressure of oxygen at the tissue                             Most of the parameters that are monitored in the ICU provide
                level.2 Oxygen is transported in the body as a result of                                 information on the systemic respiratory and cardiovascular com-
                differences in partial pressure at different locations. The partial                      partments. Multiparametric monitoring of microcirculatory and
                pressure of oxygen varies from 104 mm Hg in alveoli to 40 mm                             intracellular parameters is not available in ICUs or ORs on
                Hg in veins, 23 mm Hg in tissue cells, and is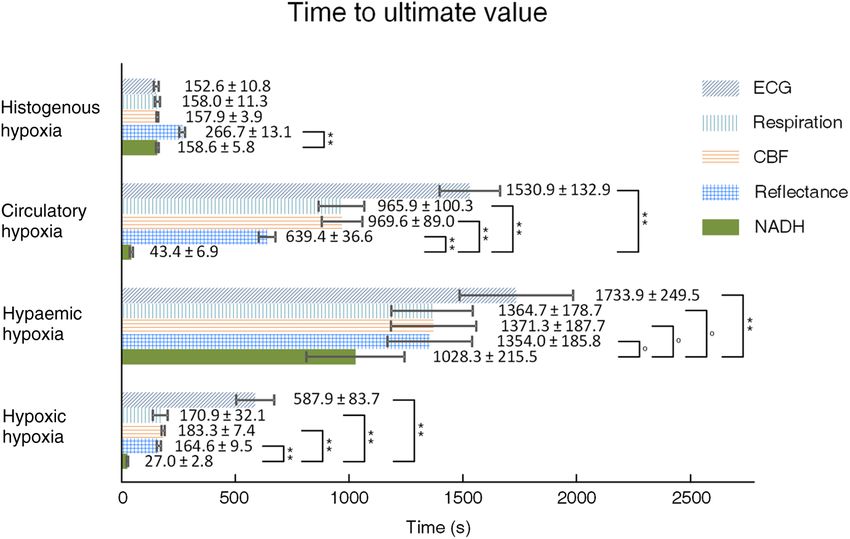
Shi et al.: Preclinical evidence of mitochondrial nicotinamide adenine dinucleotide. . .
2 Materials and Methods 2.2 Monitoring Platform
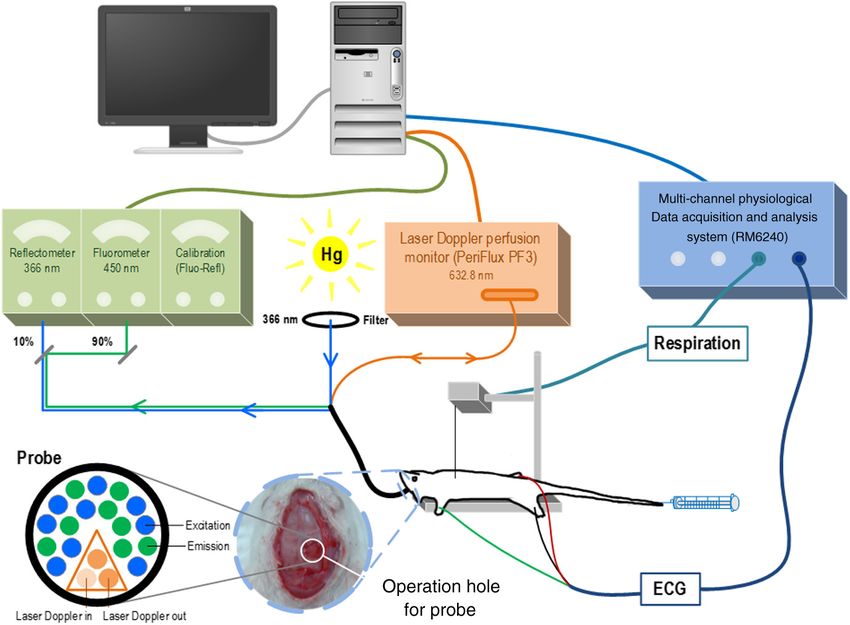
To provide comprehensive experimental evidence, we estab- The monitoring platform consists of two main parts, which are
lished four acute hypoxia rat models with varying causes of shown in Fig. 1. One part integrates a direct current (DC) flu-
hypoxia. These causes cover all the steps of oxygen transport orometer/reflectometer7 and a laser Doppler perfusion monitor
in body, and include hypoxic hypoxia, induced by lowering oxy- and measures regional parameters such as fluorescence, reflec-
gen tension in the lung; hypemic hypoxia (also called anemic tance, corrected NADH signals, and CBF.10 The other part is
hypoxia), which is caused by a decreased ability of hemoglobin a multichannel physiological data acquisition and analysis sys-
to carry oxygen; circulatory hypoxia (also called stagnant or tem (RM6240, Chengdu Instrument Factory, Chengdu, China)
ischemic hypoxia), which occurs in response to decreased and provides systemic and general information, including ECG
blood flow; and histogenous hypoxia (often confined to histo- and respiration.
toxic hypoxia), which reflects disabled metabolic activities in
The anesthetized animal was placed in the supine position,
tissues. Due to the variation in the causes of hypoxia, the
and the fiber optic probe of the monitor was fixed on the cerebral
response order, also referred to as onset order, of systemic
cortex within a 3-mm diameter region of interest that contained
pulmonary ventilation, cardiac circulation, and regional micro-
fewer blood vessels. Thus, the fluorescence, reflectance, cor-
circulation, should vary significantly. To evaluate the process of
rected NADH signals, and CBF were collected from approxi-
death from hypoxia, death was the endpoint for all models.
mately the same area in the cortex. The ECG electrodes were
Also, the measuring sustained after all the signs of death
happened, such as cerebral blood flow (CBF) reduced to mini- placed subcutaneously on the limbs in Lead II mode. The
mum and cardiac and respiratory arrest occurred. animal’s respiration was monitored and recorded with a thorax
Multiple parameters, including cerebral NADH fluorescence, skin linking convertor. The combined systems were controlled
366-nm reflectance, microcirculatory CBF, ECG, and respira- simultaneously through a script run in LabView (National
tion, were measured and analyzed from the induction of hypoxia Instruments, Austin, Texas).
until death.
2.3 Experimental Protocols
2.1 Animal Preparation
The experimental protocols were approved by the Institutional
Male adult Wistar rats, weighing 230 20 g, were anesthetized Animal Care and Use Committee of the Huazhong University of
intraperitoneally with a mixture of 10% urethane and 2% chloral Science and Technology. The rats were randomly divided into
hydrate (0.9 ml∕100 g body weight). Anesthesia was main- five groups, with eight rats per group. After the operation and
tained by adding one-sixth of the initial dose if the animal stabilization, a preliminary test of brain normality was per-
appeared to be regaining consciousness. The operation and formed by administering 99.9% nitrogen to the rats for approx-
the connection of the fiber optic probe to the cerebral cortex imately 30 s until they stopped breathing. The rats whose
were preformed according to the standard procedures.9 NADH levels were significantly increased passed the test,9 and
Fig. 1 The multiparametric monitoring platform consisting of two parts. One part integrates a DC fluor-
ometer/reflectometer, which measures fluorescence, reflectance, and calculated nicotinamide adenine
dinucleotide (NADH) signals, and a laser Doppler perfusion monitor for cerebral blood flow (CBF).
The other part is a multichannel physiological data acquisition and analysis system that monitors
ECG and respiration.
Journal of Biomedical Optics 017005-2 January 2014 • Vol. 19(1)
Downloaded From: https://www.spiedigitallibrary.org/journals/Journal-of-Biomedical-Optics on 27 Sep 2020
Terms of Use: https://www.spiedigitallibrary.org/terms-of-use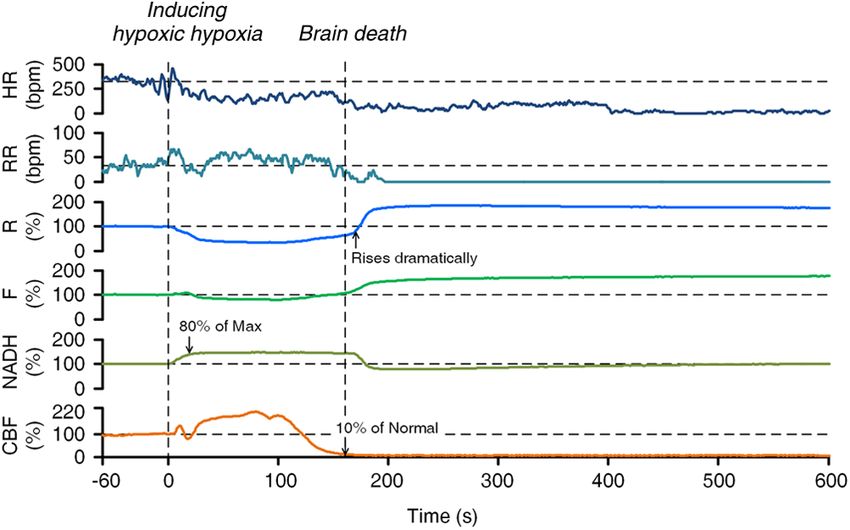
Shi et al.: Preclinical evidence of mitochondrial nicotinamide adenine dinucleotide. . .

                                                                Table 1 Summary of the treatments of the five groups.

                Group No.                         1                           2                                 3                              4                       5

                Hypoxia type                   Hypoxic                    Hypemic                          Circulatory                    Histogenous               Normal

                Treatment                   Breathe in N2        i.v. 100 mg∕kg NaNO2              Cut the right femoral artery      i.v. 125 mg∕kg CPZ            i.v. saline

                Number of animals                 8                           7                                 6                              7                       8

                they were allowed 15 min of rest for recovery, after which they                    Mayevsky and Chance and has been utilized for over 20 years
                were subjected to one of the different types of hypoxia (Table 1).                 in studies on the combination of NADH and CBF, as well as
                    Group 1 was given 99.9% nitrogen to induce hypoxic hypo-                       other parameters, such as electrocorticography, DC potential,
                xia until the rat died. Group 2 was injected with 100 mg∕kg                        extracellular ions, and oxyhemoglobin in the cerebral cortex
                sodium nitrite (NaNO2 , AccuStandard Inc., New Haven,                              under hypoxic hypoxia, hypemic hypoxia, and circulatory hypo-
                Connecticut), which can oxidize hemoglobin to methemoglobin                        xia. Typical signal responses have been summarized for various
                and decrease the binding of oxygen via the tail vein at a rate of                  pathological protocols.7
                0.5 ml∕ min. Group 3 was treated by cutting the right femoral                         In our study, five parameters were simultaneously measured
                artery, causing the rats to die due to blood loss. Group 4 was                     to compare systemic and regional changes from the induction
                intravenously injected with 125 mg∕kg chlorpromazine hydro-                        of severe hypoxia until death. The changes in the patterns of
                chloride (CPZ, injection product from Shanghai Harvest                             NADH and CBF exposed to hypoxic hypoxia were similar to
                Pharmaceutical Co. Ltd., Shanghai, China), an inhibitor on the                     those that have been previously reported.12 The control group
                respiratory chain between NADH and cytochrome c,11 at the same                     (saline) performed stable in every parameter during the whole
                rate as in Group 2. A high dose of NaNO2 and CPZ was chosen                        monitoring process, while the other four hypoxia groups pre-
                here to ensure 100% death based on our preliminary experiments.                    sented significant fluctuations. If we defined the time of induc-
                Group 5 was intravenously injected with saline at the same vol-                    ing hypoxia is time point 0, as seen in Fig. 2, the response time
                ume per body weight as used in the control. The measuring was                      of each parameter was defined as the point when the curve
                sustained after all the parameters reached their signs of death,                   rose higher than the maximum recorded before time point 0
                except that Group 5 was monitored for 30 min smoothly.                             or when it dropped lower than the minimum recorded before
                                                                                                   time point 0.
                2.4     Data Process and Statistics                                                   As expected, a significant difference in the order of the
                                                                                                   response times of these parameters was observed among
                For each group, the raw data on fluorescence, reflectance, CBF,
                ECG, and respiration were monitored simultaneously in
                LabVIEW and processed to figures by MATLAB (Mathworks,
                Natick, Massachusetts). The recorded fluorescence, reflectance,
                and calculated NADH voltages were converted to the percentage
                of 0.5 V.7 The baseline was defined as the mean value at 60 s
                prior to the time inducing hypoxia and set as 100%. CBF was
                calculated as the change in percentage from the baseline value.
                In an attempt to capture the change in heart rate and respiration
                rate more promptly, a period of 5 s was selected for the estima-
                tion of a beats-per-minute value at the middle time point.
                    The time constant of the integrated DC fluorometer/reflec-
                tometer and laser Doppler perfusion monitor is 3 s, and the
                time constant of ECG recorder is 0.2 s. As such, to align the
                time courses of all monitored parameters, 3 s was subtracted
                from the times recorded for measuring reflectance, fluorescence,
                calculated NADH, and CBF, and 0.2 s was subtracted from the                        Fig. 2 Representative multiparametric monitoring during the pro-
                time recorded for monitoring ECG waves.                                            cedure of hypoxic hypoxia till death. The horizontal axis represents
                    After discarding the samples that reflected obvious dysfunc-                   time (s). Monitored parameters are listed from top to bottom as
                tions during the experimental procedure, the data were based on                    heart rate (HR), respiration rate (RR), reflectance change (R), fluores-
                eight rats in Group 1, seven in Group 2, six in Group 3, and                       cence change (F), corrected NADH change (NADH), and cerebral
                seven in Group 4 and were analyzed by IBM SPSS Statistics                          blood flow (CBF). The rat breathed in nitrogen at the time point 0,
                                                                                                   and the baselines, shown as horizontal dashes, were calculated as
                for Windows (IBM Corp, Armonk, New York). Statistical sig-                         the mean values of each parameter during the 60 s before breathing
                nificance between hypoxia onset time and the time at which the                     in nitrogen. The vertical dashes tell the time when starting breathing in
                ultimate value was reached was calculated by the paired t tests.                   nitrogen and brain death. Brain death is defined as CBF decreased to
                The data are presented as the mean  SEM.                                          below 10%. The time, when NADH, reflectance, and CBF reached
                                                                                                   their ultimate values were pointed out, were defined as 80% of the
                3     Results                                                                      maximum, rising dramatically, and 10% of normal value (baseline),
                                                                                                   respectively. However, for respiratory and ECG, the ultimate value
                The integrated system of the DC fluorometer/reflectometer                          was defined when the raw waves recorded by RM6240 became
                and the laser Doppler perfusion monitor was developed by                           flat, not based on the calculated rate curves as shown in this figure.

                Journal of Biomedical Optics                                              017005-3                                             January 2014    •   Vol. 19(1)

Downloaded From: https://www.spiedigitallibrary.org/journals/Journal-of-Biomedical-Optics on 27 Sep 2020
Terms of Use: https://www.spiedigitallibrary.org/terms-of-use
Shi et al.: Preclinical evidence of mitochondrial nicotinamide adenine dinucleotide. . .
Fig. 3 Comparison of the response time of the monitored parameters to hypoxia. The horizontal axis
represents time (s), and the vertical axis shows the four types of hypoxia, each with the five monitored
parameters: NADH, reflectance, CBF, respiration, and ECG. The bar length represents the mean
response time to hypoxia for each parameter, and the error bar is the standard error of the mean
(SEM). A single asterisk (*) indicates that the significance of the response time between NADH and
any other parameter is p < 0.05, a double asterisk (**) indicates p < 0.01, and a circle indicates p < 0.1.
the four hypoxia models. As can be summarized in Fig. 3, the parameters studied, NADH is the parameter that is most sensi-
response time of each parameter was quite close in the hypoxic tive to hypoxia. This implication excludes the directly affected
hypoxia group, and the respiration signal responded the most parameters caused by different types of hypoxia.
promptly to the disturbance of breathing. In this group, We also compared the time required for each parameter to
NADH was the second signal to respond. In the hypemic hypo- reach its ultimate value before the animal died. According to
xia group, NADH responded first. Blood flow was the most the literature, when an animal dies, NADH reaches its maximum
directly affected parameter in the circulatory hypoxia group, and level.9 Additionally, reflectance increases, which is also called
accordingly, NADH, reflectance, and CBF were not statistically the secondary reflectance increase.7 In contrast, CBF drops to its
different from each other. minimal level and the respiration and ECG waves become flat.
However, in the histogenous hypoxia group, NADH only Therefore, we defined the time point when each parameter
responded earlier than the reflectance (p < 0.05). A reduction reached its ultimate value as follows. NADH reached 80% of
in the respiration rate occurred first, and this was followed the maximum, which in most cases represented the beginning
by a reduction in the heart rate, indicating that the drug, CPZ, of a plateau. Reflectance rose dramatically. CBF decreased
damaged the pulmonary, and cardiac circulation when it entered to below 10%, and it is known that when CBF decreases to
the veins and subsequently spread to the lungs and heart, before 10% of its normal value, brain death occurs. The respiration
arriving at the brain. Therefore, the mitochondria of the lung and and ECG waves disappeared. As shown in Fig. 4, we found
the heart were damaged successively before the brain was. that with the exception of the histogenous hypoxia group, the
By systematically comparing the response times of the five monitored parameters reached their ultimate values in a similar
parameters under the four types of hypoxia, we concluded that time sequence: NADH, reflectance, respiration, CBF, and
the order in which the monitored parameters respond is affected ECG. Notably, CBF and respiration reached their ultimate
by the type (cause) of hypoxia. Notably, among the five param- values at nearly the same time, confirming the signs that
eters studied, NADH is not always the first parameter to when the brain death occurs, both CBF and spontaneous breath
respond. As such, multiparametric monitoring may be required disappear.13
to increase the sensitivity of hypoxia detection. Any parameter However, we found that in all four hypoxia models, NADH
that responded earlier than the NADH merits attention. As indi- was the parameter that reached its ultimate value first. As shown
cated in Fig. 3, the lag time between the NADH response and the in hypoxic hypoxia in Fig. 4, NADH reached its ultimate value
directly affected parameters, such as respiration in hypoxic 156.3 s earlier than did CBF (p < 0.01), which represents brain
hypoxia, CBF in circulatory hypoxia, and respiration, ECG, death. In hypemic hypoxia, NADH reached its ultimate value
and CBF in histogenous hypoxia, is only between 2.2 and 343.0 s earlier than did CBF (p < 0.1). In circulatory hypoxia,
8.9 s. In contrast, the lead time between the NADH response NADH reached its ultimate value 596.0 s earlier than did reflec-
and the indirectly affected systemic parameters, such as ECG tance (p < 0.01), and the second one reached the ultimate value
in hypoxic hypoxia, respiration, ECG in hypemic hypoxia, 926.2 s earlier than did CBF (p < 0.01). In histogenous hypoxia,
and respiration and ECG in circulatory hypoxia, is between NADH, CBF, respiration, and ECG reached their ultimate values
6.2 and 55.6 s. The results suggest that among the five without significant difference (p > 0.05). In other words, when
Journal of Biomedical Optics 017005-4 January 2014 • Vol. 19(1)
Downloaded From: https://www.spiedigitallibrary.org/journals/Journal-of-Biomedical-Optics on 27 Sep 2020
Terms of Use: https://www.spiedigitallibrary.org/terms-of-useShi et al.: Preclinical evidence of mitochondrial nicotinamide adenine dinucleotide. . .
Fig. 4 Comparison of the time required for the monitored parameters to reach their ultimate values. The
horizontal axis represents time (s), and the vertical axis shows the four types of hypoxia. The ultimate
values are defined when the NADH reaches a plateau, secondary reflectance increases, CBF decreases
below to 10% of the normal level, and the respiration and ECG signals stop. The bar length represents
the mean time and the error bars are the standard error of mean (SEM). A single asterisk (*) indicates that
the significance of the response time between NADH and any other parameter is p < 0.05, a double
asterisk (**) represents p < 0.01, and a circle represents p < 0.1.
NADH reaches its ultimate value, brain death follows in from we suggest that 80% of the lower limit (increase of 36.9%) is
several seconds to >15 min. a possible indicator of NADH increase, which peaks at approx-
imately 130%. However, in our preliminary tests involving 30 s
4 Discussion and Conclusion breathing N2 , NADH levels were observed to rise by >50%
It is accepted that NADH is the most sensitive oxygen indicator during hypoxia, even though the animal could totally recover
at the mitochondrial level.7,9 However, previous studies have not after respiration was restored. As such, if the appropriate treat-
paid attention to the time comparison between NADH and other ment is provided in a timely manner, recovery is possible, even
simultaneously monitored parameters. In this study, we induced if NADH reaches its alarm limit (130%).
hypoxia in four different ways and investigated the responses of In addition to an elevation of 130%, the reduced rising slope
NADH and other parameters during the severe pathological of the NADH monitoring curve is also noteworthy, as this result
processes. We found that NADH plays a leading role as an indicates that NADH levels are reaching a plateau.
early and sensitive indicator of hypoxic, hypemic, and circula- In summary, based on the theory that was established and
tory hypoxia. It is known that any type of hypoxia can induce developed by Chance et al. in the last century, we have system-
adaptions and changes in pulmonary ventilation, hemoglobin atically studied four different types of hypoxia, specifically,
saturation, and cardiac output systems. The turbulent response quantitatively and simultaneously monitoring NADH, reflec-
of ECG, respiration, and CBF not only shows their state of dys- tance, CBF, respiration, and ECG from the induction of hypoxia
function but also reflects autoregulation by the body to maintain until death. We reported the onset order in which the parameters
homeostasis. responded to hypoxia, as well as the order in which the param-
Because NADH was shown to have an exciting advantage eters reached their ultimate values. Our results support NADH as
in terms of response time to hypoxia, a “gold standard” should a sensitive oxygen indicator comparing to regional microcircu-
be suggested for clinical application. We found that the latory and systemic signals. Moreover, even if the NADH curve
maximum of NADH increase was ð149.3 2.1Þ% in the reaches its alarm limit, appropriate and timely treatment can still
hypoxic hypoxia group, ð143.0 6.1Þ% in the circulatory prevent mortality.
hypoxia group, and ð144.5 3.9Þ% in the histogenous hypo-
xia group. These differences were not statistically significant.
In contrast, in hypemic hypoxia, NADH only rose ð126.3 Acknowledgments
2.4Þ%. The explanation for this finding might be that NADH Avraham Mayevsky is on leave from The Mina & Everard
can reduce the methemoglobin induced by NaNO2 back to Goodman Faculty of Life Sciences, Bar-Ilan University, 52900
oxyhemoglobin in red blood cells.14 Therefore, under normal Ramat Gan, Israel, and is supported by the 111 Project of China
conditions, when a rat dies, NADH levels may rise 136.9% (B07038). This work is also supported by the PhD Programs
to 151.4%. Foundation of the Ministry of Education of China (Grant
In our study, the time required for NADH to rise to a plateau No. 20110142130006) and the Director Fund of Wuhan
of approximately 80% of the maximum value was defined as National Laboratory for Optoelectronics (WNLO, 2009, Z. H.
the time at which the ultimate value was reached. Therefore, Zhang).
Journal of Biomedical Optics 017005-5 January 2014 • Vol. 19(1)
Downloaded From: https://www.spiedigitallibrary.org/journals/Journal-of-Biomedical-Optics on 27 Sep 2020
Terms of Use: https://www.spiedigitallibrary.org/terms-of-useShi et al.: Preclinical evidence of mitochondrial nicotinamide adenine dinucleotide. . .
References 9. A. Mayevsky and E. Barbiro-Michaely, “Shedding light on mitochon-
drial function by real time monitoring of NADH fluorescence: I. Basic
1. J. Boldt, “Clinical review: hemodynamic monitoring in the intensive methodology and animal studies,” J. Clin. Monit. Comput. 27(1), 1–34
care unit,” Crit. Care 6(1), 52–59 (2002). (2013).
2. K. Waxman, F. S. Bongard, and D. Y. Sue, “Intensive care monitoring,” 10. A. Mayevsky et al., “Optical monitoring of NADH redox state and
Chapter 8 in Current Diagnosis & Treatment: Critical Care, F. S. blood flow as indicators of brain energy balance,” Adv. Exp. Med. Biol.
Bongard, D. Y. Sue, and J. R. Vintch, Eds., pp. 187–207, McGraw- 471, 133–140 (1999).
Hill Medical, United States (2008). 11. M. Dawkins, J. Judah, and K. Rees, “The mechanism of action of chlor-
3. “Transport of oxygen and carbon dioxide in blood and tissue fluids,” promazine. 2. Reduced diphosphopyridine nucleotide–cytochrome c
Chapter 40 in Textbook of Medical Physiology, A. C. Guyton and reductase and coupled phosphorylation,” Biochem. J. 73(1), 16–23
J. E. Hall, Eds., pp. 502–513, Elsevier Health Sciences, Philadelphia (1959).
(2006). 12. A. Mayevsky, “Mitochondrial function and energy metabolism in
4. J. Nunn, “Cerebral oxygen transport consumption and metabolism: cancer cells: past overview and future perspectives,” Mitochondrion
transport of oxygen to the brain: respiratory, circulatory and biochemi- 9(3), 165–179 (2009).
cal factors,” Acta Anaesthesiol. Scand. 15(S45), 69–77 (1971). 13. T. E. Hills, “Determining brain death: a review of evidence-based guide-
5. B. Chance et al., “Basic principles of tissue oxygen determination from lines,” Nursing 40(12), 34–40 (2010).
mitochondrial signals,” Adv. Exp. Med. Biol. 37, 277–292 (1973). 14. A. Tomoda et al., “Kinetic studies on methemoglobin reduction by
6. B. Chance et al., “Intracellular oxidation-reduction states in vivo,” human red cell NADH cytochrome b5 reductase,” J. Biol. Chem.
Science 137(3529), 499–508 (1962). 254(8), 3119–3123 (1979).
7. A. Mayevsky and G. G. Rogatsky, “Mitochondrial function in vivo
evaluated by NADH fluorescence: from animal models to human
Biographies of the authors are not available.
studies,” Am. J. Physiol. 292(2), C615–C640 (2007).
8. A. Mayevsky and E. Barbiro-Michaely, “Shedding light on mitochon-
drial function by real time monitoring of NADH fluorescence: II: human
studies,” J. Clin. Monit. Comput. 27(2), 125–145 (2013).
Journal of Biomedical Optics 017005-6 January 2014 • Vol. 19(1)
Downloaded From: https://www.spiedigitallibrary.org/journals/Journal-of-Biomedical-Optics on 27 Sep 2020
Terms of Use: https://www.spiedigitallibrary.org/terms-of-useYou can also read