Boating impacts and boat-wake resilient restoration of the eastern oyster Crassostrea virginica in Mosquito Lagoon, Florida, USA
←
→
Page content transcription
If your browser does not render page correctly, please read the page content below
Proceedings of Indian River Lagoon Symposium 2020

Boating impacts and boat-wake resilient restoration of the eastern
oyster Crassostrea virginica in Mosquito Lagoon, Florida, USA

Linda J. Walters(1), Paul E. Sacks(1) and Donna E. Campbell(1,2)
(1)
    Department of Biology, University of Central Florida, 4000 Central Florida Blvd., Orlando, FL
32816
(2)
    Southwest Florida Water Management District, 2379 Broad Street, Brooksville, FL 34604

Abstract In Mosquito Lagoon, Florida, there has been a 24% loss of intertidal oyster (Crassostrea
virginica) habitat since 1943; many live reefs have been replaced by steep piles of disarticulated
shell. To understand the relationship between boating and reef loss, we determined boating intensity
and numbers of boat wakes contacting reefs. We then asked if oyster restoration could be successfully
undertaken in areas where disarticulated shell had accumulated. We documented 1290 boats passing
near Mosquito Lagoon reefs, with 0 – 51.4 boats producing wakes each hour. Maximizing boating
distances to limit wakes would help protect oyster reefs. Community-based restoration began in 2007
and was tracked through 2020. Restoration footprint (density, shell height, profile, thickness, bridges)
and off-footprint (density, seagrass) data documented success, suggesting that stabilizing oyster shell
was all that was needed in the region. These results provide guidance for boating management and
future oyster restoration efforts in microtidal estuaries.

Keywords Community-based restoration, Erosion, Indian River Lagoon, Intertidal, Oyster reef,
Recreational boating

Introduction
Oysters provide a variety of critical ecosystem services to estuaries (e.g. Kennedy
et al. 1996, Coen et al. 1999, Gutirrez et al. 2003). These include habitat
provisioning for recreationally and commercially important species (e.g. Peterson
et al. 2003, Coen et al. 2007, Drexler et al. 2014); attenuating wave energy that
frequently translates into reduced shoreline erosion (e.g. Manis et al. 2015, Walters
et al. 2017, McClenachan et al. 2020); and transferring nutrients, phytoplankton and
suspended solids from the water to tissues, shells and the seabed (e.g. Kellogg
2013, Chambers et al. 2017, Fodrie et al. 2017, Locher et al. 2020), thereby
increasing water clarity and light availability for submerged vegetation (e.g. Volety
et al. 2014). Due to this multitude of ecosystem services, oysters are valued at up to
$99,000 per hectare per year (Grabowski et al. 2012). Unfortunately, overharvest-
ing (e.g. Rothschild et al. 1994), ecosystem degradation (e.g. Gittman et al. 2015),
and diseases (e.g. Kennedy et al. 1996) have led to dramatic declines in oyster
reefs, with global surveys reporting an 85% loss of shellfish reefs over the past
century (Beck et al. 2011). Other threats to oyster populations are rising

Corresponding author: Linda Walters, linda.walters@ucf.edu

                                                   173
Walters et al. Boat wakes and oyster restoration
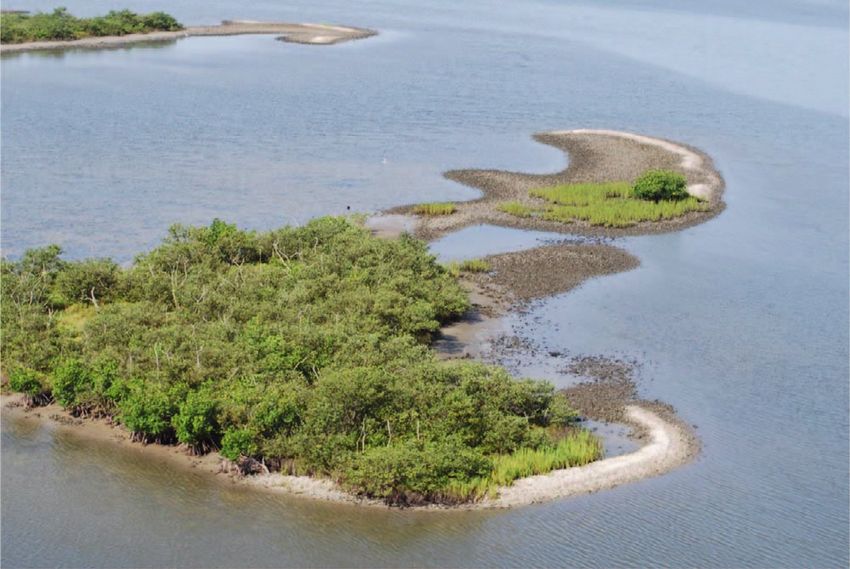
Figure 1. Aerial photograph showing live (dark brown) and dead (bright white) reef areas in Mosquito
Lagoon, FL.
temperatures (McClenachan et al. 2021) and cultural eutrophication, leading to
increased algal blooms that negatively impact bivalves (e.g. Gobler et al. 2013).
The eastern oyster Crassostrea virginica is a foundational species along the
western Atlantic. Intertidal populations of C. virginica occur in Mosquito Lagoon,
Florida. Mosquito Lagoon, the northernmost region of the Indian River Lagoon
system (IRL), is characterized by extensive development along shorelines in its
northern half, and limited development along southern shorelines connected to
Canaveral National Seashore (CANA) and Merritt Island National Wildlife Refuge
(Phlips et al. 2015). Mosquito Lagoon has a mean water depth of 1.7 m and is
characterized by wind-driven circulation, is microtidal along much of its length
(range: 1 cm – 1m; 10 cm in study region), and is subject to long water residence
times, high salinities and, more recently, high nutrient loadings (Smith 1993,
Steward et al. 2006). Lagoon water temperatures range from 4 – 33 8C, salinities
range from 22.6 – 45.2 ppt, and vertical stratification is limited due to the
shallowness of the estuary (Walters et al. 2001, Phlips et al. 2015). Sea level rise in
Mosquito Lagoon averages 2 cm y1 (IRL NEP 2020).
Garvis et al. (2015) documented 2542 reefs of C. virginica, primarily patch
reefs, in Mosquito Lagoon using 2009 aerial photographs. Reefs ranged in size
from , 10 to . 5000 m2 (Garvis et al. 2015). Twenty-four percent of the coverage
of C. virginica was lost between 1943 and 2009 (Garvis et al. 2015). Within
CANA, the losses were even greater, with 40% loss in coverage of the 524 reefs. In
Mosquito Lagoon, and similarly in northeast Florida, live reefs are frequently
replaced by dead reefs along boating channels (Garvis et al. 2015, 2020). Dead
reefs and dead margins on the seaward edges of live reefs are bright white in color
(reflective in aerial images) and composed of bleached, disarticulated shells that are
continuously exposed during a tidal cycle (Figure 1, Cannon et al. submitted). Dead
reefs in Mosquito Lagoon can extend over 60 cm above mean low water while
reference (intact, natural) reefs rarely exceed 30 cm in height (Walters et al. 2007).
174 Florida Scientist 84 (2–3) 2021 Ó Florida Academy of SciencesBoat wakes and oyster restoration Walters et al.
Additionally, movement of dead reefs away from boating channels was observed at
0.9 6 0.3 m/yr, while live reefs did not move or change shape (Garvis et al. 2015).
To understand the reason for this decline of oysters in Mosquito Lagoon,
researchers methodically tested sources of mortality of shellfish, especially C.
virginica, common in other protected waters: diseases, storms, predation, and
competition. Walters et al. (2007) tracked MSX (Haplosporidium nelsoni) and
Dermo (Perkensis marinus) on live vs. dead reefs twice per year for three years. No
differences between reef types existed; no MSX was found, and Dermo levels were
low and constant over the 3-year study (Walters et al. 2007). Vertical reef profiles
were run immediately before and after three hurricanes in 2004. Hurricanes Charlie,
Frances, Jeanne – categories 4, 2, and 3, respectively - produced winds and rain that
impacted Mosquito Lagoon (Steward et al. 2006, Walters et al. 2007). Reef profiles
were unchanged, and no dead reefs were created or lost as a result of these
hurricanes (Walters et al. 2007). Biodiversity on Mosquito Lagoon oyster reefs
exceeds 149 species of macrofauna (e.g. Boudreaux et al. 2006, Barber et al. 2010).
Predators of C. virginica (oyster drills, crown conch, American oystercatcher,
oyster toadfish) were not found in densities that would significantly reduce C.
virginica densities (e.g. Stiner and Walters 2008, Craig et al. 2016, Shaffer et al.
2019). Competition with sessile barnacles and mussels, however, did reduce oyster
survival in Mosquito Lagoon. Boudreaux et al. (2009) examined interactions
between C. virginica and the native barnacle Balanus amphitrite as well as the non-
native barnacle B. eburneus (¼ Amphibalanus amphitrite and A. eburneus,
respectively). They found that barnacles could outcompete oyster spat if either
barnacle species attached to a substrate before or at the same time as the oyster.
Additionally, if barnacles attached first, then they reduced the likelihood that C.
virginica would also attach (Boudreaux et al. 2009).
In 2004, the first individuals of the invasive charru mussel Mytella charuana
were reported in Mosquito Lagoon (Boudreaux and Walters 2006). In 2010, two
additional invasive species were found on reefs of C. virginica and other hard
surfaces; these were the pink barnacle Megabalanus coccopoma and the green
mussel Perna viridis (Spinuzzi et al. 2013). Both introductions were also likely the
result of ballast releases. Yuan et al. (2016) reported that all three species had
negative impacts on C. virginica. Megabalanus coccopoma reduced larval
settlement, while the two mussels negatively impacted survival and growth of C.
virginica (Yuan et al. 2016, Galimany et al. 2017). Interestingly, the native mussel
Geukensia demissa did not negatively impact settlement, growth, or survival of C.
virginica (Yuan et al. 2016). Blooms of the non-native brown tide microalga
Aureoumbra lagunensis were first recorded in Mosquito Lagoon in 2012; this
microalga negatively impacted oyster recruitment when cell counts exceeded
10,000 ml1 (Walters et al. 2021).
Although none of these frequently reported causes of C. virginica declines
were found to be the source of lost acreage in Mosquito Lagoon, oyster reef
restoration was requested by CANA. Methodology was developed that utilized
natural oyster recruitment while keeping oyster clusters anchored in the sediment
(Garvis et al. 2015). Oyster restoration mats (0.25 m2) were produced from Vexare
Florida Scientist 84 (2–3) 2021 Ó Florida Academy of Sciences 175Walters et al. Boat wakes and oyster restoration
extruded polyethylene mesh with 2.5-cm square openings to which 36 adult shells
of C. virginica, each with a hole drilled near the umbo, were individually attached
with 50-lb test cable ties. Shells were dispersed across the mat in a vertical
orientation similar to live oysters on reefs in Mosquito Lagoon (Stiner and Walters
2008). Mats were held in place with cement irrigation (donut) weights and
deployed across dead reefs after the disarticulated shells were raked down to low
intertidal height relative to nearby reefs. Shells were collected from restaurants or
shucking facilities and kept on land exposed to the elements in quarantine for a
minimum of 6 months to avoid potential transfer of any live aquatic organisms
from one location to another. This design was cost-effective, volunteer friendly,
and easy to transport. Over 51,000 volunteers helped with this project between
2007 and 2020.
Grizzle et al. (2002) and Garvis et al. (2015) both reported that all dead reefs in
Mosquito Lagoon were located in primary boating channels, but directly relating
oyster losses to boat wakes remains a knowledge gap. Here, we provide new
information on boating activity in Mosquito Lagoon as well as a mechanism for
how boat wakes can be the source of dead reefs. In addition, we provide data on
restoration using oyster restoration mats in primary boating channels in CANA. Our
results focus on reefs restored in 2007, with restoration metrics collected through
2020.
Materials and Methods
Boating activity surveys in Mosquito Lagoon. Scheidt and Garreau (2007) used aerial surveys to
document boating activity in Mosquito Lagoon in 2006-2007 and found that 76% were fishing boats.
Advancements in boating technology now allows boaters to travel in much shallower waters than in the
past, potentially increasing the negative impacts of boating (Scheidt and Garreau 2007). To complement
their efforts, two sets of boating surveys were conducted in this study from intertidal oyster reefs in
Mosquito Lagoon within CANA. The first survey design provided many hours of boating information,
while the second provided more detailed data. For the first survey design, observers were stationed on
one of 20 haphazardly assigned reefs in primary boating channels in Mosquito Lagoon between January
2003 and April 2006. All observations occurred during daylight hours, within 3 h of low tide so all or
part of the reefs were exposed. Recorded data included: number of boats/h, boat type (fishing/pleasure,
pontoon, jet ski, kayak/canoe), boat motor horsepower (50 or less, 51 or greater), and if wakes from these
boats contacted oysters on the observation reef.
For the second survey design, 20 oyster reefs along boating channels were visited twice each
between September 2012 and June 2013. Each visit lasted 40 min. Observers recorded the number and
type of boats that passed the reef. Additional data recorded for each boat included speed (Stalker Pro II
Sports radar gun), passing distance from each reef (Nikon Laser 1200 Long Range Precision
Rangefinder), and whether or not the boat was on plane.
Field study of wakes generated by boats in Mosquito Lagoon. A field study was designed to
determine the wake heights of multiple boat types that contacted intertidal oyster reefs in Mosquito
Lagoon. Five restored oyster reefs were selected at random using GIS software from an existing shapefile
of all restored oyster reefs in Mosquito Lagoon in March of 2014 (Garvis et al. 2015). The selected reef
coordinates were 28.939565N, 80.845332W; 28.941851N, 80.85852W; 28.944601N, 80.853809W;
28.943074N, 80.860553W; and 28.942152N, 80.865079W. Each of the five reefs was considered a
replicate and was chosen for this study because it had similar characteristics to natural reefs in the area
but had previously formed dead margins, indicating sufficient pressures that resulted in dead reef
formation. Boat passes were conducted at each site to include all possible combinations of four pre-
176 Florida Scientist 84 (2–3) 2021 Ó Florida Academy of SciencesBoat wakes and oyster restoration Walters et al.
determined variables: hull type, boat speed, distance of boat from oyster reef, and whether or not the boat
was on plane. The levels used for each variable were based on the results of boating activity observations
described above.
The boat lengths tested in our trials, as well as engine horsepower, were based on availability. A
Boston Whaler (4.0 m, 40 hp outboard engine) was provided by the UCF Biology Department; a pontoon
(Monark 223 Fish & Swim, 6.9 m, 60 hp outboard engine) and flat bottom skiff (Griffis & Sons
Stumpnocker, 4.9 m, 35 hp outboard engine) were provided by a generous volunteer. A v-hull boat was
not used in this study because the boating channels near test reefs were too shallow at low tide for a v-
hull to navigate safely.
Each boat was tested under varying speeds, which fell into one of three categories: idle (,8 km/h),
slow (8-24 km/h), and fast (25-40 km/h). Boats passed the oyster reefs at two different distance
categories (close, far); distances considered close versus far depended on the geography of each
individual site. A buoy was placed in the center of the channel seaward of each oyster reef, and all passes
on the far side of the buoy were considered ‘‘far,’’ while passes on the near side were considered ‘‘close’’.
Passes were conducted with boats both on plane and not on plane. However, pontoon boats were not run
on plane, as this hull type does not typically allow for planing. Additionally, at very low speeds, it was
not possible for the boats to get on plane, and likewise at the faster speeds, it was not always possible to
stay off plane. By running all possible trials, we were able to obtain up to 12 mean wave heights for each
boat.
Five replicates of every possible combination of these variables were completed for a total of 121
runs. All five replicates were completed in one day for the pontoon boat (4/24/14), while the skiff and
whaler both required two days for completion (4/23/14 & 4/25/14 and 4/12/14 & 5/5/14, respectively).
Each boat type completed all necessary passes at each reef within one session before proceeding to the
next site. All passes were performed within 3 h of low tide, while the oyster reefs were at least partially
exposed. The order of the passes at each site was randomized prior to data collection.
The surface level of the water was measured during all boat passes with an Ocean Sensor
Systemse wave logger. Data were recorded continuously on a compact flash memory card at a recording
frequency of 10 Hz. While the wave logger recorded water levels in count units, a linear response curve
that related counts to water level (in cm) was produced based on calibration prior to logger deployment.
This allowed a time-series of water level to be produced from which a statistical wave-by-wave analysis
could be performed to compute wave height.
For each pass, two observers standing at the edge of the oyster reef recorded boat speed (Stalker
Pro IIe sports radar gun), passing distance from the reef (Nikon Laser1200 Long Range Precision
Rangefindere), time for the wake to first contact the wave logger, wind speed while the boat passed
(Kestrele 2000 wind meter), and number of visible waves in each wake.
Burial depth of oysters on intertidal reefs. To understand the impact of wakes on C. virginica over
time on intertidal oyster reefs, burial depths of oyster clusters in the sediment were recorded. All clusters
and individual oysters were carefully excavated from ten 0.16-m2 quadrats/reef on 10 haphazardly
selected reference reefs (intact live oysters, not in boating channels) and 10 reefs in primary boating
channels where dead margins were starting to form. The burial depth of all excavated clusters of C.
virginica within these quadrats was recorded in mm using calipers.
Oyster reef restoration: monitoring metrics. Reefs restored in June-July 2007 using oyster
restoration mats and nearby reference oyster reefs were monitored following methods outlined in Baggett
et al. (2015), and included oyster density, shell height, and vertical reef profiles. Additionally, measures
of reef thickness (vertical reef accretion) and bridging between deployed oyster shells were recorded for
these low profile reefs, plus oyster density and seagrass recruitment off the restoration footprint. Finally,
counts of red (Rhizophora mangle) and black (Avicennia germinans) mangroves, as well as four invasive
species (Brazilian pepper Schinus terebinthifolia; mussels M. charruana, P. viridis; barnacle M.
coccopoma) were recorded when observed on reefs.
Density was determined by counting all live C. virginica/quadrat and averaging all quadrats/reef. In
years one through ~six post-restoration, thirty 0.25-m2 quadrats (mats)/reef were randomly selected
using a random number generator after numbering all mats on each reef. After year 6, mat edges could
Florida Scientist 84 (2–3) 2021 Ó Florida Academy of Sciences 177Walters et al. Boat wakes and oyster restoration
not be determined, so quadrats were haphazardly selected by the research team by having individuals
close their eyes and throw quadrats. On reference reefs, oyster density was always counted where
haphazardly thrown quadrats landed. Density was annually counted during winter months (January-
March) when recruitment was low or absent (Walters et al. 2021).
Oyster shell height was measured using two methods to better understand restoration success in
Mosquito Lagoon. To understand the initial growth rates of recruits during the first six months post-
deployment, the shell heights of all live C. virginica in 20 haphazardly-thrown, 0.25-m2 quadrats on four
June-restored reefs were measured with calipers/rulers (mm) during January of the following year.
Second, to document the range of oyster sizes on reefs restored 12 years earlier, in July of 2019 the shell
heights of 50 C. virginica in each of five 0.25-m2 haphazardly deployed quadrats were recorded for the
seven restored reefs. These shell heights were compared to those on a similar number of nearby reference
reefs collected the same month.
Vertical reef profile data were collected with methods described in Walters et al. (2007). The
elevation of each reef, relative to fixed points on the lagoon bottom from the landward to seaward edges
of each reef, was measured with a laser level, stadia rod, compass and transect tape. Measurements from
fixed points (metal stakes) were recorded at 20-cm intervals for each patch reef along 3 parallel transects
per reef. Data was first collected in the spring of 2007, prior to restoration, and then annually from 2010
to 2020.
Reef thickness is a metric used on low-relief intertidal oyster reefs in Mosquito Lagoon to track
fine-scale, vertical accretion above the sediment over time (Chambers et al. 2017), with the expectation
that reefs will continue to increase in height via oyster growth and recruitment until they reach the
maximum for growth enabled by the local tidal range (Rodriguez et al. 2014). On each of ten
haphazardly selected quadrats per reef, the height of five haphazardly selected points was recorded with a
metal rod (rod diameter: 1 mm) and ruler and then averaged.
Bridging refers to a physical connection between two initially separate units (deployed oyster
shells) produced by recruitment and growth of C. virginica. The number of bridges was counted within
individual mats and between mats. This was a proxy for oyster cluster formation on reefs and continued
to be monitored each winter until the number of bridges exceeded our ability to distinguish individual
bridges.
To determine impacts of restoration off of the footprint, we examined seagrass recruitment seaward
of, and oyster density landward of, the restoration. For both metrics, ten 10-m transects were haphazardly
deployed along the mats forming the edges of the reef. For seagrass, transects extended from the seaward
reef edge into the lagoon, while for oyster recruitment, transects were laid from the landward edge of the
patch reef toward shore. If the shore edge was , 10 m from the reef, that distance was recorded and the
data were adjusted accordingly. To understand seagrass recruitment, the distance to the first encounter
with seagrass along each transect line was recorded. If none was found, that was reported. For off-
restoration footprint oyster density, the number of live oysters touching the transect line was summed per
line and means compared over time. Both seagrass and oyster data were collected for the reefs restored in
2007 from the first monitoring in winter 2008 through winter 2020.
Additional information recorded during monitoring sessions included: 1) the number of live, sessile
invasive invertebrates found within density quadrats, and 2) the number of mangroves and invasive
Brazilian pepper fruits anywhere on the reef surfaces. For R. mangle, A. germinans, and S.
terebinthefolia, only 2007 restored and reference reefs were compared. For M. charuana, P. viridis,
and M. coccopoma, the number of individuals found in thirty 0.25-m2 quadrats per reef (restored þ
reference) were collected for all monitored reefs each year.
Data analyses. For the boat wake field data collection, each day of data collection constituted a
separate dataset of water surface levels to be analyzed. With Matlab R2014b (Mathworks 2014), Hmax
(maximum wave height) was calculated for each boat pass. Model selection analysis was performed in R
(R Core Team 2015) to determine the most influential factors driving the wake height. Due to pontoon
boats not having the ability to run both on and off plane, model selection had to be broken into two
separate models. The first model included all boat types, but excluded whether or not the boats were on
plane. The second model excluded pontoon boats but included whether or not the boat was on plane. For
178 Florida Scientist 84 (2–3) 2021 Ó Florida Academy of SciencesBoat wakes and oyster restoration Walters et al.
Table 1. Boating activity in Mosquito Lagoon around intertidal oyster reefs. There were 91 observation
days and 133.32 hours (7999 minutes) of observations.
Mean boats/ h
Boat category Total boats Percent of total (6 S.E.) Maximum boats/h
No Wake
Kayaks/canoes 109 8.4% 1.24 6 0.34 21.81
Pontoon boat 3 0.2% 0.05 6 0.03 1.67
Boats with 50þ hp motor 19 1.5% 0.13 6 0.04 1.67
Boats with 50 hp motor 32 2.5% 0.23 6 0.06 4.14
All No Wake boats 163 12.6% 1.46 6 0.36 21.81
Wake
Jet skis 46 3.6% 0.29 6 0.09 4.93
Pontoon boat 104 8.1% 0.68 6 0.14 6.91
Boats with 50þ hp motor 745 57.8% 7.12 6 0.91 38.60
Boats with 50 hp motor 232 18.0% 1.70 6 0.38 24.20
All Wake boats 1127 87.4% 9.80 6 1.13 51.43
All boats (No Wake þ Wake) 1290 100% 11.26 6 1.25 51.43
all analyses, Hmax, the speed of the boat, and the distance of the boat from the reef were log transformed
for normality. For the model excluding pontoon boat data, Hmax, the speed of the boat, and the distance
of the boat from the reef were also centered around the mean in order to decrease the variance inflation
factor. All model selection utilized linear models and were performed in the AICmodavg package with
the criteria of lowest AICc value to determine the most informative model. The random effect of site was
added to each of the most informative models to account for any variability having to do with the
location blocking term.
For reef burial and reef restoration metrics, one-way ANOVAs were run with reef type and
monitoring year as the variables of interest, respectively. Prior to running ANOVAs, all data were
determined to satisfy the assumptions of normality and homogeneity of variance (Shapiro-Wilk test,
Levene test). When differences were found, Tukey’s a posteriori multiple comparisons tests were run to
compare among reef types or among years since restoration. All means are reported as mean 6 1 S.E.
unless otherwise noted.
Results
Boating activity in Mosquito Lagoon. A total of 133.32 hours (7999 minutes)
of boating activity in channels adjacent to oyster reefs was documented during
daylight hours (6:00 AM – 4:40 PM) between 20 January 2003 and 22 April 2006,
with observations occurring across all months and days of the week (Table 1).
Winds never exceeded 24 km/h on observation dates. Over the 91 observation
sessions, extensive boating and boat wake activity were observed on some dates
while no boating activity occurred on other dates. One thousand two hundred ninety
vessels were observed, with a mean of 11.26 6 1.25 boats/h passing near the
observed oyster reefs (Table 1). The recorded maximum was 51.43 boats/h, and all
of these were wake-creating vessels (Table 1). Kayaks and canoes (n ¼ 121) never
created wakes, while 97% of pontoon boats (n ¼ 104), regardless of motor size (90
hp or less), produced wakes that contacted oyster reefs. Although technically not
allowed in the national park where observations occurred, jet skis (n ¼ 46),
likewise, always created wakes that hit reefs. One observed airboat created a wake,
Florida Scientist 84 (2–3) 2021 Ó Florida Academy of Sciences 179Walters et al. Boat wakes and oyster restoration
while one inflatable boat (i.e. Zodiac) with a 20-hp motor did not produce a wake.
A total of 22 boats (1.7%) traveling near oyster reefs had motors of 125-hp or
greater; four were 200 hp, one had twin 200 hp motors, and one boat had twin 225-
hp motors.
Of the 71 boats recorded on oyster reefs using the second boating survey
design, 42% were fishing boats (e.g. Boston Whaler, Carolina Skiff) or similar with
a cathedral hull (three v-shapes along the hull), 16% were flats fishing boats with a
completely flat hull, 14% were v-hulls, and 10% were pontoon boats where the hull
of the boat is a platform with an air-filled pontoon on each side for buoyancy. Other
boat types observed less frequently included sailboats, jon boats (aluminum, flat-
bottomed hull), and motorized canoes. A maximum of 19.5 boats/h and a mean of
4.8 6 0.48 boats/h passed by reefs during these observations. The mean speed of all
boats was 27.2 6 1.8 km/h with 75% of boats traveling slower than 38.6 km/h and
25% traveling slower than 13.0 km/h. The fastest boat was a v-hull with a 115-hp
engine, traveling at 53.1 km/h towing a water skier. The mean distance of the boats
from oyster reefs was 65.1 6 6.3 m, although this distance was highly variable
based on the landscape of each site. Seventy-two percent of boats traveled on plane,
while 28% were not on plane.
Field study of wakes generated by boats in Mosquito Lagoon. The height
of waves (Hmax) contacting oyster reefs from boat passes ranged from 0.1 cm to
20.8 cm, with a mean of 3.0 6 0.3 cm. The mean wind speed during boat passes
was 6.9 6 0.3 km/h. The mean number of waves/wake was 14.9 6 0.8. The mean
distance for ‘‘close’’ boat pass trials was 28.7 6 8.8 m (range: 4 - 29.5 m), while the
mean distance for ‘‘far’’ trials was 61.4 6 11.4 m (range: 30 – 135.5 m). For
individual reefs, the mean distances of the far boat passes were approximately
double those of the close passes.
Model selection to determine which of the tested variables was most influential
in driving the observed Hmax results provided additional insights. For the first
model, which included all boat types but eliminated whether the boat was on or off
plane, the most informative run included the variables of boat speed (slope ¼ 0.53
6 0.17; p ¼ 0.003), and distance from reef (slope ¼ -0.60 6 0.17, p , 0.001)
(Figure 2). For this model, the AICc was 328.48 with an AICc weight of 0.31. Our
data did not provide evidence that boat type played a significant role in determining
Hmax (slope¼ -0.11 þ 0.08; p ¼ 0.180). As the speed of the boat increased, the Hmax
of the wake height increased exponentially, and, as the distance from the reef
increased, the Hmax decreased exponentially (Figure 2). This relationship is
described by Equation 1.
Hmax ðcmÞ ¼ e1:92þ0:53*SpeedðmphÞ0:60*DistanceðmÞ ðEq: 1Þ
For the second model, which included whether the boat was on or off plane but
excluded all pontoon data, the most informative run included the distance from the
reef (slope ¼ -0.55 þ 0.19; p ¼ 0.006), the speed of the boat (slope ¼ 1.97 þ 0.44, p
, 0.001), and whether the boat was on plane (slope ¼ -0.61 þ 0.28; p ¼ 0.031)
(Figure 3). Additionally, there was an interaction between boat speed and whether
the boat was on plane (slope ¼ -1.68 þ 0.51; p ¼ 0.001). In this model, the AICc
180 Florida Scientist 84 (2–3) 2021 Ó Florida Academy of SciencesBoat wakes and oyster restoration Walters et al.
Figure 2. Hmax as a function of boat speed and distance for all boat types. Hmax is the maximum height
of the water as recorded with wave gauges during boat passes. Equation 2 describes the relationship
between Hmax, speed, and distance.
value was 246.76 with an AICc weight of 0.32. As with the first model, as the
distance the boat passed by the reef increased, the Hmax of the wake decreased
exponentially (Figure 3A). Moreover, as the speed of the boat increased, the Hmax
of the wake height increased exponentially, but this happened at a steeper rate when
the boat was not on plane, as opposed to when it was on plane (Figure 3B). These
responses can be explained for boats that are not on plane with Equation 2, and for
boats that are on plane with Equation 3.
Hmax ¼ e1:67þ1:97*SpeedðmphÞ0:55*DistanceðmÞ ðEq: 2Þ
Hmax ¼ e1:06þ0:29*SpeedðmphÞ0:55*DistanceðmÞ ðEq: 3Þ
Burial depth of oyster clusters. The mean depth that oyster clusters were
buried on reefs where dead margins were just beginning to form was 32.2 6 2.1
mm. This depth was significantly less than the burial depth (108.2 6 2.8 mm) of
clusters from reference reefs (one-way ANOVA: p , 0.0001). The mean range of
burial depth for reference reefs was 93.7 – 120.5 mm, while in boating channels the
range was 21.2 – 41.2 mm.
Florida Scientist 84 (2–3) 2021 Ó Florida Academy of Sciences 181Walters et al. Boat wakes and oyster restoration
Figure 3. Hmax as a function for boat speed and distance for: A. the whaler and flats boats (excluding
pontoon) while not on plane, and B. while on plane. Hmax is the maximum height of the water as
recorded with wave gauges during boat passes. Equation 3 describes the relationship between Hmax,
speed and distance while not on plane, and Equation 4 describes the relationship between Hmax, speed
and distance while on plane.
Oyster reef restoration: monitoring results. The mean footprint of intertidal
oyster reefs restored in 2007 was 150.0 6 61.4 m2 (range: 39 – 502 m2), with a
total summed restoration footprint of 1050 m2. Reference reefs (mean area: 898.9
6 279.8; range: 147 – 2384 m2) had a total footprint of 6292 m2. All reefs
experienced similar abiotic conditions throughout the monitoring period as all were
in close proximity (1.2 km) (Figure 4). The maximum distance from restored reefs
to other restored reefs, reference reefs to other reference reefs, and restored to
reference reefs was 0.4 km, 1.2 km, and 1.1 km, respectively.
Density of C. virginica on reefs restored in 2007 increased over time, with a
maximum density in the year 2020 of 1053 oysters m2 (one-way ANOVA: p ,
0.0001; Figure 5). In 2016, the highest individual density recorded on a single
oyster restoration mat was 520 individuals. Increases in density were gradual from
2008 through 2013, with an approximate doubling of oysters between 2013 and
2014 (mean per m2: 472 and 862, respectively). Oyster densities increased further
and were similar in years 2015-2016 and 2018-2020, ranging from a mean of 922 to
1053 m2. Only in 2017 was there a sharp decrease in oyster density (Figure 5).
Reference reef density was much more variable than on the restored reefs, ranging
from 112.4 to 794.6 live oysters m2 (Figure 6). Similar to the restored reefs, the
highest years were 2015 and 2020. Also like the restored reefs, the mean density on
reference reefs was low in 2017. Unlike the restored reefs, densities in 2018 were
low (Figure 6).
Six months after deployment, the mean shell height for C. virginica was 46.3
6 1.4 mm. The range was 10 – 105 mm for the 3505 counted oysters. Thus, the
mean shell height was greater than the minimum size known for C. virginica
182 Florida Scientist 84 (2–3) 2021 Ó Florida Academy of SciencesBoat wakes and oyster restoration Walters et al.
Figure 4. Map of central Mosquito Lagoon. Rectangle borders the locations of 91 restored oyster reefs.
reproduction (~35 mm, Kennedy et al. 1996). Likewise, 79 (2.3%) C. virginica
were of harvestable size (76 mm or greater) within 6 months.
The mean shell height for 2007 reefs after 12 years was 37.1 6 1.6 mm, with a
range of 2 – 110 mm. Recent recruitment was documented on these reefs with 239
(13.7%) shell heights at 10 mm or less. Harvestable-sized C. virginica accounted
Florida Scientist 84 (2–3) 2021 Ó Florida Academy of Sciences 183Walters et al. Boat wakes and oyster restoration Figure 5. Mean (6 S.E.) density of live oysters on summer 2007 restored reefs each winter (January – March) starting 6 months post-restoration (2008) through 12.5 years post-restoration (2020). Letters above bars signify monitoring dates that were significantly different at the p , 0.05 level when compared with a Tukey’s a posteriori test. Figure 6. Mean (6 S.E.) denisty of live oysters on reference reefs starting in 2008. Letters above bars signify monitoring dates that were significantly different at the p , 0.05 level when compared with a Tukey’s a posteriori test. 184 Florida Scientist 84 (2–3) 2021 Ó Florida Academy of Sciences
Boat wakes and oyster restoration                                                          Walters et al.

Figure 7. Example of vertical reef profile. Data was collected in May 2007 prior to June 2007 restoration
and then approximately every three years through July 2020.

for 4.9% (86 individuals) of 1750 measured live oysters. On reference reefs
monitored during the same week, the mean shell height was 42.7 6 3.2 mm; 2.1%
were , 10 mm and 3.0% were  76 mm. The range of shell heights on the
reference reefs was 2 – 102 mm. When the mean shell heights of the 2007 restored
reefs were compared to reference reefs in 2019, there was no notable difference
(one-way ANOVA: p ¼ 0.1068).
     The vertical reef profile example (Wonder Reef, Figure 7) depicts the
maximum pre-restoration height of the dead margin (40 cm) followed by much
lower profile heights annually through 2020 (maximum height post-restoration: 16
cm). When the mean maximum heights of the 3 transects of the seven reefs restored
in 2007 were compared to each other and the pre-restoration values from 2007
through 2020, the only notable difference was the mean pre-restoration height of
43.3 (6 7.9) cm (one-way ANOVA: p , 0.0001; Figure 8). All subsequent years
remained similar and lower (20.4 - 29.1 cm).
     The mean height of individual oyster clusters above the sediment (reef
thickness) gradually increased over time from 2010 (94.4 mm) through 2016, to a
mean height of 190.6 mm (Figure 9). From 2017 through 2020, the mean heights of
all reefs were similar to each other and similar to the reef thickness values in 2010-
2012. The results for 2017 through 2020 were notably lower than for 2016 (range:
101.9 – 116.9 mm; one-way ANOVA: p , 0.0001).
     Bridges formed by live oysters physically connecting deployed shells increased
both within and between mats until there were so many that it was not possible to
track individual bridges (Figure 10). Bridges within individual oyster mats were
countable through 2010, while bridges between mats could be enumerated through
2012. After 2010, the individual mats had so many interconnected live oysters that
they were considered one large cluster. In 2013, there were so many
interconnecting live oysters between mats that it was no longer possible to
distinguish the edges of individual mats. The number of bridges within a mat
increased over time from 0.6 6 0.2 bridges after 6 months to 8.4 6 0.7 bridges
within a mat in 2010, with a notable increase each year (one-way ANOVA: p ,
0.0001, Figure 10A). There were no bridges between mats (separated by
approximately 15 cm) after 6 months and 1.0 6 0.3 bridge between mats after
Florida Scientist 84 (2–3) 2021 Ó Florida Academy of Sciences                                      185
Walters et al. Boat wakes and oyster restoration
Figure 8. Comparison of vertical reef profiles (6 S.E.) pre-restoration through 2020 for all reefs restored
in 2007. Letters above bars signify monitoring dates that were significantly different at the p , 0.05 level
when compared with a Tukey’s a posteriori test.
18 months. Numbers increased annually until there were 10.5 6 0.7 bridges
between mats in 2012. This was also a notable increase, with the largest increase
between 2011 and 2012 (one-way ANOVA: p , 0.0001; Figure 10B).
The seagrass Halodule wrightii recruited to four of the seven reefs over the
course of 13 years. Of these four reefs, seagrass was consistently found seaward of
three reefs from 2008 through 2020. The only difference over time for these three
Figure 9. Mean thickness (vertical accretion) of oysters above the sediment in mm (6 S.E.) for reefs
restored in 2007 from monitoring year 2010 through 2020. Letters above bars signify monitoring dates
that were significantly different at the p , 0.05 level when compared with a Tukey’s a posteriori test.
186 Florida Scientist 84 (2–3) 2021 Ó Florida Academy of SciencesBoat wakes and oyster restoration Walters et al.
Figure 10. Mean number (6 S.E.) of live oyster bridges linking deployed shells: A. within a 0.25-m2
oyster restoration mat, and B. between oyster restoration mats linking each mat to four additional mats.
reefs was the distance from the seagrass to the reef edge; in 2008 the mean closest
distance was 1.2 m, while in 2020 it was 3.0 m.
Between the restored reefs and the adjacent shoreline, there was a notable
increase in mean density of C. virginica between 2010 and 2020 (one-way
ANOVA: p ¼ 0.031). Oyster numbers off the reef footprint more than doubled
during this time (2010: 7.4 6 2.1; 2020: 20.9 6 5.2) along 10-m transects.
All sessile invasive invertebrates recorded in the thirty 0.25-m2 quadrats across
all restored and reference reefs each year are reported in Table 2. For the mussel M.
charruana, a total of 40 individuals were recorded, with 2015 being the most recent
year any were observed in Mosquito Lagoon (survey area: 562.5 m2). Perna viridis
(9 individuals) and M. coccopoma (37 individuals) were both observed in most
years from 2008 through 2017. Despite ongoing monitoring, none of these species
were observed on oyster reefs in Mosquito Lagoon between January 2018 and
March 2020.
The numbers of live red mangroves, black mangroves and Brazilian pepper
fruits recorded on the seven oyster reefs restored in 2007 and the seven reference
reefs varied greatly over time (Table 3). In some winters, there were very few loose
Florida Scientist 84 (2–3) 2021 Ó Florida Academy of Sciences 187Walters et al. Boat wakes and oyster restoration
Table 2. Sessile invasive invertebrates recorded during annual monitoring of quadrats on all restored
reefs (thirty 0.25-m2 quadrats/reef) between January and March each year.
Restored Reference Area Mytella Perna Megabalanus
Year Reefs Reefs Monitored charruana viridis coccopoma
2008 7 7 105.0 12 - 8
2009 18 7 187.5 16 2 1
2010 31 7 285.0 1 - -
2011 42 7 367.5 1 1 -
2012 50 7 427.5 - - -
2013 58 7 487.5 - - 13
2014 63 7 525.0 - - 4
2015 68 7 562.5 10 2 -
2016 72 7 592.5 - 3 9
2017 76 7 622.5 - 1 2
2018 81 7 660.0 - - -
2019 85 7 690.0 - - -
2020 91a 7 735.0 - - -
Year refers to year of monitoring. Restored Reefs ¼ number of unique reefs monitored each year. Reference reefs ¼
number of reference reefs monitored each year. Area monitored is the surface area monitored each year in m2 ¼
[(number of restored reefs þ number of reference reefs) * (30 * 0.25 m2)]. Invasive species ¼ numbers of each species
found on reefs by year. a ¼ three original Vexare mesh mats were replaced with biodegradable BESEe oyster
restoration mats in 2020. These three replacement reefs were only included once in surface area calculations for
monitoring.
Table 3. Totals of red (Rhizophora mangle) and black (Avicennia germinans) mangrove propagules (not
attached) and rooted seedlings for the seven reefs restored in 2007 and the seven reference reefs recorded
each winter during annual monitoring (January – March).
Restored Reefs Reference Reefs
R. R. A. A. R. R. A. A.
mangle mangle germinans germinans Schinus mangle mangle germinans germinans Schinus
Year prop. seedling prop. seedling fruit prop. seedling prop. seedling fruit
2008 1 - - - - 17 2 - 2 1
2009 8 - 4 1 13 - - - - -
2010 1 - - - - 5 - - - -
2011 5 - - - - 9 - 5 - 1
2012 6 1 - - 2 - - - - -
2013 18 2 - - - 81 6 9 3 1
2014 4 - - - 5 - 1 - -
2015 48 2 32 - - 136 18 61 6 -
2016 2 5 - - - 12 4 - - -
2017 9 11 1 - - 8 9 - - -
2018 2 - 1 - - - - 1 - -
2019 8 4 3 7 - - - - - -
2020 1 - - - - - - - -
Schinus fruit ¼ the number of clusters of invasive Brazilian pepper Schinus terebinthifolius found during annual
monitoring. Prop. ¼ propagules.
188 Florida Scientist 84 (2–3) 2021 Ó Florida Academy of SciencesBoat wakes and oyster restoration Walters et al.
propagules or rooted seedlings on intertidal oyster reefs, while other years had
larger numbers. Rhizophora mangle was more abundant than A. germinans, and
propagules were much more abundant than seedlings for both species (Table 3).
Eighteen Brazilian pepper fruit clusters were recorded on the oyster reefs between
2008 and 2013 (range in number of fruits in clusters: 1-74).
Discussion
Many pieces of data have been collected that suggest boating activity is directly
associated with shoreline and oyster reef losses (see Bilkovic et al. 2019 for
review). In Mosquito Lagoon, Grizzle et al. (2002) found strong correlations
between locations of dead reefs and boat channels. Garvis et al. (2015, 2020) found
similar patterns there and throughout northeast Florida. Wall et al. (2005) found
larvae of C. virginica settled in similar numbers on dead and live reefs in Mosquito
Lagoon, but survival of new recruits (less than 4 weeks) was much lower on dead
reefs. This result was attributed to greater sediment suspension and localized
movement on the dead reefs, especially the silt/clay fractions. Stiner and Walters
(2008) determined that relative to live reefs, dead reefs had half as many oyster
clusters, significantly reduced habitat complexity, and seventy-five percent fewer
live oysters. In wave tank trials, Campbell (2015) found that waves as small as 2 cm
were capable of moving individuals and clusters of C. virginica once dislodged
from the sediment, and larger clusters were more likely to experience greater
erosion and dislodgement from the sediment.
Our new results provide the missing pieces to connect boat wake activity
directly to dead reef formation in Mosquito Lagoon. First, we documented intensive
boating pressure (11.3 boats/h) around the intertidal oyster reefs with the majority
of motorized boats producing wakes that exceeded 2.0 cm in height (mean wake
height: 3 cm). We additionally documented oyster clusters had minimal sediment
holding them in place if located in a boating channel, making dislodgement more
likely to occur. Combining all of these pieces of information, the process that
transforms a live reef to a dead reef is: 1) wakes exceeding 2 cm suspend sediment
and erode it from the bases of oyster clusters on the seaward edge of an oyster reef,
2) these eroded clusters eventually dislodge and tumble shoreward with additional
wakes, 3) when wakes of sufficient size hit the reef, the loose clusters are pushed up
and land on top of live oysters and then perish if out of the water for long periods of
time, and 4) disarticulated shells from now-dead C. virginica pile up vertically
according to the height of subsequent wakes and move landward, thereby creating a
new seaward reef edge that likewise erodes by the same process. Live oysters in the
mid-reef area become covered by disarticulated shell; many perish as a result of this
coverage. Edge erosion and disarticulated shell wash-over continue until no live
oysters remain, converting a live reef into a reef with a dead margin on the seaward
edge followed by conversion into a dead reef within a few years to decades. Stiner
and Walters (2008) found that dead reefs had compressed widths and steeper slopes
on the seaward edges. Garvis et al. (2015) additionally noted loss of natural reef
area landward of the dead area. Once underway, this process of dead margin
formation moved dead shell signatures toward shore at a rate of 0.9 m/yr (range: 0.1
Florida Scientist 84 (2–3) 2021 Ó Florida Academy of Sciences 189Walters et al. Boat wakes and oyster restoration
to 3.8 m/yr; Garvis et al. 2015), and entire dead reefs moved away from boating
channels (Grizzle et al. 2002). Eventually, the disarticulated shell washes into the
marsh and no reef footprint remains. In CANA, there were over 20 examples of this
type of reef footprint loss in summer 2020. It is important to note that microtidal
Mosquito Lagoon has a tidal range of 10 cm in the area where the reefs of C.
virginica dominate (Walters et al. 2001). A larger tidal range could greatly alter
these dynamics. That, however, does not mean that this process is unique to
Mosquito Lagoon. Similar dead reefs can be found in many locations along the
western Atlantic seaboard (e.g. Garvis et al. 2020).
It can be argued that wind wakes produce the same results as boat wakes, and it
is extremely complicated to disentangle the two (Bilkovic et al. 2019). To relate
boating activity to shoreline erosion, Bilkovic et al. (2019) compared turbidity
values during times of high and low boating activity, and locations of hard-
armoring and high erosion in low-wind energy channels in Chesapeake Bay.
Turbidity, high erosion, and hard armoring were all positively correlated to high
boating activity. Regardless of the wake source, Hmax was the best estimator of
erosion, and as the height of the wake increased, the level of erosion increased.
Nanson et al. (1994) reported similar results to ours with boat wake impacts in the
Gordon River in Tasmania. In our study, two additional pieces of evidence point
toward boat wakes being the primary causative agent of Mosquito Lagoon dead
reefs. First, boating activity has increased greatly in recent decades and increases in
the numbers of boats and dead reefs occurred together. Reefs of C. virginica were
abundant in Mosquito Lagoon in pre-historic times based on consumption and
deposition of shells in midden piles by Timucuan and Ais Native Americans dating
back to approximately 500 BC (Hellmann 2013). Garvis et al. (2015) reported five
small dead reefs in the first year aerial photographs were available for Mosquito
Lagoon (1943); four were located along the Atlantic Intracoastal Waterway, and the
fifth was located near the CANA boat ramp. By 2009, there were 247 dead reefs.
Wall et al. (2005) determined that the rate of new dead margin formation (9%/yr)
was highly correlated to the increase in the number of boat registrations in counties
bordering Mosquito Lagoon over the same time period (10% increase). The rate of
increase in number of dead reefs continued in the national park until our restoration
began in 2007. Although boating registration numbers have leveled off in the
current decade, Florida has the largest number of registered boaters in the USA (FL
FWCC 2020: approximately 1 million registrations/yr). Second, storm-associated
winds did not produce dead margins or dead reefs. Winds over 75 km/h moved ,
1% of loose individual shells on these reefs and dead reefs did not change
significantly in their vertical profiles when three hurricanes impacted the region in
fall 2004 (Walters et al. 2007). This result was attributed to the reefs being
submerged throughout the storms due to intense rainfall and the annual high water
season.
In microtidal, shallow Mosquito Lagoon, the oyster restoration mat
methodology provided a low-profile, boat-wake resilient method designed to
return oyster densities to local reference levels. The density on our reference reefs
was very variable, and in many years, there were actually more oysters on restored
190 Florida Scientist 84 (2–3) 2021 Ó Florida Academy of SciencesBoat wakes and oyster restoration Walters et al.
reefs than reference reefs (Figures 5, 6). Three organisms negatively impacted both
restored and reference reefs to different extents. First, blooms of the brown tide
Aureoumbra lagunensis occurred in Mosquito Lagoon during the summers of 2012,
2013 and from June 2015 – August 2016 (Phlips et al. 2015, Walters et al. 2021).
Densities on reference and restored reefs were not negatively impacted by the first 2
blooms; for both reef types, oyster density remained consistent or increased when
monitored in following winter (Figures 5, 6). The 15-month bloom of A.
lagunensis, however, greatly reduced densities on both restored and reference reefs
when based on monitoring in winter 2017. The restored oyster reefs, however,
rebounded quickly with increased densities within one year, while the reference
reef numbers remained low for another year. Second, the native boring sponge
Cliona celata was first observed on restored oyster reefs in the winter of 2016. The
shallow subtidal seaward edges of some reefs had lost large, live oyster clusters to
these bioeroders. All that remained on these oyster restoration mats were the
crumbling bases of clusters attached to the mesh via cable ties. The remaining bases
were full of bore holes and so brittle that they would have readily been dislodged by
boat or wind wakes. In March of 2016, bagged C. virginica shell (bag dimensions:
0.9 m X 0.3 m X 0.3 m) were deployed around the outer edges of all seven restored
reefs to protect the fragile edge clusters. This effort was successful and restored reef
densities were high again in 2018 – 2020.
Reef thickness, however, should have increased throughout the 13 years of
monitoring to track Mosquito Lagoon sea level rise of 2 cm/yr (Rodriguez et al.
2014, IRL NEP 2020), but on our reefs thickness only increased from 2010 – 2016,
with a large decline in 2017 that remained unchanged through 2020. The reduction
in the thickness of reefs after 2016 was likely the result of boring sponge infections
facilitating breakage of the tallest clusters, but not oyster density. Fortunately, the
number of broken clusters was not large, and these clusters did not start the
formation of dead margins. Instead, these clusters continued growing horizontally
forming living bridges to other oyster clusters on the reef. Third, density differences
between restored and reference reefs were, in part, the result of signage prohibiting
harvesting on the restored reefs and a hesitancy to harvest during brown tide
blooms. In CANA, there was an annual average of 1990 bushels harvested per year
between 2009 and 2013 based on commercial catch logs (Campbell 2015). Oyster
harvesters frequently manually dislodge intertidal clusters, harvest a few
individuals, and then discard the remaining cluster either by throwing it or turning
it upside down and positioning it on top of the sediment. Few rebury the clusters.
This could have a large impact if these loose clusters move with boat wakes and
begin to pile up. Oysters do, however, grow quickly in Mosquito Lagoon. While in
northern Atlantic waters, it can take multiple years for oysters to reach reproductive
size (e.g. Kennedy et al. 1996), this can happen in 6-12 months in Mosquito
Lagoon, promoting the potential for sustainable harvesting at the population level
and in regards to genetic diversity (Arnaldi et al. 2018). Other studies have found
that harvesting, however, can have overall negative effects on oyster reefs (e.g.
Lenihan and Micheli 2000). They found through experimental plots that harvesting
not only reduced the density of oysters on harvested reefs, as would be expected,
Florida Scientist 84 (2–3) 2021 Ó Florida Academy of Sciences 191Walters et al. Boat wakes and oyster restoration
but also reduced the survival of un-harvested oysters on these reefs. Harvesting
levels in Mosquito Lagoon require ongoing management, as other factors, such as
algal blooms, can reduce recruitment of new oysters into the system (Figures 5, 6).
Many organisms in addition to shellfish utilize intertidal oyster reefs in
Mosquito Lagoon. Boudreaux et al. (2006) and Barber et al. (2010) using lift nets
initially documented 149 species of macro-organisms on these reefs. Additional
biodiversity and ecosystem provisioning research focused on Mosquito Lagoon
oyster reef restoration includes studies on infauna (Harris 2019), wading and
coastal birds (Shaffer et al. 2019), and fishes (Lewis et al. submitted). In Table 2,
the abundance of three invasive invertebrates in restored and reference reefs is
reported. No M. charruana was found in Mosquito Lagoon on oyster reefs since
2015 after finding very high localized abundances and genetic admixture a decade
earlier (Boudreaux and Walters 2006, Gillis et al. 2009). Boudreaux and Walters
(2006) found 94 individuals of M. charruana between August 2004 and October
2005 with much less monitoring effort. Observations of P. viridis and M.
coccopoma in Mosquito Lagoon occurred over 9 and 10 years, respectively. No
individuals have been found on ML oyster reefs since 2017 even though sampling
intensity increased over time (Table 2). All three sessile, invasive invertebrates
have negative impacts on C. virginica (Yuan et al. 2016). It is unclear whether
natural larval dispersal or anthropogenic sources brought these three invaders to
Mosquito Lagoon from port locations in Florida (Spinuzzi et al. 2013). Hull
fouling, live wells, ballast tanks and aquarium dumping are all human-mediated
vectors for transporting invasive species (e.g. Carlton 2001, Wasson et al. 2001,
Walters et al. 2006). Most of the Mosquito Lagoon reefs harboring these invasive
species were within 1 km of the boat ramp in the north district of CANA or were on
the most commonly used route that links the CANA ramp to the Atlantic
Intracoastal Waterway. An additional invasive invertebrate, the Indo-Pacific
swimming crab Charybdis helleri, thought to have invaded Florida via ballast
water, has also been found on Mosquito Lagoon reefs (Searles et al. 2019).
Unexpectedly, we documented large numbers of plant propagules/seeds and
seedlings on many reefs in Mosquito Lagoon (Table 3). Both invasive Brazilian
pepper (S. terebinthifolius) fruits and native mangrove propagules were found on
reefs of C. virginica in most years (Table 3). No S. terebinthifolius seedlings were
observed, and this is not surprising as seeds must strand above the intertidal zone
for germination to occur (Donnelly and Walters 2008). If fruits are pushed above
this zone on dead reefs, germination can and has occurred. Recruitment of both red
(R. mangle) and black (A. germinans) mangroves occurred on both restored and
reference reefs and is becoming more common on oyster reefs throughout Mosquito
Lagoon, with occurrences positively related to warmer winter temperatures
(McClenachan et al. 2021). In fact, McClenachan et al. (2021) found a 103%
increase in mangrove cover on oyster reefs over 74 years (1943-2017), with the less
cold-tolerant R. mangle primarily increasing in abundance since 1984. This same
pattern of poleward expansion of mangroves and overgrowth has been documented
in this region for saltmarshes (e.g. Osland et al. 2013, Steinmuller et al. 2019). Not
all reefs, however, have established mangroves in spite of similar hydrology, fetch,
192 Florida Scientist 84 (2–3) 2021 Ó Florida Academy of SciencesBoat wakes and oyster restoration Walters et al.
and salinity to mangrove-dominated reefs, so it is unclear what will happen on these
reefs in coming decades. Historically, it is thought that oyster reefs formed the base
for many mangrove islands in southwest Florida, with some mangrove islands
forming on top of oyster and vermetid reefs during the Holocene sea level rise
deceleration (Parkinson 1989) as well as on Native American shell middens
comprised of disarticulated bivalve shells (Schwadron 2010).
Our restoration has been considered very successful with high densities of
oysters present 12.5 years after deployment that improve water filtration in the
ecosystem. Numerous other metrics additionally suggest success of this project.
McClenachan et al. (2020) recently published a cost-free method to examine the
cumulative impact of oyster reef restoration on shoreline erosion and accretion. 44
restored patch reefs from Mosquito Lagoon, including the seven reefs described
here from 2007, were used in this case study, and they found the rate of change at
-0.03 m/y pre-restoration, followed by a rate of 0.06 m/y post-restoration. Thus,
adjacent shoreline erosion changed to accretion with patch oyster reef restoration.
Combining the impact of all these small oyster reef restoration efforts created 288.9
m2 of new shoreline in Mosquito Lagoon and likely accounts for the increase in
oyster numbers landward of the reef footprint. Arnaldi et al. (2018) reported that
genetic diversity of restored and reference reefs in Mosquito Lagoon were
genetically similar within one month of deployment due to the diversity of the
larval pool. Additionally, as of October 2020, no dead margins or reefs have
reformed on any of the seven reefs restored in 2007. Within the boundaries of
CANA, only two dead reefs remain. Neither were restored due to their importance
for navigation. Traveling north from the park boundary, dead margins and dead
reefs become more frequent once passing out of the restoration region. Garvis et al.
(2015) reported that the loss of natural reef area landward of dead reefs had
occurred and restoration could possibly protect these live areas. Our restoration
corroborates this assertion with live oyster numbers nearly tripling landward of the
restoration footprint (7 to 21 live oysters/10 m transect after 10 years). This would
likely be from a combination of reduced disarticulated shell coverage, enhanced
water flow over the entire reef, dissipation of turbulent energy, and sediment
deposition plus stabilization (e.g. Kitsikoudis et al. 2020). Sediment stabilization
also likely promoted long-term (13 yr) seagrass recruitment on restored reefs. The
seagrass Halodule wrightii is the most widely distributed seagrass in the IRL
(Morris et al. 2021). While this seagrass has a broad salinity tolerance (5 – 80 ppt),
turbidity hinders survival of this and all IRL seagrass species. Acreage of all IRL
seagrasses has greatly declined in recent years (Morris et al. 2021), so the resilience
of H. wrightii adjacent to three of our reefs restored in 2007 suggests a positive
influence of restoration on the seaward edges of reefs.
Since 2007, many practices have changed within the restoration community.
Structures designed to recruit oysters are now frequently deployed for their
breakwater potential rather than primarily to recruit and promote optimal growth of
C. virginica (e.g. Morris et al. 2019). Our low-profile oyster restoration mat design
placed only on historic reef footprints is an exception to this with the primary goal
being enhancement of filter feeder densities and acreage. Another important change
Florida Scientist 84 (2–3) 2021 Ó Florida Academy of Sciences 193You can also read