Brand Building through Innovation & Technology - Leader in Lifestyle Kitchen Products - Acrysil Limited
←
→
Page content transcription
If your browser does not render page correctly, please read the page content below
Leader in Lifestyle Kitchen Products

 Brand Building through
 Innovation & Technology

                                       Investor Presentation
                                              August 2022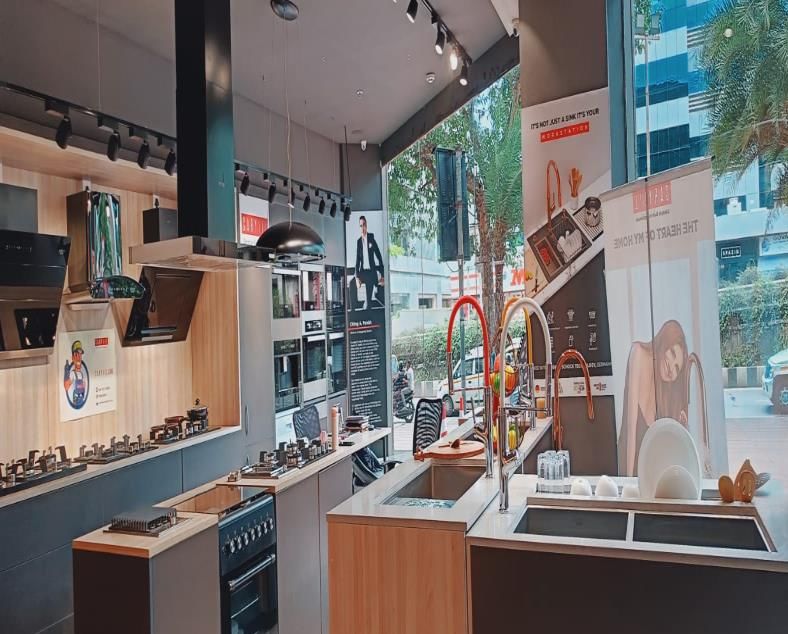
Safe Harbor

This presentation and the accompanying slides (the “Presentation”), which have been prepared by Acrysil Limited. (the “Company”), have been
prepared solely for information purposes and do not constitute any offer, recommendation or invitation to purchase or subscribe for any securities, and
shall not form the basis or be relied on in connection with any contract or binding commitment whatsoever. No offering of securities of the Company
will be made except by means of a statutory offering document containing detailed information about the Company.

This Presentation has been prepared by the Company based on information and data which the Company considers reliable, but the Company makes no
representation or warranty, express or implied, whatsoever, and no reliance shall be placed on, the truth, accuracy, completeness, fairness and
reasonableness of the contents of this Presentation. This Presentation may not be all inclusive and may not contain all of the information that you may
consider material. Any liability in respect of the contents of, or any omission from, this Presentation is expressly excluded.

This presentation contains certain forward looking statements concerning the Company’s future business prospects and business profitability, which
are subject to a number of risks and uncertainties and the actual results could materially differ from those in such forward looking statements. The risks
and uncertainties relating to these statements include, but are not limited to, risks and uncertainties regarding fluctuations in earnings, our ability to
manage growth, competition (both domestic and international), economic growth in India and abroad, ability to attract and retain highly skilled
professionals, time and cost over runs on contracts, our ability to manage our international operations, government policies and actions regulations,
interest and other fiscal costs generally prevailing in the economy. The Company does not undertake to make any announcement in case any of these
forward looking statements become materially incorrect in future or update any forward looking statements made from time to time by or on behalf of
the Company.

                                                                                                                                                   2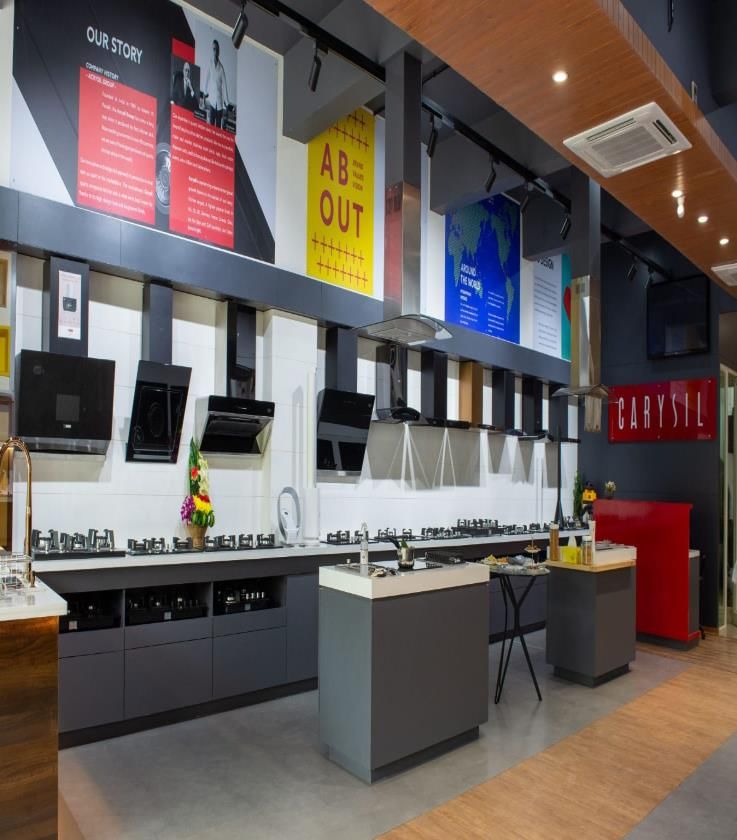
Q1 FY23 Highlights
Message from Chairman & MD

               Commenting on the Results, Mr. Chirag Parekh, Chairman & Managing Director said, “We have continued to embark on our
               growth journey despite rising inflation and ongoing geo-political tensions. We have clocked total income growth of 73% YoY &
               22% QoQ. Our total income growth was attributed to strong growth in domestic markets and healthy order book in exports
               market supported by entry into newer geographies.
               Recent marketing campaigns coupled with increased dealer network has facilitated growth in domestic market while we continue
               to maintain decent order book for exports. Our partnership with Ikea has further strengthened with IKEA doubling our current
               supply. Additional production and supplies started in July, 2022. This extension of order by IKEA is a testament of our commitment
               to meet scheduled delivery and product quality standards. We are continuously striving towards building new partnerships and
               tie-ups in International markets.
               The company has completed capacity expansion of 160,000 units of quartz kitchen sinks and commercial production commenced
               from 28th June 2022 onwards. This additional capacity shall enable us to serve demand from domestic as well as international
               market.
               With our belief of nurturing localization, we have collaborated with famous Bollywood celebrity Vaani Kapoor for branding and
               promotion activities which has enhanced the visibility and translated into favourable response for our lifestyle kitchen products.
               The acquisition of Tickford Orange limited, holding company of its operating subsidiary Sylmar Technology Limited, have
               strengthened our presence in UK market and opened new channels for selling our kitchen sinks. We are in process on integrating
               the same and are confident of realizing synergies from the same in coming quarters.
               At Acrysil, we believe that with our vast product range, recent acquisition, additional capacity and enhanced focus on domestic
               sales, we are confident of maintaining growth momentum in the business. We believe in innovating and providing differentiated
               products to our end customers. Our endeavour is to make Acrysil an undisputed leader in lifestyle kitchen products and conquer
               newer geographies.”

                                                                                                                                           4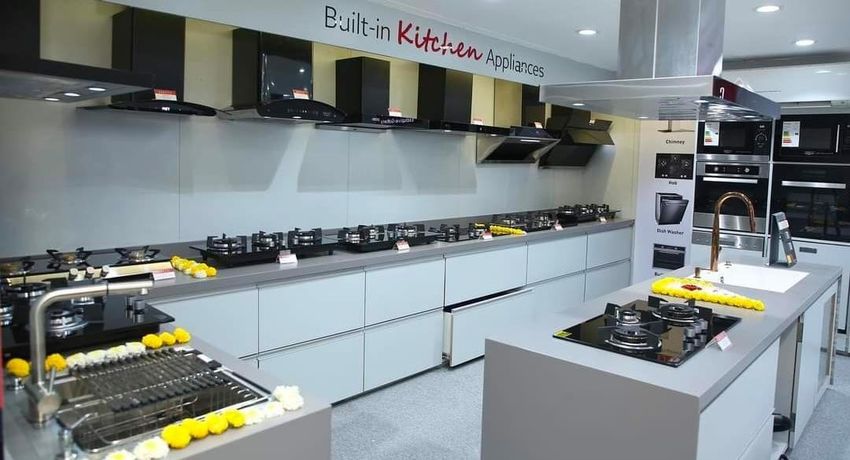
Q1 FY23 Highlights: Sustained Momentum in Business

                                                                                               Exports* business has increased by 25% YoY
Domestic business has increased by 117%
                                                                                               to Rs. 100 crores for Q1 FY23 contributing
YoY to Rs. 38 crores for Q1 FY23 contributing   Company Increased dealer network in                                                                   Company’s order to IKEA for supply of
                                                                                               72%     of the revenue. Company has
22.2% of the revenue. Company has               domestic market from 1,500 to 1,880                                                                   Quartz kitchen sinks has been doubled.
                                                                                               strengthened its presence in newer
witnessed substantial demand in domestic        dealers during Q1 FY23 and plans to increase                                                          Production and supplies of additional order
                                                                                               geographies of Australia, New Zealand,
market and going ahead, expect momentum         by ~3,000 by end of FY23                                                                              started in July 2022
                                                                                               Singapore, Vietnam, Gulf countries and
to continue in domestic market
                                                                                               other South East Asian countries

Capacity expansion of 160,000 units of
quartz kitchen sinks completed in June 2022.                                                   Our exports order book continues to be at
The total manufacturing capacity now stands     EBITDA margin for the quarter stood at         normal levels with sustained uptick in
at 10,00,000 units p.a. Commercial              20.1%. Margins in core business continue to    demand for our products. However, exports               Owing to stabilisation of freight costs and
production commenced from 28th June             remain at similar levels as compared to Q4,    sales may witness some moderation in Q2                 softening of input costs, we expect to
2022                                            however, blended margins appear lower on       FY23 owing to macro challenges and                      maintain healthy margins and profitability
                                                account of       consolidation of Sylmar       revenge travel trends in Exports market.
Further, board has approved 3 MW Solar                                                                                                                 going forward
                                                Technology Limited, which had lower
plant to be set up in Bhavnagar, Gujarat for    operating margins                              On a full year basis, company will continue
captive use. This is in addition to existing                                                   to witness healthy growth in overall business
0.44 MW solar power plant

                                                                                                                                 *STL which got consolidated from Q1 FY23, is excluded from exports revenue

                                                                                                                                                                                               5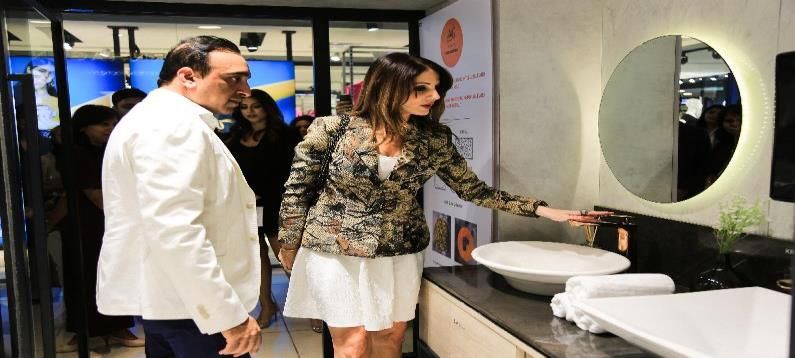
Consolidated: Q1 FY23 Performance
Rs. Crores
                   Total Income* (Rs. Crs)                                                      EBITDA^ (Rs. Crs)                                                    PAT After MI (Rs. Crs)

                                                                                                                          34.4                                                                          18.7
                                                    171.3                                                       31.3                                                                  16.4
                                 141.0                                                        23.5                                                                   13.5
                99.3

              Q1 FY22          Q4 FY22             Q1 FY23#                                 Q1 FY22         Q4 FY22     Q1 FY23#                                   Q1 FY22         Q4 FY22         Q1 FY23#

                                               Domestic Revenue (Rs. Crs)                                              Exports Revenue **(Rs. Crs)

                                                                               38.0                                                        110.9
                                                                                                                                                           100.1
                                                                   28.0                                                     80.1
                                                    17.5

                                               Q1 FY22          Q4 FY22       Q1 FY23                                    Q1 FY22         Q4 FY22         Q1 FY23

      *Incudes gain / (loss) on Foreign Exchange    ^Excludes ESOP expenses    # Consolidated STL from Q1FY23             **STL which got consolidated from Q1 FY23, is excluded from exports revenue

                                                                                                                                                                                                               6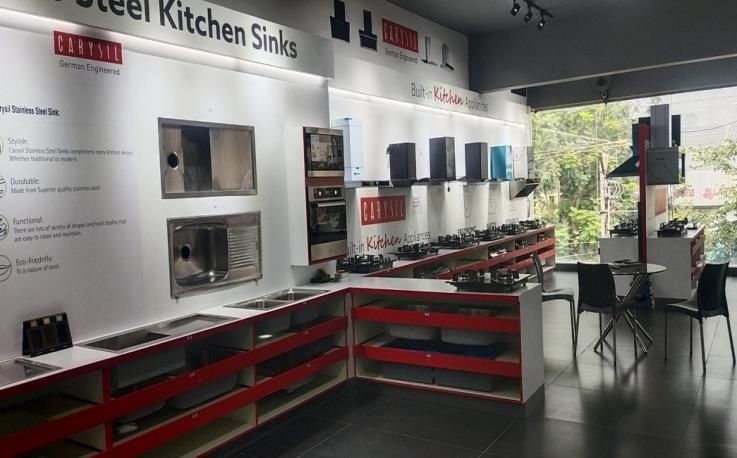
Consistent Growth
Rs. Crores
Quartz Sink Volumes* (Units in ‘000s) Other Volumes* (Units in ‘000s) Total Income
Steel Sink Kitchen Appliances & Others**
650 153
492
117 48 +22.1%
114
413 103
387 91 316
346 51 45 280
300 43 252
267 67 36
181 197
23 171
170 105 41
60 66 69 12
44 55
29
FY17 FY18 FY19 FY20 FY21 FY22 Q1FY23 FY17 FY18 FY19 FY20 FY21 FY22 Q1FY23 FY17 FY18 FY19 FY20 FY21 FY22 Q1 FY23#
EBITDA PAT After MI Cash PAT After MI
116 83
65
+34.4%
+51.9% +43.4%
72 52
39
51
41 34
34 22 26 25
26 26 17 19
19
12 14
8
FY17 FY18 FY19 FY20 FY21 FY22^ Q1 FY23^ FY17 FY18 FY19 FY20 FY21 FY22 Q1 FY23 FY17 FY18 FY19 FY20 FY21 FY22 Q1 FY23
**Kitchen Appliances & Others: Includes FWD/Faucets/Tapa, Sterhagen, tiles & Others *India Volumes # Includes sales from STL ^Excludes ESOP expenses
7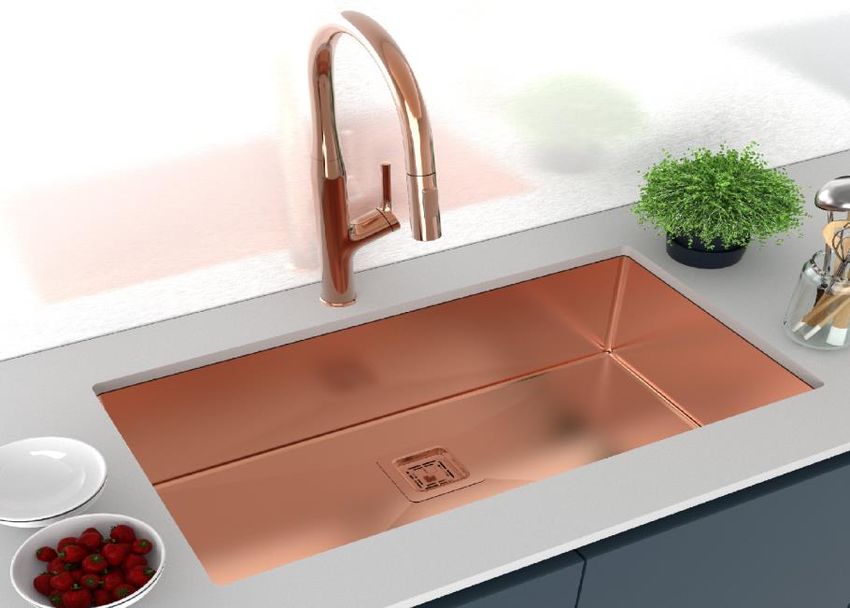
Revenue Mix
                Geography-wise Revenue                            Product-wise Revenue
                                                                                     Q1 FY23

 Export*                                                                                       61%
                                         28%
                                                                         19%
 Domestic
                                               72%                           9%
                                                                                    10%

                                                        Quartz Sink                          Steel Sink
                                                        Appliances & Others                  Solid Surface Worktops

           5%
                                                                                         FY22
                   95%

                                                                               9%

                             Strengthening                                    14%
                                                                                                       77%

                             ‘Carysil’ Brand
                                                                Quartz Sink         Steel Sink        Appliances & Others
                                                     *STL which got consolidated from Q1 FY23, is excluded from exports revenue

                                                                                                                 8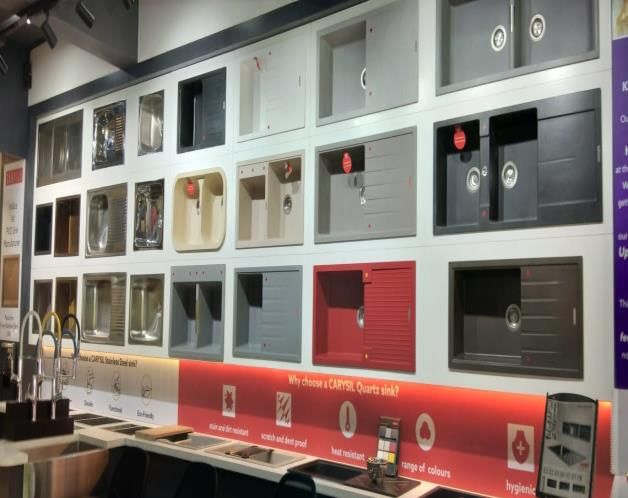
Consolidated Profit & Loss
 Particulars (Rs. Crs.)              Q1 FY23   Q1 FY22   Y-o-Y   Q4 FY22   Q-o-Q
 Revenue                              171.3     97.5              138.9
 Gain / (Loss) on Foreign Exchange     0.0       1.8               2.0
 Total Income                         171.3     99.3     73%      141.0    22%
 Raw Material                          89.8     43.6               58.1
 Employee Expenses                    10.4       6.2               8.7
 Other Expenses                       36.7      26.0              42.8
 EBITDA                                34.4      23.5    46%       31.3    10%
 EBITDA Margin (%)                    20.1%     23.7%             22.2%
 ESOP expense                          0.7       0.6               1.1
 Other Income                          0.1       1.0               0.2
 Depreciation                          6.0       3.6               5.0
 EBIT                                  27.9      20.4    37%       25.4    10%
 EBIT Margin (%)                      16.3%     20.5%             18.0%
 Finance Cost                          3.0       1.9               3.4
 Profit Before Tax                    24.9      18.4     35%      22.0     13%
 Tax                                   6.1       4.9               5.5
 Profit After Tax                     18.8      13.5     39%      16.5     14%
 PAT After Tax Margin(%)              11.0%     13.6%             11.7%
 MI                                    0.1       0.1               0.2
 PAT After MI                         18.7      13.5     39%      16.4     14%
 PAT After MI Margin(%)               10.9%     13.5%             11.6%

                                                                                   9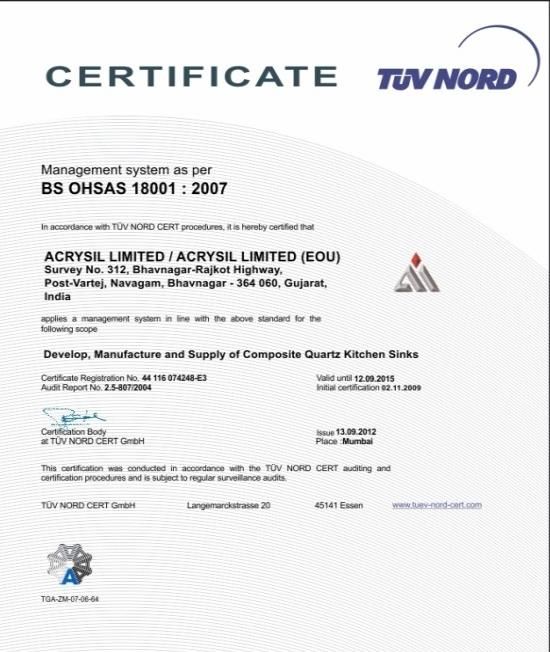
Standalone Profit & Loss
  Particulars (Rs. Crs.)              Q1 FY23   Q1 FY22   Y-o-Y   Q4FY22   Q-o-Q
  Revenue                              108.4     78.7             110.9
  Gain / (Loss) on Foreign Exchange     0.0       1.7              1.9
  Total Income                         108.4     80.4     35%     112.9     -4%
  Raw Material                         46.3      34.7              43.2
  Employee Expenses                     6.6       4.3              6.5
  Other Expenses                       31.3      22.8              38.0
  EBITDA                               24.2      18.6     30%      25.2     -4%
  EBITDA Margin (%)                    22.3%     23.1%            22.3%             Other income for
                                                                                     Q1FY22 includes
  Esop Expenses                         0.5       0.4              0.8
                                                                                   dividend of Rs. 4.44
  Other Income                          0.1       5.3              0.2               Crores received
                                                                                   from UK subsidiary
  Depreciation                          5.2       3.4              4.7
  EBIT                                 18.6      20.1     -7%      19.9     -6%
  EBIT Margin (%)                      17.2%     25.0%            17.6%
  Finance Cost                          2.1       1.8              3.0
  Profit Before Tax                    16.6      18.3     -10%     16.9     -2%
  Tax                                   4.2       4.1              4.4
  Profit After Tax                     12.3      14.2     -14%     12.5     -2%
  PAT After Tax Margin(%)              11.4%     17.7%            11.1%

                                                                                            10
Capex Update
Capacity Expansion of Quartz Kitchen Sinks Capacity Expansion of Stainless
Steel Sinks
Capacity Expansion Capex Expansion of Capex Expansion of Capex Expansion of
of 100,000 units Additional 140,000 Additional 160,000 Additional 200,000 Capacity Expansion
announced in
200203
units announced on
: 202003
units announced on units announced on of 90,000 units of
February 2021 28th June 2021 30th August 2021 11th November 2021 Stainless Steel Sinks
▪ Capacity Expansion of ▪ Capacity Expansion of ▪ Further Expansion of ▪ The Company is
100,000 units was ▪ Further Expansion of
140,000 units was production capacity doubling production
completed and production capacity
completed and by an additional capacity of stainless
commercial by an additional
commercial 160,000 units p.a steel sink from the
production 200,000 units p.a at
production completed. Taking 90,000 units p.a to
commenced from 14th Bhavnagar taking
commenced from 25th the overall capacity 180,000 units p.a.
June 2021 the overall capacity
October, 2021 to 1,000,000 sinks to 1,200,000 sinks ▪ Proposed capex of ~
▪ The manufacturing ▪ The manufacturing ▪ Commercial Rs.11 crores
▪ Proposed capex of
capacity of Quartz capacity of Quartz production ▪ Commercial production
~Rs. 30 crores
Kitchen Sinks has Kitchen Sinks has commenced from expected to commence
increased from increased from 28th June, 2022 ▪ Project likely to be
by end of September,
600,000 units to 700,000 units p.a. to completed by Q3
▪ Capex of ~ Rs. 38 2022
700,000 units p.a. 840,000 units p.a. FY23
crores
▪ Capex of ~ Rs.30 ▪ Capex of ~ Rs.15
crores crores
11Company Overview
Numero Uno Position

    Only                                                          Introduced                         Certification for
    Manufacturer with Schock                                      Physical Vapor Deposition (PVD)
    Technology (Germany)                                          Technology                         ISO 9001:2015, ISO 14001:2015
     In Asia in Quartz Sink                                       For metallic finish of stainless   ISO 45001:2018
                                                                  steel sinks

                                                                                                     PAN India presence
     Quartz Sink Capacity                                         Exports                             1,880 dealers,
     10,00,000* sinks per annum                                   55+ countries worldwide             80+ Galleries,
                                                                                                      82+ Distributors

                                                                  State of art Showroom cum
      Brands                                                                                         Exclusive product galleries
                                                                  Experience center in Ahmedabad
     “CARYSIL” & “STERNHAGEN”                                     & Mumbai                           for ‘Carysil’

  * 1,60,000 units of capacity expansion completed in June 2022

                                                                                                                                     13
Products with Global Standards sold in 55 Countries
Company presently exports to over 55 countries. Plan to expand further by acquiring new customers and penetrating
in new geographies
✓ We have strengthened our
presence to newer
geographies – Australia,
New Zealand, Gulf
countries, Southeast Asia,
China, Singapore, Turkey,
Vietnam
✓ Witnessing huge traction in
business from these
geographies
Map not to scale. All data, information and maps are provided “as is” without warranty or any representation of accuracy, timeliness or completeness
14Our Distribution Model
International Domestic
Significant Presence in UK Strong Foothold in India
Market
1,880 Dealers 65 Franchise Shop 85 Galleries
STRATEGIC Acquisition of
Acquisition of ‘Tickford Orange Limited’, holding 82 Distributors
Homestyle Products Limited company of its operating subsidiary 5 Offices
(now known as Acrysil Products ‘Sylmar Technology Limited’
Limited - A kitchen products By Acrysil UK with 100% stake
distribution company) (Acrysil UK, wholly owned Domestic Revenue
with 100% Stake subsidiary of Acrysil Ltd.)
Rs. In Crores
97
High Demand of
Outsources and sells it to the Top Manufacturer, distributor & customizer of solid Modular Kitchen 74 73
Customers surface products for kitchen & bathroom 65 65
& 54
Consumer Preference 38
Key Alliances with partners in USA, Long standing client base with leading high
street names like Selco, Homebase, Hafele, towards adding
Israel, Denmark &Germany
Magnet, Moores, Fairline Aesthetic Value to
the Kitchen
FY17 FY18 FY19 FY20 FY21* FY22 Q1
Increase in Market Presence and Gain access to customer base opening FY23
Visibility up cross selling opportunities *Q1FY21 performance was impacted by lockdowns induced due to 1st wave of Covid-19
15Acrysil – Over the Years
2022
Acrysil started
its first Acquisition of
international
Launched 2021 Tickford
Kitchen
subsidiary in Orange
Appliances in Commenced Limited,
Germany – the Domestic 2020 supplies of holding
Acrysil GmbH. Market under Quartz sinks to company of
the brand name IKEA its operating
Started CARYSIL 2019 Incorporation
subsidiary
commercial of a Wholly Listing of Equity Sylmar
Production of owned Shares of the
Stainless steel 2017-18 Entered into an Subsidiary Company on
Technology
sinks through agreement for Limited
(WOS) “Acrysil NSE
its subsidiary Supply of USA Inc”.
Incorporated in The company 2017: Launch of
collaboration formed 100%
Acrysil Steel Pvt 2014 Sternhagen
Quartz Kitchen
Capacity
Capacity
Acrysil began its Ltd. Sinks with Expansion of
with Schock & co Export brand and Capacity Expansion of
focus on exports of Leading the Quartz
Gmbh and Oriented Unit State of art Expansion of the Quartz sinks
started
Quartz Sinks 2013 German Brand the Quartz to 840,000 units
sinks to
2004-05 experience 10,00,000
“Grohe” sinks to half a
manufacturing Acquisition centre cum units
Composite million. Announced
2010-11 of UK based showroom in
further Capacity
Quartz Sink Company Ahmedabad & Doubles
Homestyle Mumbai Installation of Expansion of supply of
2004 Products PVD plant. Quartz sinks by Quartz
Limited 2018: Technical 360,000 units Kitchen sinks
Tie-up with to IKEA
1993 Nextship, a
Hungarian Increased
Company for dealer
1987 manufacturing network from
of Composite 1,500 to
Tiles 1,880 pan
india
16Pillars of Integrated Business
Manufacturing
Facilities & Distribution Network
Brand Product Basket
Technology Gallery
• Quartz Sinks: 10,00,000 pa* , • The acquisition of 100% stake in a
• Brand promotion on TV and in print, Stainless Steel : 90,000 pa and • Offers a wide range of cutting
distribution company : Homestyle
along with exposure through Appliances : 7,000 pa edge technology products to
Product Limited, in UK which
sponsorship of events like Times Food customers based on their needs
outsources sinks and sells to the
and MasterChef Australia • Enjoy in-house capability extends top customers
to manufacturing and assembling • Continue to hold the market's
• Introduced a new top-of-the-line chimneys, hobs, hob-tops and food attention with new product
• Another acquisition in UK : Tickford
brand titled 'Tek Carysil’, featuring waste disposers categories, new launch events,
Orange Limited, holding company
kitchen sinks, faucets and appliance new technologies, and new models
of its operating subsidiary ’Sylmar
that represent a revolution in design, • Technology: Only company in India Technology’. Leading player in UK
style and quality and Asia and among 4 companies solid surface market
globally to have the technology to
• Vision is to build global brands manufacture Quartz Sinks with • Vital access to key customers based
Schock Technology in markets in Europe and UK
• Current Domestic Market : ~1,880
Dealers, ~85 Galleries & 82
distributors
* 1,60,000 units of capacity expansion completed in June 2022
17Board of Directors
Mr. Chirag A. Parekh Mr. Jagdish R. Naik
Chairman and Managing Director Independent Director
He holds a BBA Degree from premier ' European University’ A Chartered Accountant, was a partner of a reputed Accounting firm - M/s
After joining the company in 1993, he successfully steered it to become one S.V. Ghatalia & Associates for more than 9 years . Presently, he advises many
of the leading brands increasing the turnover from Rs. 3.5 Crores in 1993 to companies on corporate matters. He is a Corporate Advisor to Excel
Rs. 310 crores in 2021. He heads the company as the managing director since Industries Limited, Transpek Silox Industry Limited and Shah Granites Group
2008 of Companies
Dr. Sonal Ambani Mr. Pradeep Gohil
Independent Director Independent Director
A Ph.D in business management and an MBA in marketing and finance A highly qualified professional, has been associated with various
She also holds two patents granted in the US, namely, 'Systems and Method organisations. He is also associated with the Rotary Club, Bhavnagar. He has
for providing Financial Services to children and teenagers' and ' Purchase experience in the field of chemical engineering for more than 35 years
management system and electronic receipts’
Mr. Ajit Sanghvi Mr. Rustam Mulla
Independent Director Independent Director
LLB, Advocate and he has been involved in a wide spectrum of legal practice
A Chartered Accountant, has extensive experience in financial service over the last 20 years. He is a Founding Partner at M/s Desai Desai Carrimjee
industry and stock broking. He serves as a director of Sterling Consultancy & Mulla (DDCM)-Advocates & Solicitors, Mumbai. His core areas of practice:
Services Pvt. Ltd., Hrisal Investment Advisors Pvt. Ltd., MSS Securities Pvt. Corporate Law, Property & Realty Laws, Dispute Resolution, arbitration and
Ltd. And Harileela Investrade Pvt. Ltd. commercial Litigation .
18Awards & Certifications
FGI’s Award for ‘Best Exports IPF Fastest growing Manufacturing
Performance & Promotion’ Company Award
03 04
If Design Award to
Sternhagen SaniQ kristall Certificate for ‘Best CSR
wash basin 02 05 practices’ by Rotary Club
Award Certificate for 01 06
Manufacturing Innovation &
Design
FGI’s Award for ‘Good
Industrial Relations’
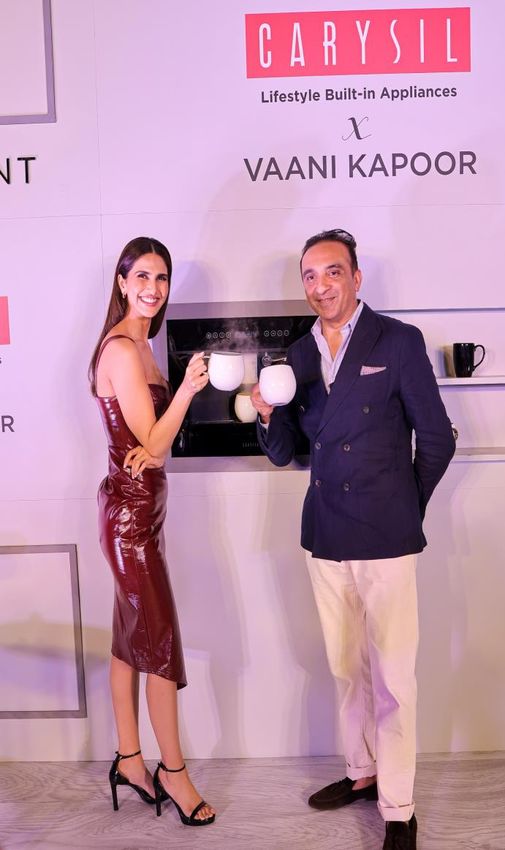
19Marketing campaign for ‘Carysil’ Brand
➢ Acrysil has signed Bollywood celebrity ‘Vaani Kapoor’ for new marketing campaign #TheHeartofMyHome for its ‘Carysil’ Brand
➢ Under the ‘Carysil’ brand, company sells lifestyle kitchen sinks and built-in appliances
➢ Campaign #TheHeartofMyHome unveils a new range of built-in appliances that showcases the cutting edge innovation and design that
Carysil has always pioneered
➢ The association of Vani Kapoor will help the company to strength its brand position and create a brand recall for lifestyle products
among the youth in the domestic market
➢ The Company has always emphasized on the importance of manufacturing high quality new age products which are targeted towards
meeting the increasing demand of quality and aesthetics
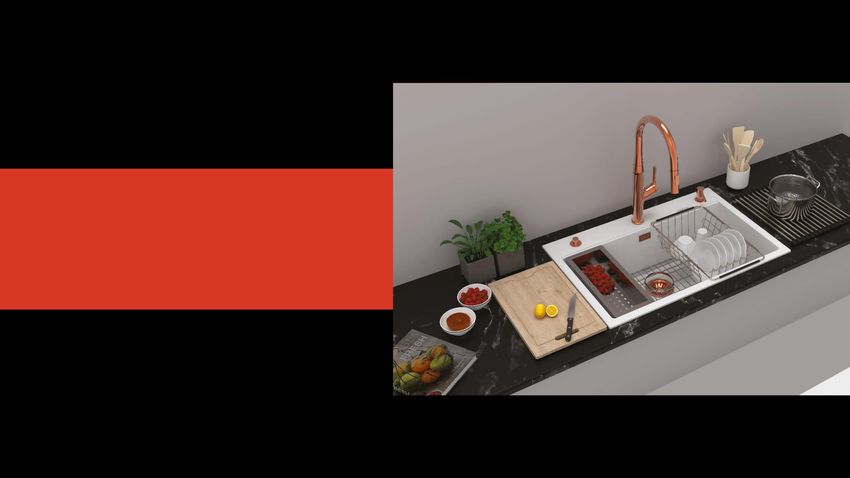
20Increasing Product Portfolio
Sinks
Kitchen
Appliances
Product Segment
Bathroom Suite Bath Fittings
21Sinks
Only Company to make Quartz Sinks in Asia with German Technology
                          Only Company                                                                                     Different Models
                                                                                Plant Capacity                                                                           Many Outlets
                              in Asia

        The only company in Asia and
                                                                 4 plants having a combined                      Developed more than 150+                    The brand is available in
          among a few companies
                                                                    capacity of 10,00,000*                       models to cater to various                   1,880 outlets, and is a
         worldwide: manufacturing
                                                                     Quartz kitchen sinks                          segments and markets                    preferred choice of builders
        quartz kitchen sinks to global
                                                                  annually. Further increase                                                                  and Modular Kitchen
                standards of
                                                                 of 2,00,000 units in progress                                                               Studios in the premium
        quality, durability and visual                                                                                                                              segment
                   appeal

                           Capacity of Quartz Sinks (per annum)
                                                                                                     1,200,000                                                                Longevity of
                                                                                                                        High Margin               Asset Turnover
                                                                                                                                                                             Assets Moulds
                                                                                                     2,00,000             Product                    ~3 times
                   Addition                                                                                                                                                    ~15 years
                   Existing

                                                                                                                               Huge Market Potential for Quartz Sinks
                                                                                                     1,000,000
                                                                                           840,000
                                                                                                                       “Globally there are only 4 players producing Quartz Sinks with schock
                                                                                 600,000
                                                           400,000
                                                                      500,000                                       technology. 80-85% of the industry makes use of Stainless Steel and only 8-
                          250,000    275,000    325,000                                                                                   10% makes use of Quartz Sinks”
              220,000

                2010        2011       2013       2015       2017      2020       2021      2022       2023
 * 1,60,000 units of capacity expansion completed in June 2022

                                                                                                                                                                                                  23
Stainless Steel Sinks – Quadro Sinks the Focus Area
Stainless-Steel Sinks
Contribution: 10% to Consolidated revenue*
Production Capacity
90,000 sinks per annum^
Target Market for Quadro (Designer) Sinks
Caters to high end segment who are willing to pay a premium for
superior quality, design and finish
Innovation
New innovative products like Micro Radius and Square
Sinks
Acquisition of a distribution company
In the UK will help selling to the top customers in that
country ; boosting exports
* Q1 FY23 Consolidated Revenue ^ Expansion of additional 90,000 units is expected to commence by September 2022
24Kitchen Appliances
Kitchen Appliances – Multifold Growth Opportunity
                              Chimneys         Dish Washer        Cook Tops                Built in Ovens
Product Portfolio

                             Wine Chillers                       Cooking Range           Micro Wave Owens                      Currently
                                                  Hoods                                                                    contributing ~5%
                                                                                                                           to the Revenue*

               Manufacturing and Trading of                                            Poised to become a significant player in the
                       Appliances                                                               overall Kitchen Segment:

                      Expansion of            Edge over Price,
                    Appliances Range            Quality and
                                              Delivery Fronts      “People are looking to give personality to their kitchens and bathrooms through
                                                                                       use of OUR Appliances and Products”
                      Constant Innovation,
                    Research, Development &
                             Design                                                                                         * Q1 FY23 Consolidated Revenue

                                                                                                                                              26
Bath Segment
Bath Segment – Synergetic Move to Leverage Quartz Technology
                               FUNDAMENTALS OF THE BUSINESS

                                                                                                                                   ▪ Brand owned by Acrysil’s Wholly owned
                                                                                                                                     Subsidiary in Germany, ‘Acrysil GmbH’

                                                                                                                                   ▪ 60+ Showrooms & SIS for displaying the
                                                                                                                                     products
    Product                                   Range of
                        Branding                                     Synergy             Innovation           Achievements
    Details                                   Products

                                                                 Synergy in Quartz
                                                                                         Developed full
                                                                  Sink Technology
  Sternhagen        Launched its luxury                                               bathroom concepts        Achieved many
                                                                      helped in
 washbasins are      brand Sternhagen      Premium Sanitary                             and will shortly        international
                                                                     developing
made from Sani-Q,   via its wholly owned     Ware, Fittings,                           launch the whole       awards including
                                                                    patented high
  designed by        German Subsidiary      Highlighter Tiles                         range of bathroom      prestigious Red Dot
                                                                quartz material to
 EMAMIDESIGN           ‘Acrysil GmbH’                                                 products, including           Award
                                                                   take bathroom
                                                                                       Fittings, WCs, etc.
                                                                design to new level

                                    One Stop Solution for all Bath Products

                                                                                                                                                                   28
Business Model
Moulds an Integral Part of Manufacturing Process

                                          Input                         Processing                     Output

                              Purchase of Moulds
                              All the Moulds are
                              imported                                                        Production Capacity
                                                                                              10,00,000* units per
                                                                                              annum
                             Variety of Moulds
                             ▪     Has more than 150 moulds       Place: Bhavnagar, Gujarat
                             ▪     400+ SKU’s

                                                                                              Made to Order
                             Life of Moulds
                                                                                              Made as per the customer
                             A Mould can be utilized for 15+
                                                                                              needs
                             years

  * 1,60,000 units of capacity expansion completed in June 2022

                                                                                                                         30
Domestic Presence - Strengthening of our Brands
With strong focus on domestic market, we are increasing our penetration domestically by expansion in dealer
network pan India. Further plans to increase dealers to ~ 3,000 by end of FY23
Dealer Network
1880
1500 1500 1500 1500
1200 1300
800
550
400
2013-14 2014-15 2015-16 2016-17 2017-18 2018-19 2019-20 2020-21 2021-22 Q1 FY23
Distributor Network
ARABIAN BAY OF
SEA BENGAL 80 82 82 82 82 82
60 65
45
Sales 30
Distributor
2013-14 2014-15 2015-16 2016-17 2017-18 2018-19 2019-20 2020-21 2021-22 Q1 FY23
Map not to scale. All data, information and maps are provided “as is” without warranty or any representation of accuracy, timeliness or completeness
31Increasing Presence Across India
✓ Increasing Penetration in domestic
market through opening of many
galleries across India
✓ Displaying vast range of ‘CARYSIL’
products ranging from kitchen sinks,
chimneys, hobs, cooktops, faucets,
dishwashers, etc.
32Presence in UK through Acrysil Products Ltd.
(formerly known as Homestyle Products Ltd.)
Acrysil holds 100% in Homestyle Products through Acrysil UK Limited
The name of Homestyle Products Limited has been changed to Acrysil Products Limited
Products sold under Acrysil Products Ltd.
Revenues (Mn. GBP) (formerly known as HomeStyle UK)
Others(incl. Taps &
1. Quartz Sinks Accessories), 17.7%
+20% 9.7 2. Steel Sinks
7.1
Steel Sinks,
5.7
6.5 3. Others (Incl. Taps & Accessories) 30.40%
3.9 4.5
2.3
FY17 FY18 FY19 FY20 FY21 FY22 Q1 FY23
Revenues from Quartz Sink Business (Rs. Crs.)
Quartz
Sinks,
57.0 51.90%
+54%
31.2 31.2
21.1
13.0 11.5
6.6 Q1 FY23
FY17 FY18 FY19 FY20 FY21 FY22 Q1 FY23
33Further strengthened Presence in UK through ‘Sylmar Technology Limited’
The acquisition is a natural and strategic fit for Acrysil and will catapult the Company into new orbit of growth
Acquisition Revenues (Mn. GBP)
Covid Impact
+8.3%
14.0 13.9 3.4
12.3 3.1
Overview Deal & Consideration Rationale 10.9
• Acrysil UK Limited, a wholly owned • Through acquisition of TOL along with its
• Tickford Orange Limited (TOL) is the
subsidiary of Acrysil Ltd, has acquired subsidiary STL, Acrysil UK will strengthen
holding company of Sylmar Technology
100% shares of the TOL & consequently its presence and market share in UK
Limited (STL)
100% shares of STL. market
• STL is a Manufacturer, distributor and CY2018 CY2019 CY2020 CY2021 Qtr. Ended Qtr. Ended
• The manufacturing and distribution • Acquisition will help Acrysil build upon
customiser of high-quality solid surface 30th June, 30th June,
facility of STL is centrally located in their offerings within the kitchen
products for kitchen and bathroom, for 2021 2022
Alfreton, Derbyshire, UK. segment and provide access to the
both domestic and commercial use to a
bathroom segment
number of markets
• Acrysil UK has acquired 100% equity Comments by Mr. Chirag Parekh, Chairman & Managing
shares for a total consideration £11m • Opportunity for Acrysil UK to gain access Director, Acrysil Limited said:
• STL has 3 key brands Maia, Minerva and
to loyal customer base of STL thus
Metis
• TOL is a debt free company providing potential new sales channels to
sell its existing products “This acquisition will now allow us to further strengthen
• It’s a leading player in the UK solid
surface market with an estimated 35%
our presence and market share in UK market and gain
• Open up cross selling opportunities for access to a loyal customer base thus providing potential
market share
Acrysil UK
new sales channels and cross-selling opportunities. This
• With this acquisition, expect 40% increase will help us build upon our offerings within the kitchen
in sales segment and provide access to the bathroom segment.”
34Multiple Growth Drivers
Strong Distribution Network
Strengthen the Distribution network by tie up with Homestyle and Short Term
STL, UK and plan to add new 100 galleries and 34 more distributor
and increase dealer network by ~3000 dealers
Branding & Technology
Focused on capturing the Brand Mindspace of niche Consumers
Growth Huge Product Range
Drivers Entry into the kitchen appliances market with innovation, R&D and
design capabilities – Aim to become a major player
Medium
Term
Expansion
Currently catering to 55+ countries strive to spread the wings to 70
countries in next three years by exploring the uncatered
geographies
Only Quartz Sink Company
Only company in India and amongst the 4 global players
manufacturing Quartz Sinks
Long Term
35Historical Financials
Consolidated Profit & Loss Statement
  Particulars (Rs. Crs.)               FY22    FY21    FY20
  Revenue                              483.9   309.7   276.2
  Gain / (Loss) on Foreign Exchange     8.5     5.8      -
  Total Income                         492.4   315.5   276.2
  Raw Material                         209.5   141.8   137.4
  Employee Expenses                     29.9    22.2    22.2
  Other Expenses                       137.5    79.9    70.3
  EBITDA                               115.5    71.6    46.4
  EBITDA Margin (%)                    23.5%   22.7%   16.8%
  ESOP Expense                          3.7      -       -
  Other Income                          1.6     2.2     4.7
  Depreciation                          17.7    12.7    11.9
  EBIT                                  95.7    61.1    39.2
  EBIT Margin (%)                      19.4%   19.4%   14.2%
  Finance Cost                           9.6     7.3     8.7
  Profit Before Tax                     86.1    53.8    30.5
  Tax                                   20.8    14.5     7.6
  Profit After Tax                      65.3    39.3    22.9
  PAT After Tax Margin(%)              13.3%   12.5%    8.3%
  MI                                     0.5     0.2    0.8
  PAT After MI                          64.8    39.1   22.1
  PAT After MI Margin(%)               13.2%   12.4%   8.0%

                                                               37
Consolidated Balance Sheet
Assets (Rs. Crs.) Mar-22 Mar-21 Mar-20 Liabilities (Rs. Crs.) Mar-22 Mar-21 Mar-20
Non-current assets 245.8 170.3 138.8 Total Equity 256.9 194.0 160.2
Property Plant & Equipment 168.3 121.2 97.8 Share capital 5.3 5.3 5.3
Right to use of assets 12.3 5.0 1.4 Other Equity 248.4 186.1 152.5
Goodwill 23.9 23.9 23.9 Money received against Share Warrants - - -
Intangible Assets 1.8 1.9 1.7 Non Controlling Interest 3.2 2.6 2.4
Capital Work in Progress 20.7 10.0 9.1 Non-Current liabilities 53.8 31.0 24.3
Financial Assets Financial Liabilities
(i) Others Non-Current Financial Asset 1.6 1.2 1.5 (i) Borrowings 38.6 21.7 21.2
Other Non-Current Assets 17.1 7.1 3.4 Lease Liabilities 9.8 4.6
Deferred Tax liabilities (Net) 4.6 4.0 2.0
Current Assets 307.6 220.9 185.7 Provisions 0.8 0.7 0.6
Inventories 104.2 54.6 59.7 Other financial Liabilities - - 0.5
Financial Assets Current liabilities 242.6 166.2 140.1
Financial Liabilities
(i) Trade receivables 100.4 83.0 62.3 (i) Borrowings 98.7 79.6 68.4
(ii) Cash and Cash Equivalents 5.3 7.7 5.9 (ii) Trade payables 79.4 41.8 29.0
(iii) Bank Balances other than above 6.1 12.4 13.6 (iii) Other Financial Liabilities 3.2 3.2 14.1
(iv) Loans 0.2 0.1 0.1 Lease Liabilities 3.0 1.0
(v) Other Current Financial Assets 12.6 17.3 10.6 Other current liabilities 6.9 7.9 4.5
Other Current Assets 32.9 16.7 12.8 Provisions 1.6 1.0 0.8
Current Tax Assets (Net) 45.9 29.0 20.7 Current Tax Liabilities 49.8 31.8 23.4
Total Assets 553.3 391.2 324.5 Total Liabilities 553.3 391.2 324.5
38Consolidated Cash Flow Statement
Particulars (Rs. Crs.) Mar-22 Mar-21 Mar-20
Net Profit For The Year 65.0 39.3 22.9
Adjustments for: Non-Cash Items / Other Investment or Financial Items 87.0 38.7 29.1
Operating profit before working capital changes 152.0 78.0 51.9
Changes in working capital -81.3 -20.1 -14.4
Cash generated from Operations 70.7 57.9 37.5
Direct taxes paid (net of refund) -19.1 -12.4 -7.4
Net Cash from Operating Activities 51.6 45.4 30.1
Net Cash from Investing Activities -72.5 -34.8 -19.5
Net Cash from Financing Activities 18.4 -8.8 -9.9
Net Decrease in Cash and Cash equivalents -2.5 1.8 0.8
Add: Cash & Cash equivalents at the beginning of the period 7.7 5.9 5.1
Cash & Cash equivalents at the end of the period 5.3 7.7 5.9
39Standalone Profit & Loss Statement
Particulars (Rs. Crs.) FY22 FY21 FY20
Revenue 388.0 248.3 214.4
Gain / (Loss) on Foreign Exchange 8.3 5.8 4.1
Total Income 396.3 254.2 218.5
Raw Material 163.6 110.2 103.7
Employee Expenses 22.3 16.0 16.7
Other Expenses 120.5 72.7 62.0
EBITDA 87.1 55.3 36.0
EBITDA Margin (%) 22.0% 21.7% 16.5%
ESOP Expense 2.9 - -
Other Income 6.0 1.5 0.9
Depreciation 16.8 11.6 10.9
EBIT 76.3 45.2 26.0
EBIT Margin (%) 19.3% 17.8% 11.9%
Finance Cost 8.7 6.4 7.8
Profit Before Tax 67.6 38.8 18.2
Tax 16.1 12.1 5.4
Profit After Tax 51.5 26.6 12.8
PAT After Tax Margin(%) 13.0% 10.5% 5.9%
40Standalone Balance Sheet
Assets (Rs. Crs.) Mar-22 Mar-21 Mar-20 Liabilities (Rs. Crs.) Mar-22 Mar-21 Mar-20
Non-current assets 204.9 145.6 114.4 Total Equity 200.3 151.4 130.3
Property Plant & Equipment 147.0 104.9 83.8 Share capital 5.3 5.3 5.3
Right to use of assets 12.3 5.0 1.4 Other Equity 195.0 146.1 125.0
Goodwill - - -
Intangible Assets 1.8 1.8 1.7
Capital Work in Progress 16.7 9.7 6.5
Financial Assets
Investments 17.0 14.1 14.1
Loans 2.5 2.4 2.2 Non-Current liabilities 46.2 26.1 15.5
Other Non-Current Financial Asset 1.5 1.2 1.4 Financial Liabilities
Other Non-Current Assets 6.0 6.6 3.3 (i) Borrowings 30.6 16.2 11.8
Deferred Tax liabilities (Net) 5.2 4.8 2.8
Lease Liabilities 9.8 4.6 -
Current Assets 249.8 176.3 150.7 Provisions 0.7 0.5 0.4
Inventories 75.7 39.0 42.1 Other financial Liabilities - - 0.5
Financial Assets Current liabilities 208.1 144.3 119.2
Financial Liabilities
(i) Trade receivables 82.1 60.9 50.9 (i) Borrowings 92.2 74.9 65.1
(ii) Cash and Cash Equivalents 0.9 2.3 1.3 (ii) Trade payables 60.8 31.2 20.1
(iii) Bank Balances other than above 5.9 12.3 13.5 (iii) Other Financial Liabilities 3.1 3.1 8.9
(iv) Loans 0.1 0.1 0.1 Lease Liabilities 3.0 1.0 -
(v) Other Current Financial Assets 12.6 17.3 10.4 Other current liabilities 2.7 4.1 3.0
Other Current Assets 27.6 15.9 20.2 Provisions 1.0 1.0 0.7
Current Tax Assets (Net) 44.8 28.5 12.1 Current Tax Liabilities 45.3 29.0 21.3
Total Assets 454.6 321.9 265.0 Total Liabilities 454.6 321.9 265.0
41Standalone Cash Flow Statement
Particulars (Rs. Crs.) Mar-22 Mar-21 Mar-20
Net Profit For The Year 51.5 26.6 12.8
Adjustments for: Non-Cash Items / Other Investment or Financial Items 44.3 34.0 25.3
Operating profit before working capital changes 95.8 60.6 38.1
Changes in working capital -30.4 -12.1 -11.8
Cash generated from Operations 65.4 48.5 26.3
Direct taxes paid (net of refund) -15.7 -10.7 -5.8
Net Cash from Operating Activities 49.7 37.8 20.5
Net Cash from Investing Activities -65.7 -33.4 -15.6
Net Cash from Financing Activities 14.6 -3.4 -6.1
Net Decrease in Cash and Cash equivalents -1.4 1.0 -1.2
Add: Cash & Cash equivalents at the beginning of the period 2.3 1.3 2.5
Cash & Cash equivalents at the end of the period 0.9 2.3 1.3
42Improving Performance
Return on Capital Employed (%) Return on Equity (%) Working Capital Days
+710 bps
24.0% 28.9% 70
21.8% 21.3% 63
20.7%
56
+2180 bps 51
16.9% 16.4% 20.2%
44
14.5%
13.2%
28
10.3%
7.1%
FY17 FY18 FY19 FY20 FY21 FY22 FY17 FY18 FY19 FY20 FY21 FY22 FY17 FY18 FY19 FY20 FY21 FY22
43Regular Dividend Payout
Dividend 21.2% 22.8% 27.8% 21.7% 18.1% 14.3% 13.6% 9.9%
Payout
(excl. DDT)
24.3
21.9
18.9
18.0
14.7
8.4
6.6
5.0 5.0 4.6
4.0
2.0 2.4
1.0 1.2 1.2
2015 2016 2017 2018# 2019# 2020# 2021# 2022#
EPS DPS
The Board of Directors have recommended a final dividend of Rs. 1.20 per equity share for Financial Year 2021-2022 in addition to Interim Dividend of Rs.
1.20 per equity share of FV Rs.2 declared on 2nd February 2022. The total dividend is Rs. 2.40 per equity share (120% of FV)
*EPS for FY17 is on basis of I-GAAP Financials #Adjusted for Split from Face value of Rs. 10 to Face value of Rs. 2
44For further information, please contact
Company : Investor Relations Advisors :
CIN: L26914MH1987PLC042283 CIN: U74140MH2010PTC204285
Mr. Anand Sharma – CFO Mr. Rahul Agarwal/ Ms. Khushbu Shah
cfo@acrysil.com rahul.agarwal@sgapl.net/ khushbu.shah@sgapl.net
+91 9821438864 / +91 9820601181
www.acrysilcorporateinfo.com www.sgapl.net
45You can also read