KITTILÄ UPDATE The BMO 30th Global Metals & Mining Conference - March 5, 2021
←
→
Page content transcription
If your browser does not render page correctly, please read the page content below

KITTILÄ UPDATE

The BMO 30th Global Metals & Mining Conference
                                   March 5, 2021
FORWARD LOOKING STATEMENTS
The information in this presentation has been p repared as at Fe bruary 25, 2021. Certain statements contained in this presentation constitute "forward-looking statements" within the m eaning of the United States Private Securities Litigation Reform Act of
1995 and "f orwa rd-looking information" unde r the p rovisions of Canadian provincial securities laws and are referred to he rein as "fo rward -looking statements". When used in this presentation, the wo rds "anticipate", "could", "estimate", "expect", "forecast",
"future ", "plan", "possible", "potential", "will" and similar expressions are intended to identify forward-looking statements. Such statements include, without limitation: statements regarding the impact of the COVID -19 pandemic and measures taken to reduce
the spread of C OVID -19 on the Company's futu re ope rations, including its employees and overall business; the Company's forwa rd-looking guidance, including metal production, estimated ore grades, recovery rates, p roject timelines, drilling results, life of
mine estimates, total cash costs per ounce, AISC per ounce, minesite costs per tonne, other expenses, cash flows and free cash flow; the estimated timing and conclusions of technical studies and evaluations; the methods by which ore will be extracted or
processed; statements concerning the Company's expansion plans at Kittila, Meliadine Phase 2, the Amaruq underground project and the Odyssey project, including the timing, funding, completion and commissioning thereof and production therefrom;
statements about the Company's plans at the Ho pe Bay mine; statements concerning othe r expansion projects, recovery rates, mill throughput, optimization and projected exploration, including costs and other estimates upon which such projections are
based; statements regarding timing and amounts of capital expenditures, other expenditures and other cash needs, and expectations as to the funding thereof; estimates of future mineral reserves, mineral resources, mineral production and sales; the
projected development of certain ore deposits, including estimates of exploration, development and production and other capital costs and estimates of the timing of such exploration, development and production or decisions with respect to such
exploration, development and production; estimates of mineral reserves and mineral resources and the effect of drill results on future mineral reserves and mineral resources; statements rega rding the Comp any's ability to obtain the necessary permits and
authorizations in connection with its proposed or current exploration, development and mining operations and the anticipated timing thereof; statements regarding anticipated future exploration; the anticipated timing of events with respect to the Company's
mine sites; statements regarding the sufficiency of the Company's cash resources; statements regarding f uture activity with respect to the Company's unsecured revolving bank credit facility; future dividend amounts and payment da tes; and statements
regarding anticipated trends with respect to the Company's ope rations, exploration and the fu nding thereof. Such statements reflect the Company's views as at the date of this presentation and a re subject to certain risks, uncertainties and assumptions,
and undue reliance should not be placed on such statements. Forward-looking statements are necessarily based upon a number of factors and assumptions that, while considered reasonable by Agnico Eagle as of the date of such statements, are
inherently subject to significant business, economic and competitive uncertainties and contingencies. The material factors and assumptions used in the preparation of the forward looking statements contained herein, which may prove to be incorrect,
include, but are not limited to, the assumptions set forth he rein and in man agement's discussion and analysis ("MD&A") a nd the Company's Annual Info rmation Fo rm ("AIF ") fo r the year ended December 31, 2019 filed with Canadian securities regulators
and that are included in its Annual Report on Form 40 -F fo r the year end ed December 3 1, 2019 ("Fo rm 40-F") filed with the U.S. Securities and Exchange Commission (the "SEC") as well as: that governments, the Company or oth ers do not take additional
measures in response to the COVI D-19 p andemic or othe rwise that, individually or in the aggregate, materially affect the Company's ability to operate its business; that cautionary measures taken in connection with the COVID -19 pan demic do not affect
productivity; that measures taken relating to, or othe r effects of, the C OVID-19 pandemic do not a ffect the Co mpany's ability to obtain necessary supplies and deliver them to its mine sites; that there are no significant disruptions affecting operations; that
production, permitting, development, expansion and the ramp up of ope rations at each of Agnico Eagle's prop erties proceeds on a basis consistent with current expectations and plans; that the relevant metal prices, foreign exchange rat es and prices for
key mining and construction supplies will be consistent with Agnico Eagle's expectations; that Agnico Eagle's current estimates of mineral reserves, mineral resources, mineral grades and metal recovery are accurate; that there a re no mate rial delays in the
timing for completion of ongoing growth projects; that seismic activity at the Company's operations at LaRonde and othe r prope rties is as expected by the Company; that the Company's current plans to optimize production are successful; and that there are
no material variations in the current tax and regulato ry environment. Many factors, known and unknown, could cause the actual results to be materially different from those expressed or implied by such forward looking statements. Such risks include, but
are not limited to: the extent and m anner t o which C OVID-19, and me asures taken by governments, the Company o r othe rs to attempt to reduce the spread of COVID -19, may af fect the Co mpany, whethe r directly or thro ugh effects on em ployee health,
workforce productivity and availability (including the ability to transport personnel to the Meadowbank Complex and Meliadine mine which ope rate as fly-in/fly-out camps), travel restrictions, contractor availability, supply availability, ability to sell or deliver
gold dore bars o r concentrate, availability of insurance and the cost thereof, the ability to procure inputs required fo r the Company's operations and projects or other aspects of the Company's business; uncertainties with respect to the effect on the global
economy associated with the COVID-19 pandemic and measures taken to reduce the spread of COVID-19, any of which could negatively affect financial markets, including the trading price of the Company's shares and the price of gold, and could
adversely affect the Company's ability to raise capital; the volatility of prices of gold and other metals; uncertainty of mineral reserves, mineral resources, mineral grades and mineral recovery estimates; uncertainty of future production, project development,
capital expenditures and other costs; foreign exchange rate fluctuations; financing of additional capital requirements; cost of exploration and development programs; seismic activity at the Company's operations, including the LaRonde Complex and Goldex
mine; mining risks; community protests, including by First Nations groups; risks associated with foreign operations; governmental and environmental regulation; the volatility of the Company's stock price; and risks associated with the Company's currency,
fuel and by-product metal derivative strategies. For a m ore detailed discussion of such risks and other factors that may affect the Comp any's ability to achieve the expectations set forth in the forward -looking statements contained in this presentation, see
the AIF and MD&A filed on SEDAR at www.sedar.com and included in the Form 40-F filed on EDGAR at www.sec.gov, as well as the Company's other filings with the Canadian securities regulators and the SEC. Other than as required by law, the
Company does not intend, and does not assume any obligation, to update these forward-looking statements.

Currency

All amounts in this presentation are expressed in U.S. dollars except as otherwise noted.

Further Information

For further details on Agnico Eagle’s fourth quarter and full year 2020 results, please see the Company's news release dated February 11, 2021.

Front Cov er

Agnico Eagle’s Kittila mine located in the Lapland region of Finland, taken in the fourth quarter of 2020.

                                                                                                        Agnico Eagle | Kittilä Update
NOTES TO INVESTORS
Note Regarding the Use of Non-GAAP Financial Measures

This presentation discloses certain measures, including "total cash costs per ounce", "all-in sustaining costs per ounce“, "minesite costs per tonne“, "operating margin" and “free cash-flow” that are not standardized measures under IFRS. These
measures may not be comparable to similar measures reported by other gold mining companies. For a reconciliation of these measures to the most directly comparable financial information reported in the consolidated financial statements
prepared in accordance with IFRS and for an explanation of how management uses these measures, see "Non-GAAP Financial Performance Measures" in the MD&A filed on SEDAR at www.sedar.com and included in the Form 6-K filed on
EDGAR at www.sec.gov, as well as the Company's other filings with the Canadian securities regulators and the SEC.
The total cash costs per ounce of gold produced is reported on both a by-product basis (deducting by-product metal revenues from production costs) and co-product basis (without deducting by-product metal revenues). Unless otherwise specified
total cash costs per ounce of gold produced is reported on a by-product basis in this presentation. The total cash costs per ounce of gold produced on a by-product basis is calculated by adjusting production costs as recorded in the consolidated
statements of income (loss) for by-product revenues, inventory production costs, smelting, refining and marketing charges and other adjustments, and then dividing by the number of ounces of gold produced. The total cash costs per ounce of gold
produced on a co-product basis is calculated in the same manner as the total cash costs per ounce of gold produced on a by-product basis except that no adjustment is made for by-product metal revenues. Accordingly, the calculation of total cash
costs per ounce of gold produced on a co-product basis does not reflect a reduction in production costs or smelting, refining and marketing charges associated with the production and sale of by-product metals. The total cash costs per ounce of
gold produced is intended to provide information about the cash-generating capabilities of the Company's mining operations. Management also uses this measure to monitor the performance of the Company's mining operations. As market prices
for gold are quoted on a per ounce basis, using the total cash costs per ounce of gold produced on a by-product basis measure allows management to assess a mine's cash-generating capabilities at various gold prices.
All-in sustaining costs per ounce ("AISC") is used to show the full cost of gold production from current operations. The Company calculates all-in sustaining costs per ounce of gold produced on a by-product basis as the aggregate of total cash
costs on a by-product basis, sustaining capital expenditures (including capitalized exploration), general and administrative expenses (including stock options), lease payments related to sustaining assets and reclamation expenses, and then
dividing by the number of ounces of gold produced. The all-in sustaining costs per ounce of gold produced on a co-product basis is calculated in the same manner as the all-in sustaining costs per ounce of gold produced on a by-product basis,
except that the total cash costs per ounce on a co-product basis are used, meaning no adjustment is made for by-product metal revenues. Management is aware that these per ounce measures of performance can be affected by fluctuations in
foreign exchange rates and, in the case of total cash costs per ounce of gold produced on a by-product basis, by-product metal prices. Management compensates for these inherent limitations by using these measures in conjunction with minesite
costs per tonne (discussed below) as well as other data prepared in accordance with IFRS. The World Gold Council ("WGC") is a non-regulatory market development organization for the gold industry. Although the WGC is not a mining industry
regulatory organization, it has worked closely with its member companies to develop relevant non-GAAP measures. The Company follows the guidance on all-in sustaining costs released by the WGC in November 2018. Adoption of the all-in
sustaining costs metric is voluntary and, notwithstanding the Company's adoption of the WGC's guidance, all-in sustaining costs per ounce of gold produced reported by the Company may not be comparable to data reported by other gold mining
companies. The Company believes that this measure provides helpful information about operating performance. However, this non-GAAP measure should be considered together with other data prepared in accordance with IFRS as it is not
necessarily indicative of operating costs or cash flow measures prepared in accordance with IFRS.
Minesite costs per tonne are calculated by adjusting production costs as recorded in the consolidated statements of income (loss) for inventory production costs and other adjustments, and then dividing by tonnes of ore processed. As the total
cash costs per ounce of gold produced can be affected by fluctuations in by product metal prices and foreign exchange rates, management believes that minesite costs per tonne provide additional information regarding the performance of mining
operations, eliminating the impact of varying production levels. Management also uses this measure to determine the economic viability of mining blocks. As each mining block is evaluated based on the net realizable value of each tonne mined, in
order to be economically viable the estimated revenue on a per tonne basis must be in excess of the minesite costs per tonne. Management is aware that this per tonne measure of performance can be impacted by fluctuations in processing levels
and compensates for this inherent limitation by using this measure in conjunction with production costs prepared in accordance with IFRS.
Operating margin is not a recognized measure under IFRS and this data may not be comparable to data presented by other gold producers. This measure is calculated by excluding the following from net income as recorded in the condensed
interim consolidated financial statements: Income and mining taxes expense; Other expenses (income); Foreign currency translation loss (gain); Gain (loss) on derivative financial instruments; Finance costs; General and administrative expenses;
Amortization of property, plant and mine development; Exploration and corporate development expenses; and Impairment losses (reversals). The Company believes that operating margin is a useful measure that represents the operating
performance of its mines associated with the ongoing production and sale of gold and by-product metals. Management uses this measure internally to plan and forecast future operating results. This measure is intended to provide investors with
additional information about the Company’s underlying operating results and should be evaluated in conjunction with other data prepared in accordance with IFRS.
Free cash flow is calculated by deducting additions to property, plant and mine development from cash provided by operating activities including changes in non-cash working capital balances. Management uses free cash flow to assess the
availability of cash, after funding operations and capital expenditures, to operate the business without additional borrowing or drawing down on the Company's existing cash balance.
Note Regarding Production Guidance
The gold production guidance is based on the Company's mineral reserves but includes contingencies and assumes metal prices and foreign exchange rates that are different from those used in the mineral reserve estimates. These factors and
others mean that the gold production guidance presented in this presentation does not reconcile exactly with the production models used to support these mineral reserves.

                                                                                                 Agnico Eagle | Kittilä Update
TABLE OF CONTENTS

1. Kittilä mine in a nutshell

2. Expansion status

3. Next opportunities

4. Mine site and regional exploration

5. ESG

                                        Agnico Eagle | Kittilä Update
KITTILÄ MINE AREA                                  TAILINGS PONDS AND
                                                   WATER MANAGEMENT
~ 1500 hectars                                          FACILITIES

  RAMP TO RIMPI          ROURA OPEN
     AREA                   PIT

                                       RAMP TO                    OFFICE AND
                                      SUURI AREA                 MAINTENANCE
                                                                   BUILDING

                                                   MILL

                         SHAFT &
                        HEADFRAME

                  MINE OFFICE

                                                    SUURI OPEN
                                                       PIT
KITTILÄ MINE IS THE LARGEST GOLD MINE IN EUROPE

 Project acquired    Construction
                                              Mineral reserves          The estimated
from Riddanhyttan   started in 2006.
                                              30,4 Mt @ 4,2 g/t        mine life till mid-
     in 2005        First gold bar in
                                                = 4,1 Moz Au               2030s.
                          2009.

                                                                    2.0 million ounces 2009-2021
                                                   Ca. 1,100
 Ore processing
                                                 employees, of
    capacity        Appr. 250 000 oz             which approx.
   2,0 million       of gold / annum              600 through
  tonnes/year.
                                                  contractors.

                                    Agnico Eagle | Kittilä Update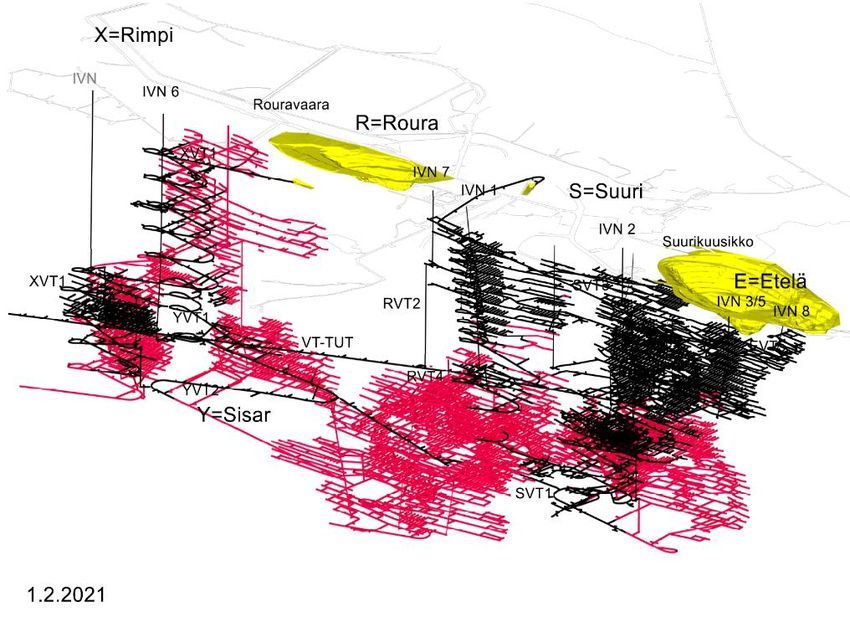
OPERATIONAL KEY FIGURES

 LTA Frequency /                                                                                     Payable Ounces
  200,000 hours                                                                                      300,000
  7.0                                                                                                275,000              + 33% act. 2018 vs.                                  257       265
                                                                                                                                                             250
  6.0                                                                                                250,000              guidance 2021
  5.0                                                                                                225,000                                    208
  4.0                                                                                                200,000      189              186
  3.0                                                                                                175,000
  2.0                                                                                                150,000
  1.0                                                                                                125,000
  0.0                                                                                                100,000
        2009   2010   2011   2012   2013   2014   2015   2016   2017   2018   2019   2020                      Actual 2018    Actual 2019    Actual 2020 Guidance 2021 Guidance 2022 Guidance 2023

                                                                                                       Cash Cost $ / Oz
 • Steady progress in safety performance                                                               1000

 • 33% growth in ounces act. 2018 vs. guidance 2021                                                     900
                                                                                                                             853
                                                                                                        800                                         782
                                                                                                                                                                                         760
 • Declining cash cost trend                                                                                                                                        805
                                                                                                        700

 • Declining capex trend (act.2020 176 M€, budget 2021                                                  600
   97 M€)
                                                                                                        500
                                                                                                                   Actual 2018              Actual 2019          Actual 2020         Guidance 2021
 • Increasing net free cash flow

                                                                                            Agnico Eagle | Kittilä Update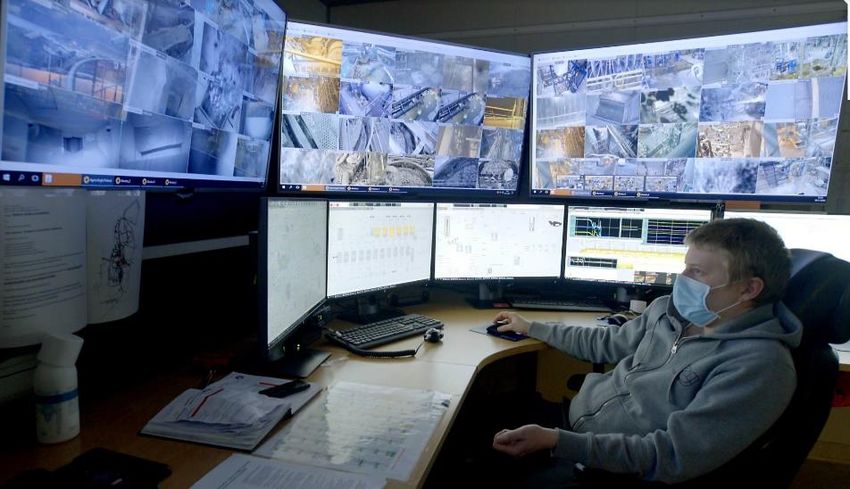
MINING

•   Mining started in 2 small open pits in 2008. Solely
    underground operations since 2013

•   Two main declines; Rimpi and Suuri

•   Record ore production 1,85 million tonnes in 2020,
    ramping up to 2,0 Mta this year

•   Almost 200 stopes a year, paste or cemented rock
    backfilling

•   15 – 17 km of development yearly, in total +150 km

•   Main level at -350 m, new main level under
    construction at -900 m

•   Shaft to -1044 m under construction

                                                 Agnico Eagle | Kittilä Update
MILLING

•   Record ounces of 208 000 in 2020

•   Capacity expansion from 1,6 Mta to 2,0 Mta
    completed in Q4 / 2020

•   Multistep process including autoclave due to
    refractory ore
       •    Crushing
       •    Grinding
       •    Flotation
       •    Pressure oxidation
       •    Leaching
       •    Electrowinning

•   Highly automated
      •    Advanced Process Control for grinding
           circuit in piloting phase

•   Recovery 86 % - 88 %

                                                   Agnico Eagle | Kittilä Update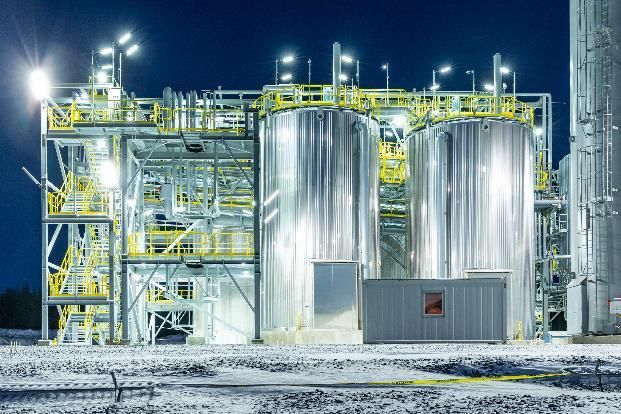
RECENT INFRASTRUCTURE AND GROWTH INVESTMENTS
•    U/G infrastructure
       •   Central pumping station (2020)
       •   New service level at -900 m under construction (2021)

•    Surface infrastructure
       •   Paste plant to serve Rimpi area (2019)
       •   New tailings facility and discharge pipeline (2020)
       •   Nitrogen removal plant in engineering phase (2022)

•    Mill expansion from 1,6 Mta to 2,0 Mta completed
       •   Commissioning ahead of schedule in Q4 / 2020

•    Shaft overall completion rate 86% (end of January)
       •   Shaft sinking delayed due to COVID restrictions
       •   Commissioning of the production hoist during H1/2022
       •   Total cost estimate unchanged at 190 – 200 M€ as earlier
           informed

    In 2021 capex will lower by ~ 40% from 2020 level of 176 MEUR as
    majority of the investments are completed or in final phase

                                                 Agnico Eagle | Kittilä Update
GROWTH OPPORTUNITIES IN THE PIPELINE
Conceptual evaluation for the next growth
phase started
• Working hypothesis based on + 20% processing
volume and ~ 1 Moz extra reserves
• Diamond drilling program commenced to better
understand deep extensions of main and parallel
zone between 1500 – 2000 meters
• Environmental impact assessment on-going,
permitting planned to start in 2022
• Potential for increased processing volume ~
2026
Agnico Eagle | Kittilä UpdatePRODUCTIVITY IMPROVEMENT
SIX SIGMA Organizational Procurement –> Energy Automation and
continuous efficiency 3 M€/a savings efficiency –> digitalization –>
improvement –> flat workforce delivered in 2019 Excess heat Autonomous and
methodology count since 2017 and 2020 via recovery from the teleremote fleet,
widely and growing strategic sourcing mill generates 2,5 advanced
implemented volumes M€/a savings vs. process control
fuel oil
Agnico Eagle | Kittilä UpdateADVANCED AUTOMATION ENHANCING EFFICIENCY & SAFETY
Teleremote and autonomous fleet in Advanced Process Control at mill
U/G mine
50% of production drilling and 15% of ton kilometres More stable process and better throughput
done by automated fleet Pilot at milling circuit, flotation next in line
Short interval control and mine Mill feed management
visualization
Mill feed management
Better predictability of ore quality enables proactive
On-line visibility on operations process parameters' optimisation
Agnico Eagle | Kittilä UpdateMINE SITE EXPLORATION
Au-deposit in Kittilä Mine keeps
on growing
• Exploration in 2020:
• Main and Sisar zones
extended at depth
• Main zone: RUG20-524 8.1
g/t Au / 33.6m at 998 m
depth
• Sisar zone: RIE19-702H 7.3
g/t Au / 4.4m at 1,626 m
depth
• Exploration in 2021:
• Increasing conversion and
exploration
• 74.5 km drilling planned
See AEM February 11, 2021 press release and appendix for detailed breakdown of mineral reserves and mineral resources.
Agnico Eagle | Kittilä UpdateREGIONAL EXPLORATION
EXPLORATION in Central Lapland
• Central Lapland is very AGNICO REGIONAL
EXPLORATION AREA
prospective area for
gold and base metals
• Agnico exploration
licences in Central
Lapland: 24,358
hectares
• 2 mining licenses
• Kittilä Mine
• Kuotko Au-deposit
• 2021 regional
10 km map grid
exploration:
• 5.0 MUSD 50 km map grid
• 15.0 km drilling Known Au-deposit in Central Lapland
Agnico Eagle | Kittilä UpdateSUSTAINABILITY & ESG
Environment Health and Safety Community People
• Over 80 M€ environment • Steadily declining LTA • Active co-operation and • Over 90 percent of
investments in 2016 – 2020 frequency dialogue with interest employees from
groups (e.g. Community Lapland, 50 percent
• Water treatment Liaison Committee)
facility • Multi-year Safety from Kittilä
• Tailings ponds
Journey program, focus • Good co-operation • Valued employer with
on behaviors between different good education & career
• New discharge industries in the region
opportunities
pipeline
• Almost 400 000 €
• Excess heat recovery • Very succe ssful Covid
donations to local and • High engagement, low
19-management, no regional education, turnover
production interruptions sports, culture and youth
• New environmental permit
in 2020 • Regional Developer of
Lapland Award in 2019
as a recognition for good
• Zero environmental non-
community relationship
compliances in 2020 work
• Next focus on w ater • High score in Local
recycling and Nitrogen acceptability study (Uni.
removal of Lapland study 2019)
Agnico Eagle | Kittilä UpdateSUMMARY
• Declining unit costs
• Declining capex
• Increasing production volume
• Long life of mine and further growth
potential
• Low risk and strong social license
Agnico Eagle | Kittilä UpdateMINERAL RESERVES AND MINERAL RESOURCES
Agnico Eagle | Kittilä UpdateMINERAL RESERVES - DECEMBER 31, 2020
OPERATION PROVEN PROBABLE PROVEN & PROBABLE
GOLD Mining Method Ownership 000 tonnes g/t 000 oz Au 000 tonnes g/t 000 oz Au 000 tonnes g/t 000 oz Au
LaRonde Underground 100% 4,338 5.11 712 10,828 6.53 2,272 15,166 6.12 2,984
LaRonde Zone 5 Underground 100% 5,155 2.09 346 6,601 2.08 442 11,756 2.08 788
LaRonde Complex Total 9,493 3.47 1,058 17,429 4.84 2,713 26,922 4.36 3,772
Canadian Malartic Open Pit 50% 25,370 0.85 696 36,068 1.31 1,518 61,438 1.12 2,214
Goldex Underground 100% 942 2.45 74 21,179 1.53 1,040 22,121 1.57 1,115
Akasaba West Open Pit 100% - - 5,413 0.85 147 5,413 0.85 147
Amaruq Open Pit 100% 950 2.06 63 18,920 3.72 2,261 19,870 3.64 2,324
Amaruq Underground 100% - - 3,316 5.29 564 3,316 5.29 564
Amaruq Total 950 2.06 63 22,236 3.95 2,825 23,186 3.87 2,888
Meadowbank Open Pit 100% 34 2.34 3 - - 34 2.34 3
Meadowbank Complex Total 983 2.07 65 22,236 3.95 2,825 23,220 3.87 2,891
Meliadine Open Pit 100% 181 4.10 24 5,460 4.70 826 5,640 4.68 850
Meliadine Underground 100% 1,288 7.28 301 14,342 6.23 2,874 15,629 6.32 3,175
Meliadine Total 1,468 6.89 325 19,801 5.81 3,700 21,270 5.89 4,025
Upper Beaver Underground 100% - - 7,992 5.43 1,395 7,992 5.43 1,395
Hammond Reef Open Pit 100% - - 123,473 0.84 3,323 123,473 0.84 3,323
Kittila Underground 100% 2,999 4.23 408 27,434 4.15 3,659 30,433 4.16 4,067
Pinos Altos Open Pit 100% 62 0.88 2 3,605 1.26 146 3,667 1.25 148
Pinos Altos Underground 100% 2,691 2.21 191 7,105 2.36 539 9,796 2.32 731
Pinos Altos Total 2,753 2.18 193 10,710 1.99 685 13,463 2.03 878
La India Open Pit 100% 89 0.35 1 11,939 0.66 255 12,029 0.66 256
Total 44,098 1.99 2,821 303,675 2.18 21,261 347,773 2.15 24,082
SILVER Mining Method Ownership 000 tonnes g/t 000 oz Ag 000 tonnes g/t 000 oz Ag 000 tonnes g/t 000 oz Ag
LaRonde Underground 100% 4,338 15.59 2,173 10,828 18.81 6,548 15,166 17.89 8,722
Pinos Altos Open Pit 100% 62 13.24 27 3,605 33.68 3,904 3,667 33.34 3,931
Pinos Altos Underground 100% 2,691 54.31 4,698 7,105 49.28 11,257 9,796 50.66 15,956
Pinos Altos Total 2,753 53.38 4,725 10,710 44.03 15,162 13,463 45.94 19,886
La India Open Pit 100% 89 1.38 4 11,939 3.01 1,155 12,029 3.00 1,159
Total 7,180 29.90 6,902 33,478 21.24 22,865 40,658 22.77 29,767
COPPER Mining Method Ownership 000 tonnes % tonnes Cu 000 tonnes % tonnes Cu 000 tonnes % tonnes Cu
LaRonde Underground 100% 4,338 0.21 9,291 10,828 0.28 29,826 15,166 0.26 39,117
Akasaba West Open Pit 100% - - 5,413 0.48 25,891 5,413 0.48 25,891
Upper Beaver Underground 100% - - 7,992 0.25 19,980 7,992 0.25 19,980
Total 4,338 0.21 9,291 24,233 0.31 75,696 28,571 0.30 84,987
Z INC Mining Method Ownership 000 tonnes % tonnes Z n 000 tonnes % tonnes Z n 000 tonnes % tonnes Z n
LaRonde Underground 100% 4,338 0.53 22,894 10,828 0.85 92,560 15,166 0.76 115,454
Total 4,338 0.53 22,894 10,828 0.85 92,560 15,166 0.76 115,454
Agnico Eagle | Kittilä UpdateMINERAL RESOURCES - DECEMBER 31, 2020
OPERATION MEASU RED INDICATED MEASU RED & INDICATED INFERRED
GOLD Mining Method Ownership 000 tonnes g/t 000 oz Au 000 tonnes g/t 000 oz Au 000 tonnes g/t 000 oz Au 000 tonnes g/t 000 oz Au
LaRonde Underground 100% - - 4,904 3.55 560 4,904 3.55 560 6,369 4.54 931
LaRonde Zone 5 Underground 100% - - 12,218 1.98 776 12,218 1.98 776 15,130 2.88 1,399
LaRonde Complex Total - - 17,122 2.43 1,336 17,122 2.43 1,336 21,499 3.37 2,330
Canadian Malartic Open Pit 50% 149 0.55 3 538 0.59 10 686 0.58 13 3,532 0.74 85
Canadian Malartic Underground 50% - - 2,028 1.42 92 2,028 1.42 92 156 1.52 8
Canadian Malartic Total 149 0.55 3 2,566 1.24 103 2,715 1.21 105 3,688 0.78 92
Odyssey Underground 50% - - 1,000 1.90 61 1,000 1.90 61 13,853 2.05 913
East Malartic Underground 50% - - 5,658 2.03 368 5,658 2.03 368 43,444 1.91 2,669
East Gouldie Underground 50% - - - - - - 31,469 3.17 3,209
Goldex Underground 100% 12,360 1.86 739 19,247 1.53 944 31,607 1.66 1,683 24,812 1.49 1,191
Akasaba West Open Pit 100% - - 4,870 0.63 98 4,870 0.63 98 - -
Zulapa Open Pit 100% - - - - - - 391 3.14 39
Meadowbank Open Pit 100% - - 1,145 2.46 90 1,145 2.46 90 4 2.06 0
Amaruq Open Pit 100% - - 7,022 2.53 570 7,022 2.53 570 886 2.65 75
Amaruq Underground 100% - - 6,571 4.28 904 6,571 4.28 904 7,924 4.70 1,198
Amaruq Total - - 13,593 3.37 1,474 13,593 3.37 1,474 8,810 4.50 1,273
Meadowbank Complex Total - - 14,738 3.30 1,564 14,738 3.30 1,564 8,814 4.49 1,274
Meliadine Open Pit 100% - - 6,917 3.00 668 6,917 3.00 668 816 4.23 111
Meliadine Underground 100% 81 3.66 10 11,779 3.83 1,452 11,860 3.83 1,461 11,451 5.94 2,186
Meliadine Total 81 3.66 10 18,697 3.53 2,120 18,777 3.53 2,129 12,267 5.82 2,297
Hammond Reef Open Pit 100% 47,063 0.54 819 86,304 0.53 1,478 133,367 0.54 2,298 - -
Upper Beaver Underground 100% - - 3,636 3.45 403 3,636 3.45 403 8,688 5.07 1,416
AK Project Underground 100% - - 1,268 6.51 265 1,268 6.51 265 2,373 5.32 406
Anoki-McBean Underground 100% - - 1,868 5.33 320 1,868 5.33 320 2,526 4.70 382
Upper Canada Open Pit 100% - - 2,006 1.62 104 2,006 1.62 104 1,020 1.44 47
Upper Canada Underground 100% - - 8,433 2.28 618 8,433 2.28 618 17,588 3.21 1,816
U pper Canada Total - - 10,439 2.15 722 10,439 2.15 722 18,608 3.11 1,863
Kittila Open Pit 100% - - 229 3.41 25 229 3.41 25 373 3.89 47
Kittila Underground 100% 4,748 2.44 372 17,999 2.51 1,452 22,747 2.49 1,824 11,620 3.77 1,408
Kittila Total 4,748 2.44 372 18,228 2.52 1,477 22,976 2.50 1,849 11,993 3.77 1,454
Kuotko Open Pit 100% - - - - - - 284 3.18 29
Kylmäkangas Underground 100% - - - - - - 1,896 4.11 250
Barsele Open Pit 55% - - 3,178 1.08 111 3,178 1.08 111 2,260 1.25 91
Barsele Underground 55% - - 1,158 1.77 66 1,158 1.77 66 13,552 2.10 914
Barsele Total - - 4,335 1.27 176 4,335 1.27 176 15,811 1.98 1,005
Pinos Altos Open Pit 100% - - 1,734 0.81 45 1,734 0.81 45 468 1.18 18
Pinos Altos Underground 100% - - 15,701 1.66 837 15,701 1.66 837 3,090 1.86 185
Pinos Altos Total - - 17,436 1.57 882 17,436 1.57 882 3,558 1.77 203
La India Open Pit 100% 9,781 0.87 274 1,309 0.73 31 11,091 0.85 305 419 0.55 7
Tarachi Open Pit 100% - - 22,665 0.40 294 22,665 0.40 294 6,476 0.33 68
Chipriona Open Pit 100% - - 1,266 1.08 44 1,266 1.08 44 12,799 0.68 278
El Barqueño Gold Open Pit 100% - - 8,834 1.16 331 8,834 1.16 331 9,628 1.13 351
Santa Gertrudis Open Pit 100% - - 5,778 0.60 111 5,778 0.60 111 19,691 1.18 746
Santa Gertrudis Underground 100% - - - - - - 7,980 3.43 879
Santa Gertrudis Total - - 5,778 0.60 111 5,778 0.60 111 27,671 1.83 1,625
Total 74,182 0.93 2,216 267,264 1.53 13,130 341,446 1.40 15,346 282,965 2.57 23,351
Agnico Eagle | Kittilä UpdateMINERAL RESOURCES - DECEMBER 31, 2020
OPERATION MEASU RED INDICATED MEASU RED & INDICATED INFERRED
SILVER Mining Method Ownership 000 tonnes g/t 000 oz Ag 000 tonnes g/t 000 oz Ag 000 tonnes g/t 000 oz Ag 000 tonnes g/t 000 oz Ag
LaRonde Underground 100% - - 4,904 21.39 3,372 4,904 21.39 3,372 6,369 23.98 4,911
Kylmäkangas Underground 100% - - - - - - 1,896 31.11 1,896
Pinos Altos Open Pit 100% - - 1,734 16.45 917 1,734 16.45 917 468 42.00 632
Pinos Altos Underground 100% - - 15,701 44.18 22,303 15,701 44.18 22,303 3,090 50.41 5,008
Pinos Altos Total - - 17,436 41.42 23,221 17,436 41.42 23,221 3,558 49.31 5,640
La India Open Pit 100% 9,781 5.37 1,690 1,309 4.04 170 11,091 5.22 1,860 419 3.09 42
Chipriona Open Pit 100% - - 1,266 49.81 2,028 1,266 49.81 2,028 12,799 75.59 31,104
El Barqueño Silver Open Pit 100% - - - - - - 4,393 124.06 17,523
El Barqueño Gold Open Pit 100% - - 8,834 4.73 1,343 8,834 4.73 1,343 9,628 16.86 5,218
Santa Gertrudis Open Pit 100% - - 5,778 4.39 816 5,778 4.39 816 19,691 1.90 1,200
Santa Gertrudis Underground 100% - - - - - - 7,980 25.39 6,515
Santa Gertrudis Total - - - - - - 27,610 8.67 7,715
Total 9,781 5.37 1,690 39,528 24.35 30,950 49,309 20.59 32,640 66,733 34.51 74,050
COPPER Mining Method Ownership 000 tonnes % tonnes Cu 000 tonnes % tonnes Cu 000 tonnes % tonnes Cu 000 tonnes % tonnes Cu
LaRonde Underground 100% - - 4,904 0.13 6,371 4,904 0.13 6,371 6,369 0.27 17,352
Akasaba West Open Pit 100% - - 4,870 0.37 18,246 4,870 0.37 18,246 - -
Upper Beaver Underground 100% - - 3,636 0.14 5,135 3,636 0.14 5,135 8,688 0.20 17,284
Chipriona Open Pit 100% - - 1,266 0.03 404 1,266 0.03 404 12,799 0.13 16,670
El Barqueño Gold Open Pit 100% - - 8,834 0.19 16,400 8,834 0.19 16,400 9,628 0.22 21,152
Total - - 23,511 0.20 46,555 23,511 0.20 46,555 37,484 0.19 72,458
Z INC Mining Method Ownership 000 tonnes % tonnes Z n 000 tonnes % tonnes Z n 000 tonnes % tonnes Z n 000 tonnes % tonnes Z n
LaRonde Underground 100% - - 4,904 0.81 39,560 4,904 0.81 39,560 6,369 1.96 124,660
Chipriona Open Pit 100% - - 1,266 1.31 16,569 1,266 1.31 16,569 12,799 0.81 103,906
Total - - 6,171 0.91 56,129 6,171 0.91 56,129 19,168 1.19 228,566
Agnico Eagle | Kittilä UpdateNOTES TO INVESTORS REGARDING THE USE OF MINERAL RESOURCES
Notes to Investors Regarding the Use of Mineral Resources
The mineral reserve and mineral resource estimates contained in this presentation have been prepared in accordance with The Canadian Securities Administrators' NI 43-101. These standards are similar to those used by SEC Industry Guide
No. 7, as interpreted by the SEC staff. However, the definitions in NI 43-101 differ in certain respects from those under SEC Industry Guide 7. Accordingly, mineral reserve and mineral resource information contained in this news release may not
be comparable to similar information disclosed by United States companies. Under the SEC's Industry Guide 7, mineralization may not be classified as a "reserve" unless the determination has been made that the mineralization could be
economically and legally produced or extracted at the time the reserve determination is made.
For United States reporting purposes, the SEC has adopted amendments to its disclosure rules (the "SEC Modernization Rules") to modernize the mining property disclosure requirements for issuers whose securities are registered with the SEC
under the United States Securities Exchange Act of 1934, as amended (the "Exchange Act"), which became effective February 25, 2019. The SEC Modernization Rules more closely align the SEC's disclosurerequirements and policies for mining
properties with current industry and global regulatory practices and standards, including NI 43-101, and replace the historical property disclosure requirements for mining registrants that were included in SEC Industry Guide 7. Issuers must begin
to comply with the SEC Modernization Rules in their first fiscal year beginning on or after January 1, 2021, though Canadian issuers that report in the United States using the Multijurisdictional Disclosure System ("MJDS") may still use NI 43-101
rather than the SEC Modernization Rules when using the SEC's MJDS registration statement and annual report forms.
As a result of the adoption of the SEC Modernization Rules, the SEC now recognizes estimates of "measured mineral resources", "indicated mineral resources" and "inferred mineral resources." In addition, the SEC has amended definitions of
"proven mineral reserves" and "probable mineral reserves" in the SEC Modernization Rules, with definitions that are substantially similar to those used in NI 43-101.
United States investors are cautioned that while the SEC now recognizes "measured mineral resources", "indicated mineral resources" and "inferred mineral resources", investors should not assume that any part or all of the mineral deposits in
these categories will ever be converted into a higher category of mineral resources or into mineral reserves. These terms have a great amount of uncertainty as to their economic and legal feasibility. Under Canadian regulations, estimates of
inferred mineral resources may not form the basis of feasibility or pre-feasibility studies, except in limited circumstances. Investors are cautioned not to assume that any "measured mineral resources", "indicated mineral resources", or "inferred
mineral resources" that the Company reports in this news release are or will be economically or legally mineable.
Further, "inferred mineral resources" have a great amount of uncertainty as to their existence and as to their economic and legal feasibility. It cannot be assumed that any part or all of an inferred mineral resource will ever be upgraded to a higher
category.
The mineral reserve and mineral resource data set out in this news release are estimates, and no assurance can be given that the anticipated tonnages and grades will be achieved or that the indicated level of recovery will be realized. The
Company does not include equivalent gold ounces for by-product metals contained in mineral reserves in its calculation of contained ounces and mineral reserves are not reported as a subset of mineral resources.
Assumptions used for the December 31, 2020 mineral reserves estimate at all mines and advanced projects reported bythe Company
Metal prices Exchange rates
Mexican peso per
Gold (US$/oz) Silv er (US$/oz) Copper (US$/lb) Zinc (US$/lb) C$ per US$1.00 US$ per €1.00
US$1.00
Operations and projects $1,250 $17 $2.75 $1.00 C$1.30 MXP18.00 US$1.15
Hammond Reef $1,350 Not applicable Not applicable Not applicable C$1.30 Not applicable Not applicable
Upper Beaver* $1,200 Not applicable $2.75 Not applicable C$1.25 Not applicable Not applicable
Agnico Eagle | Kittilä UpdateNOTES TO INVESTORS REGARDING THE USE OF MINERAL RESOURCES
NI 43-101 requires mining companies to disclose mineral reserves and mineral resources using the subcategories of "proven mineral reserves", "probable mineral reserves", "measured mineral resources", "indicated mineral resources" and
"inferred mineral resources". Mineral resources that are not mineral reserves do not have demonstrated economic viability.
A mineral reserve is the economically mineable part of a measured and/or indicated mineral resource. It includes diluting materials and allowances for losses,which may occur when the material is mined or extracted and is defined by studies at
pre-feasibility or feasibility level as appropriate that include application of modifying factors. Such studies demonstrate that, at the time of reporting, extraction could reasonably be justified. The mineral reserves presented in this news release are
separate from and not a portion of the mineral resources.
Modifying factors are considerations used to convert mineral resources to mineral reserves. These include, but are not restricted to, mining, processing, metallurgical, infrastructure, economic, marketing, legal, environmental, social and
governmental factors.
A proven mineral reserve is the economically mineable part of a measured mineral resource. A proven mineral reserve implies a high degree of confidence in the modifying factors. A probable mineral reserve is the economically mineable part of
an indicated and, in some circumstances, a measured mineral resource. The confidence in the modifying factors applying to a probable mineral reserve is lower than that applying to a proven mineral reserve.
A mineral resource is a concentration or occurrence of solid material of economic interest in or on the Earth's crust in such form, grade or quality and quantity that there are reasonable prospects for eventual economic extraction. The location,
quantity, grade or quality, continuity and other geological characteristics of a mineral resource are known, estimated or interpreted from specific geological evidence and knowledge, including sampling.
A measured mineral resource is that part of a mineral resource for which quantity, grade or quality, densities, shape and physical characteristics are estimated with confidence sufficient to allow the application of modifying factors to support
detailed mine planning and final evaluation of the economic viability of the deposit. Geological evidence is derived from detailed and reliable exploration, sampling and testing and is sufficient to confirm geological and grade or quality continuity
between points of observation. An indicated mineral resource is that part of a mineral resource for which quantity, grade or quality, densities, shape and physical characteristics are estimated with sufficient confidence to allow the application of
modifying factors in sufficient detail to support mine planning and evaluation of the economic viability of the deposit. Geological evidence is derived from adequately detailed and reliable exploration, sampling and testing and is sufficient to
assume geological and grade or quality continuity between points of observation. An inferred mineral resource is that part of a mineral resource for which quantity and grade or quality are estimated on the basis of limited geological evidence and
sampling. Geological evidence is sufficient to imply but not verify geological and grade or quality continuity.
Investors are cautioned not to assume that part or all of an inferred mineral resource exists, or is economicallyor legallymineable.
A feasibility study is a comprehensive technical and economic study of the selected development option for a mineral project that includes appropriately detailed assessments of applicable modifying factors, together with any other relevant
operational factors and detailed financial analysis that are necessary to demonstrate, at the time of reporting, that extraction is reasonably justified (economically mineable). The results of the study may reasonably serve as the basis for a final
decision by a proponent or financial institution to proceed with, or finance, the development of the project. The confidence level of the study will be higher than that of a pre-feasibility study.
The effective date for all of the Company's mineral resource and mineral reserve estimates in this presentation is December 31, 2020. Additional information about each of the mineral projects that is required by NI 43-101, sections 3.2 and 3.3
and paragraphs 3.4(a), (c) and (d), as well as other information, can be found in Technical Reports, which may be found at www.sedar.com. Other important operating information can be found in the Company's AIF, MD&A and Form 40-F.
Scientific and Technical Data
The scientific and technical information contained in this news release relating to Quebec operations has been approved by Daniel Paré, P.Eng., Vice-President Operations – Eastern Canada; relating to Nunavut operations has been approved by
Dominique Girard, Eng., Senior Vice-President, Operations – Canada and Europe; relating to Finland operations has been approved by Francis Brunet, Eng., Corporate Director, Business Strategy; relating to Southern Business operations has
been approved by Marc Legault, Eng., Senior Vice-President, Operations – U.S.A. & Latin America; and relating to exploration has been approved by Guy Gosselin, Eng. and P.Geo., Senior Vice-President, Exploration, each of whom is a
"Qualified Person" for the purposes of NI 43-101.
The scientific and technical information relating to Agnico Eagle's mineral reserves and mineral resources contained herein (other than the Canadian Malartic mine) has been approved by Dyane Duquette, P.Geo., Corporate Director, Reserves
Development of the Company; relating to mineral reserves and mineral resources at the Canadian Malartic mine and other Partnership projects such as the Odyssey project, has been approved by Sylvie Lampron, Eng., Senior Project Mine
Engineer at Canadian Malartic Corporation (for engineering) and Pascal Lehouiller, P.Geo., Senior Resource Geologist at Canadian Malartic Corporation (for geology), each of whom is a "Qualified Person" for the purposes of NI 43-101.
Agnico Eagle | Kittilä UpdateTHANK YOU
You can also read