ABUJAR: WEST AFRICA'S NEXT GOLD MINE - TIETTO MINERALS
←
→
Page content transcription
If your browser does not render page correctly, please read the page content below
TIETTO            ABUJAR:
MINERALS    WEST AFRICA’S
           NEXT GOLD MINE

                    ASX:TIE
DISCLAIMER
This presentation prepared by Tietto Minerals Limited (“Company”) does not                 intentions, expectations or plans will be achieved either totally or partially or that   The information in this presentation that relates to Ore Reserves was prepared by
purport to contain all the information that a prospective investor may require in          any particular rate of return will be achieved. Given the risks and uncertainties        RPM and released on the ASX platform on 6 April 2021. The Company confirms
connection with any potential investment in the Company. You should not treat the          that may cause the Company’s actual future results, performance or                       that it is not aware of any new information or data that materially affects the Ore
contents of this presentation, or any information provided in connection with it, as       achievements to be materially different from those expected, planned or                  Reserves in this publication. The Company confirms that all material assumptions
financial advice, financial product advice or advice relating to legal, taxation or        intended, recipients should not place undue reliance on these intentions,                and technical parameters underpinning the estimates continue to apply and have
investment matters. No representation or warranty, express or implied, is made as          expectations, future plans, strategy and prospects. The Company does not                 not materially changed. The Company confirms that the form and context in which
to the fairness, accuracy, completeness or correctness of the information, opinions        warrant or represent that the actual results, performance or achievements will be        the RPM findings are presented have not been materially modified
and conclusions contained in this presentation. This presentation is provided              as expected, planned or intended.
expressly on the basis that you will carry out your own independent inquiries into
                                                                                                                                                                                    The information in the report that relates to Ore Reserves for the Abujar Gold
the matters contained in the presentation and make your own independent
                                                                                           COMPETENT PERSONS STATEMENT                                                              Project is based on information compiled and reviewed by Mr. Igor Bojanic, who is
decisions about the affairs, financial position or prospects of the Company. The
                                                                                           The information in this presentation that relates to Exploration Targets and             a Fellow of the Australasian Institute of Mining and Metallurgy, and is an employee
Company reserves the right to update, amend or supplement the information at
                                                                                           Exploration Results is based on information compiled by Mr Mark Strizek, a               of RPM. Mr. Igor Bojanic has sufficient experience, which is relevant to the style of
any time in its absolute discretion (without incurring any obligation to do so). To the
                                                                                           Competent Person who is a Member or The Australasian Institute of Mining and             mineralisation and type of deposit under consideration and to the activity, which he
maximum extent permitted by law, none of the Company its directors, employees
                                                                                           Metallurgy. Mr Strizek is a non-executive director of the Company. Mr Strizek has        has undertaken to qualify as a Competent Person, as defined in the 2012 Edition
or agents, advisers, nor any other person accepts any liability, including, without
limitation, any liability arising from fault or negligence on the part of any of them or   sufficient experience that is relevant to the style of mineralisation and type of        of the Australasian Code for the Reporting of Mineral Resources and Ore
any other person, for any loss arising from the use of this presentation or its            deposit under consideration and to the activity being undertaking to qualify as a        Reserves. Mr. Igor Bojanic is not aware of any potential for a conflict of interest in
contents or otherwise arising in connection with it. This presentation is not an offer,    Competent Person as defined in the 2012 edition of the “Australasian Code for            relation to this work for the Client. The estimates of Ore Reserves presented in this
invitation, solicitation or other recommendation with respect to the subscription for,     Reporting of Exploration Results, Mineral Resources and Ore Reserves”. Mr                Statement have been carried out in accordance with the “Australasian Code for
purchase or sale of any security, and neither this presentation nor anything in it         Strizek consents to the inclusion in the announcement of the matters based on            Reporting of Exploration Results, Mineral Resources and Ore Reserves”
shall form the basis of any contract or commitment whatsoever.                             his information in the form and context in which it appears. Additionally, Mr Strizek    (December, 2012).
                                                                                           confirms that the entity is not aware of any new information or data that materially
FUTURE MATTERS                                                                             affects the information contained in the ASX releases referred to in this                COMPLIANCE STATEMENT
This presentation may contain forward looking statements that are subject to risk          presentation.
factors associated with mineral exploration, mining and production businesses. It is                                                                                                This report contains information extracted from ASX market announcements
believed that the expectations reflected in these statements are reasonable but            The information in this presentation that relates to Mineral Resources was               reported in accordance with the 2012 edition of the "Australasian Code for
they may be affected by a variety of variables and changes in underlying                   prepared by RPM Global and released on the ASX platform on 26 October 2020.              Reporting of Exploration Results, Mineral Resources and Ore Reserves" ("2012
assumptions which could cause actual results or trends to differ materially,               The Company confirms that it is not aware of any new information or data that            JORC Code") and available for viewing at www.tietto.com. Includes results
including but not limited to price fluctuations, actual demand, currency fluctuations,     materially affects the Minerals Resources in this publication. The Company               reported previously and published on ASX platform, 16 January 2018, 27 March
drilling and production results, reserve estimations, loss of market, industry             confirms that all material assumptions and technical parameters underpinning the         2018, 23 April 2018, 8 May 2018, 7 June 2018, 4 October 2018, 1 November
competition, environmental risks, physical risks, legislative, fiscal and regulatory       estimates continue to apply and have not materially changed. The Company                 2018, 28 November 2018, 31 January 2019, 26 February 2019, 12 March 2019,
changes, economic and financial market conditions in various countries and                 confirms that the form and context in which the RPM Global’s findings are                19 March 2019, 9 April 2019, 9 May 2019, 30 May 2019, 9 July 2019, 26 July
regions, political risks, project delay or advancement, approvals and cost                 presented have not been materially modified.                                             2019, 2 October 2019, 24 October 2019, 12 December 2019, 23 January 2020, 20
estimates.                                                                                                                                                                          February 2020, 10 March 2020, 24 March 2020, 2 April 2020, 9 April 2020, 23
                                                                                           The information in this report that relates to Mineral Resources is based on             April 2020, 3 June 2020, 9 June 2020, 25 June 2020, 2 July 2020, 21 July 2020 20
This presentation also contains reference to certain intentions, expectations,                                                                                                      July 2020, 29 July 2020, 19 August 2020, 9 September 2020, 24 September 2020,
                                                                                           information evaluated by Mr Jeremy Clark who is a Member of The Australasian
future plans, strategy and prospects of the Company. Those intentions,                                                                                                              26 October 2020, 11 December 2020, 18 January 2021, 12 February 2021, 23
                                                                                           Institute of Mining and Metallurgy (MAusIMM) and who has sufficient experience
expectations, future plans, strategy and prospects may or may not be achieved.                                                                                                      February 2021, 23 March 2021, 6 April 2021, 8 April 2021, 20 April 2021, 3 May
                                                                                           relevant to the style of mineralisation and type of deposit under consideration and
They are based on certain assumptions, which may not be met or on which views                                                                                                       2021, 6 May 2021, 11 May 2021, 21 May 2021, 27 May 2021, 11 June 2021, 16
                                                                                           to the activity which he is undertaking to qualify as a Competent Person as defined
may differ and may be affected by known and unknown risks. In particular, there                                                                                                     June 2021 and 12 July 2021. The Company confirms that all material assumptions
                                                                                           in the 2012 edition of the “Australasian Code for Reporting of Exploration Results,
is a risk that the Company will not be able to expand or upgrade its existing                                                                                                       and technical parameters underpinning the Mineral Resources and Ore Reserves
                                                                                           Mineral Resources and Ore Reserves”. Mr Clark is an associate of RPM and he
JORC resource. The performance and operations of the Company may be                                                                                                                 continue to apply and have not materially changed. The Company confirms that it
                                                                                           consents to the inclusion of the estimates in the report of the Mineral Resource in
influenced by a number of factors, many of which are outside the control of the                                                                                                     is not aware of any new information or data that materially affects the information
                                                                                           the form and context in which they appear.
Company. No representation or warranty, express or implied, is made by the                                                                                                          included in the previous announcements.
Company, or any of its directors, officers, employees, advisers or agents that any

                                                                                                                                                                                                                                                                   2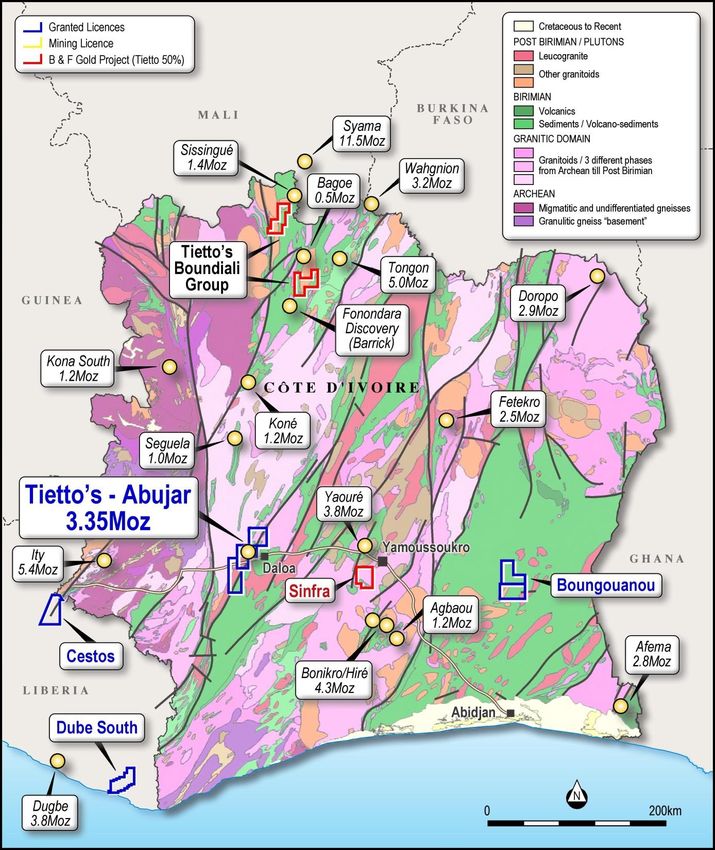
DISCLAIMER
Production Targets Cautionary Statement                                                                                                 The Scoping Study is based on the material assumptions outlined elsewhere in this announcement. These include
                                                                                                                                        assumptions about the availability of funding. While Tietto considers all the material assumptions to be based on reasonable
                                                                                                                                        grounds, there is no certainty that they will prove to be correct or that the range of outcomes indicated by the Scoping Study
The Production Target and forecast financial information derived from the Production Target referred to in this ASX release
                                                                                                                                        will be achieved.
(Abujar open pit PFS) is based on 70% Probable Ore Reserves and 30% Inferred Mineral Resources. The modifying factors
used in the estimation of the Ore Reserve were also applied to the Inferred Resources.
                                                                                                                                        To achieve the range outcomes indicated in the Scoping Study, additional funding will likely be required. Investors should
                                                                                                                                        note that there is no certainty that Tietto will be able to raise funding when needed. It is also possible that such funding may
There is a low level of geological confidence associated with Inferred Mineral Resources and there is no certainty that further
                                                                                                                                        only be available on terms that dilute or otherwise affect the value of the Tietto’s existing shares. It is also possible that Tietto
exploration work will result in the determination of Indicated Mineral Resources or that the Production Target itself will be
                                                                                                                                        could pursue other ‘value realization’ strategies such as sale, partial sale, or joint venture of the Abujar Gold Project. If it
realised.
                                                                                                                                        does, this could materially reduce Tietto’s proportionate ownership of the Abujar Gold Project.

The material assumptions used in the estimation of the Production Target and associated forecast financial information are
                                                                                                                                        The Company has concluded it has a reasonable basis for providing the forward-looking statements included in this
set out in the Ore Reserve Statements accompanying this release.
                                                                                                                                        announcement and believes that it has a reasonable basis to expect it will be able to fund the development of the Expanded
                                                                                                                                        Project. Given the uncertainties involved, investors should not make any investment decisions based solely on the results of
The Ore Reserve and Mineral Resource estimates underpinning the Production Target were prepared by a Competent                          the Scoping Study.
Person in accordance with the JORC Code 2012.

Cautionary Statement

The Scoping Study referred to in this announcement has been undertaken to determine the potential viability of an Expanded
Project (Expanded Project) development of the Abujar Gold Project in Cote d’Ivoire comprising the AG open pit mine and
process plant and an open pit at APG and an underground development at AG below the open pit. The Scoping Study for the
Expanded Project has been prepared to an intended accuracy level of ±40%. The results should not be considered a profit
forecast or production forecast.

The Scoping Study is a preliminary technical and economic study of the potential viability of the Expanded Project. In
accordance with the ASX Listing Rules, the Company advises it is based on low-level technical and economic assessments
that are not sufficient to support the estimation of Ore Reserves for the APG open pit and the AG underground. Further
evaluation work is planned with over 25,000m of infill diamond drilling already being complete and appropriate studies are
required before Tietto will be able to estimate any Ore Reserves or to provide any assurance of an economic development
case of the Expanded Project.

Approximately 57% of ounces making up the Expanded Project production targets are Probable Mineral Reserves from the
AG open Pit, 17% of ounces within the AG Open Pit are Inferred Mineral Resource category. The APG open pit accounts for
14% of ounces making up the production target and these are currently in the Inferred Mineral Resource category. The AG
underground is made up of Indicated and Inferred Mineral Resources; 3% of ounces in the production target come from AG
underground ounces in the Indicated Mineral Resources category and 8% of the ounces are Inferred Mineral Resources.

The Company has concluded that it has reasonable grounds for disclosing a production target which includes an amount of
Inferred Mineral Resource. However, there is a low level of geological confidence associated with Inferred Mineral Resources
and there is no certainty that further exploration work (including infill drilling underway) on the Abujar deposit will result in the
determination of additional Indicated Mineral Resources or that the production target itself will be realized.

                                                                                                                                                                                                                                                                      3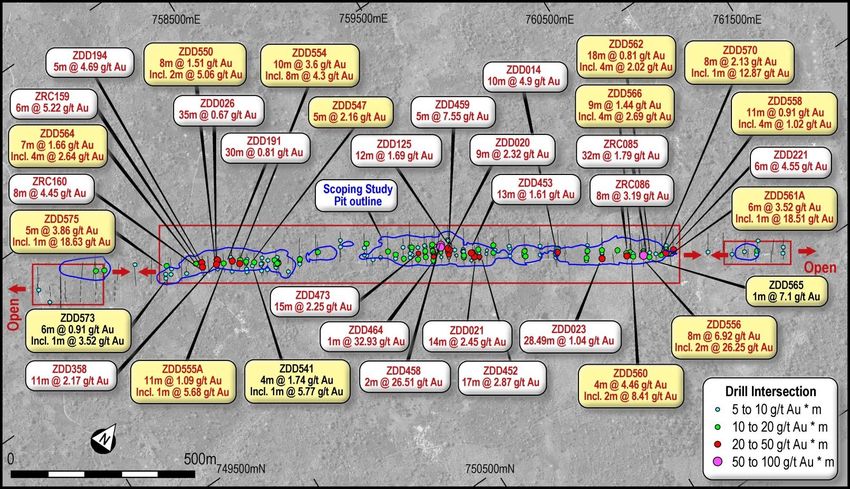
FAST TRACKING DEVELOPMENT OF ABUJAR
➢ Côte d'Ivoire – premier mining investment destination
➢ Growing 3.35 million ounce gold open pit opportunity
➢ Robust 3.5Mtpa PFS (forecast 200,000oz in first year) delivered April 2021
➢ DFS on track and expected end of Q3 2021
➢ Clear pathway to development:
   ➢ Environmental Approval secured and Mining licence granted (120.36km2)
   ➢ Chief Operating Officer appointed – Matthew Wilcox ex WAF (Sanbrado)
➢ Well funded - A$45M* in cash
➢ Aggressive exploration continues throughout 2021:
     ➢ Numerous drill ready targets defined – “severely unexplored”

     ➢ Artisanal workings dotted along 70km mineralised corridor

     ➢ 6 Company owned diamond drill rigs drilling at US$35/m
*June 30 unaudited                                                             4
CORPORATE SNAPSHOT

CAPITAL STRUCTURE (ASX:TIE)
A$0.32                       456M                   75M                       A$145M                                              A$45M                                                       A$100M
Share price (31 August 21)   Shares on issue        Options on issue          Market Capitalisation                               Cash (June 30 unaudited)                                    Enterprise Value

SHAREHOLDERS                                                                                        SHARE PRICE MOVEMENT
                                                                             70                                                                                                                          7.00

                                  Other                                      60                                                                                                                          6.00
                                  19%
                                                                             50                                                                                                                          5.00

                                                                             40                                                                                                                          4.00

                                                                                                                                                                                                                Millions
                                                                       cps
                                                                             30                                                                                                                          3.00
                                          Hongkong Ausino
                                            Investment
                                                                             20                                                                                                                          2.00
                                               9.8%
                                                                             10                                                                                                                          1.00
                                      Directors
  Remaining                             7.5%                                 0                                                                                                                           -
   Top 20

                                                                                                                                                 Mar 21
                                                                                  Aug 20

                                                                                                    Oct 20

                                                                                                                               Jan 21

                                                                                                                                                          Apr 21

                                                                                                                                                                            Jun 21
                                                                                                                                                                   May 21

                                                                                                                                                                                                Aug 21
                                                                                           Sep 20

                                                                                                             Nov 20

                                                                                                                      Dec 20

                                                                                                                                        Feb 21

                                                                                                                                                                                     Jul 21
    63.3%

                                                                                                                                                                                                                5
DIRECTORS AND RESEARCH

                                         DIRECTORS                              RESEARCH*

                                         FRANCIS         DR CAIGEN              CANACCORD
                                         HARPER          WANG                   Paul Howard
                                         Non-Executive   Managing
                                         Chairman        Director and Founder
                                                                                EUROZ HARTLEYS
                                         DR PAUL         MARK                   Mike Millikan
                                         KITTO           STRIZEK
                                         Technical       Executive              FOSTER
                                         Director        Director               Mark Fichera

                                         HANJING
                                         XU
                                         Non-Executive
                                         Director

* Further information: www.tietto.com                                                           6
UNLOCKING CÔTE D’IVOIRE’S GOLD
       Increasing Gold                   32.6t of gold produced
       Production                        from 5 mines in 2019                  Stable, vastly
                                                                              under-explored
                                                                                  mining
                                         Hosts West Africa’s largest
       Extensive                                                                jurisdiction
                                         share of greenstone belts for
       Greenstone Belts                  prospective gold (~ 34%)

       Strong Government                 Tenements granted for 4 years
                                         with two 3-year extensions plus
       Support                           2-year special extension available

                                         25% corporate tax rate and
       Favorable Fiscal
       Terms                             5% Gov’t Royalty^

       Outstanding                       One of Africa’s most well-developed
       Infrastructure                    nations with outstanding infrastructure

                                         Cote d’Ivoire gold operations include
       Mining Activity                   Endeavour’s Ity, Barrick’s Tongon mine &
       Ramping Up                        Perseus’ Sissingué and Yaouré mines

^ 5% Gov’t Royalty US$1,600 – US$2,000                                                          7
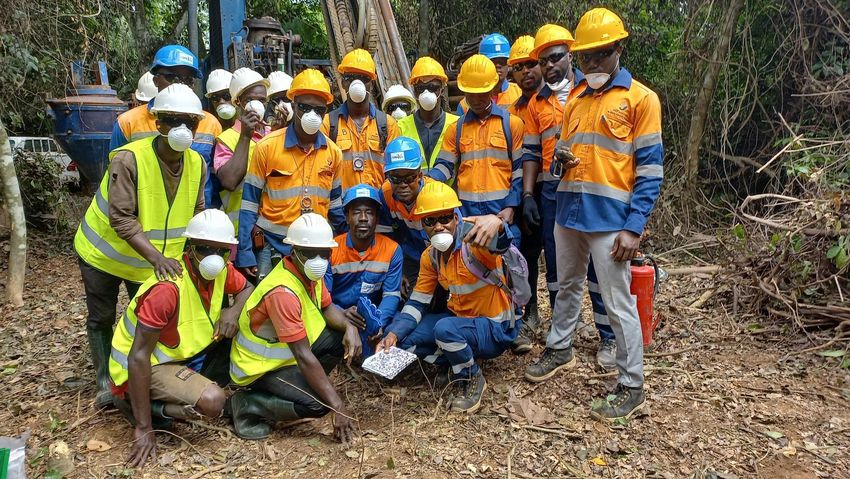
OUR TEAM IN ACTION - A DAY IN THE LIFE OF ABUJAR

                                                   8
DRILLING OUR DOLLARS FURTHER
➢ We have significantly reduced drilling costs
   for our shareholders by operating our own
   diamond drill rigs
➢ We drill for ~US$35/m. Contract DD rates
   can range from US$75/m to over US$300/m
➢ Tietto has now drilled over 154,000m since
   we purchased our first rig in July 2018:
    ➢ Saving shareholders over US$16.3M*
➢ Low footprint – rigs can be carried in to site
➢ 6 drill rigs are delivering high production
   rates ~10,000m/month

* After deducting drill rig purchase costs and assuming US$150/m comparison contract rate   9
RAPIDLY GROWING GOLD RESOURCES
                                                                                                         DFS
       Abujar Gold Project - JORC Resources
Mineral Resource Estimates - RPM Global (July 2021)*                                         PFS        3.35Moz
                                                                                             3.02Moz
                                  Total
Deposit     Class     Quantity               Au
                                 Au (g/t)
                       (Mt)                 (Moz)                              2.15Moz
          Indicated     35.0       1.5      1.65                                                        1.85Moz
                                                                   1.70Moz
  AG      Inferred      15.3       1.6      0.80
                                                                                             1.24Moz
            Total       50.3       1.5      2.45
                                                                               0.86Moz
          Indicated     8.4        0.7      0.20       0.70Moz
  APG     Inferred      28.4       0.7      0.67
            Total       36.7       0.7      0.87
   SG     Inferred      0.5        1.4      0.02       Jan 2018     Apr 2019   Nov 2019     Oct 2020     Jul 2021
                                                           AG Indicated        APG Indicated       AG Inferred
    Grand Total         87.5       1.2      3.35
                                                          APG Inferred         SG Inferred

                                                                                                                10
ABUJAR GOLD PROJECT
➢ 3 contiguous tenements totalling 1,114km2
➢ Middle tenement hosts JORC Resource of 87.5Mt at 1.2g/t Au for 3.35Moz
➢ Indicated Resources 43.4Mt at 1.3 g/t Au for 1.85Moz from two deposits
➢ JORC 2012 Resource contained within 3 deposits:
➢ AG – 50.3Mt at 1.5 g/t Au for 2.45Moz:
• 35.0Mt at 1.5 g/t Au for 1.65Moz (Indicated)
• 25.3Mt at 1.6 g/t Au for 1.06Moz (Inferred)
➢ APG – 36.7Mt at 0.7 g/t Au for 0.87Moz:
• 8.7Mt at 0.7 g/t Au for 0.20Moz (Indicated)
• 28.4Mt at 0.7 g/t Au for 0.67Moz (Inferred)
➢ SG – 0.5Mt at 1.4 g/t Au for 0.02Moz (Inferred)
➢ 70km strike length, multiple targets, less than 10% explored
➢ Tietto’s fleet of 6 DD rigs achieving low cost drilling @ ~$35/m
➢ Completing ~10,000m of diamond drilling at Abujar per month
11AG DEPOSIT
➢ Robust high-grade core 1.7Moz at 2.42 g/t Au
➢ Notable results include:
• 7m @ 57.79 g/t Au from 76m
• 7m @ 41.76 g/t Au from 55m
• 21m @ 13.02 g/t Au from 215m
• 16m @ 16.31 g/t Au from 111m
• 2m @ 113.3 g/t Au from 83m
• 18m @ 11.72 g/t Au from 39m
• 6m @ 9.35g/t Au from 317m
• 5m @ 17.22 g/t Au from 374m
➢ More drilling underway targeting:
• Conversion of Indicated to Measured
• Resource growth – system still open
12APG DEPOSIT
Demonstrated potential for satellite open pit mining operation
➢ Mineral Resource: 36.7Mt at 0.7 g/t Au for 0.87Moz
• 8.7Mt at 0.7 g/t Au for 0.20Moz (Indicated)
• 28.4Mt at 0.7 g/t Au for 0.67Moz (Inferred)
➢ Wide gold mineralisation system defined over 5km strike
➢ Deep oxidation profile down to 50m from surface
➢ Notable results include:
• 32m @ 1.79 g/t Au from 20m
• 8m @ 6.92 g/t Au from 27m
• 17m @ 2.87 g/t Au from 21m
• 5m @ 7.55 g/t Au from 15m
➢ Infill drilling – targeting conversion of Inferred into Indicated
Mineral Resources
13PIPELINE OF PROSPECTS
➢ Aggressive drilling programs designed to drive continued resource
growth throughout 2021
➢ Tietto’s fleet of diamond rigs deliver rapid resource growth with
some of the gold sectors lowest costs
Tenement Resource Definition Target Testing Target Definition Reconnaissance
Middle 1 AG + AG Deeps 6 Mandanou 10 Koflankro 21 Gludehi NW
2 Pischon 7 Mandanou Pischon Link 11 Vingt-Deux (22) 22 NW regional
3 Golikro 8 Gamina North 13 Agokro* 23 SE regional*
4 Pischon Golikro Link 9 Gamina Central 16 Potoco
5 AG South 14 Zoukpangbeu North* 17 Gludehi East
12 GGLink (from Gludehi to Gamina) 15 Zoukpangbeu South* 18 Mandanou East
19 Link MP East
20 Pischon East
North 24 Gamina North*
25 Gamina South
South 26 Ahouphouekro*
27 Bassaraguhé*
28 Detroya*
29 Gorodi*
30 Nianabeh*
Targeting over
100,000m of
diamond
in 2021
14ABUJAR – ON TRACK TO BE WEST AFRICA’S NEXT GOLD MINE
Abujar Gold Project open pit 3.5Mtpa CIL Pre-Feasibility Study (PFS)
delivered in April 2021 demonstrates:
➢ Forecast 200,000 ounces gold in first year of production
➢ 168,000 ounces per annum over the first 6 years of project*
➢ PFS was based on October 2020 Resource model
➢ Maiden Open Pit Probable Reserves of 15.7Mt ROM at 1.7 g/t Au for
860,000oz
➢ LOM mining inventory inclusive of Ore Reserves of 22.9Mt at 1.5 g/t Au for
1.1Moz for 8 years mining
➢ Robust PFS economics indicate project will support substantial debt funding
➢ All mining and environmental approvals secured for Abujar; negotiations with
Ivoirian Government on Abujar Mining Convention underway with ratification
expected this Quarter High tempo
➢ Substantial upside demonstrated by Expanded Project^ 32.8Mt at 1.4 g/t Au
for 1.49Moz for 10 years mining exploration
➢ DFS tracking for delivery by end of Q3 2021; based on July 2021 Mineral
Resource Estimate which now includes 43.4Mt at 1.3 g/t Au for 1.85Moz of
continues
Indicated
*The Pre-Feasibility Study was prepared at a ±25% level of accuracy; these production targets must be read in conjunction with the production targets cautionary statement. The LOM plan contains approximately 30% Inferred Mineral Resources. An Inferred Mineral Resource has a lower level of
confidence than an Indicated Mineral Resource and there is no certainty that further exploration work will result in the conversion of the material into an Indicated Mineral Resource. 15
^The Expanded Project (Expanded Project) scoping study of the APG open pit and the AG underground have been prepared to an intended accuracy level of ±40% and must be read in conjunction with the cautionary statement.ABUJAR PRE-FEASIBILITY STUDY
Stand alone open pit and CIL process plant development:
➢ 3.5Mtpa milling capacity (4Mtpa Metso mill has been secured for project)
➢ Simple flowsheet - single stage crushing then SAG Mill with gravity and CIL
for gold recovery (96% assumed in study)
➢ Stage 1 tailings capacity of 30Mt (TSF)
➢ Upgrade of 18km site access road (underway)
➢ Construct ~34km 90kV grid connection to Daloa (low cost Hydro grid power
US$0.12/kWh)
➢ Conventional contractor fleet selection with up to 5 excavators (3 x 250t and
2 x 110t) and an average of 33 x 90t trucks required for prime material
movement up to 40Mtpa
➢ Permitting and Licencing secured
• Environmental Approval (ESIA approved October 2020)
• Mining Licence – 120.36km2 granted December 2020
16ABUJAR METALLURGY
Other
Process Material AG Deposit(1)
➢ AG met sample program confirms very high Projects(2)
gold recoveries and low-cost processing Oxide 64.4% 5% - 30%
Gravity Trans 82.6% 15% - 40%
➢ Excellent gold recoveries at coarse grind Fresh 83.6% 38%
sizes - 96% (180 µm) to 98% (106 µm) for Gold Recovery(3) Oxide 98.5% 90% - 95%
fresh ore
CIL Trans 99.5% 83% - 95%
➢ Optimum grind sizes between 106-150 µm - Fresh 99.1% 90% - 95%
simple single‐stage crusher with SAG mill
circuit (SSAG) Oxide 0.02 0.003 - 0.08
Bond Abrasion Index (Ai) Trans 0.06 0.17 - 0.28
➢ PFS using 115 µm grind size:
Fresh 0.28 0.24 - 0.46
• Reduced energy use
Oxide * 3.7 – 8.63
• Greater throughput Bond Rod Mill Work Index (Rw i) Trans 8.5 16.6 – 19.1
Fresh 13.17 19.4 – 22.1
• Lower operating cost
Oxide * 5.4 – 6.1
➢ DFS due Q3 2021 Trans 8.95 14.7 – 16.23
Bond Ball Mill Work Index (Bw i)
1. ASX release 9 April 2020
2. Various NI 43-101 FS 2015 – 2019 (CDV, PRU, WAF) Fresh 12.02 17.78 – 18.9
3. ASX release 14 May 2020 and 9 July 2020
17ABUJAR PFS CAPITAL & OPERATING COST ESTIMATE*
➢ Capital cost estimate is based upon an EPCM Capital Cost - Development Subtotal (US$) Contingency (US$) Grand Total (US$)
3.5Mtpa Process Plant $76.7M $11.9M $88.6M
approach
Infrastructure (TSF, Plant Vehicles, Mobile
➢ Operating cost estimate has been prepared Equipment, Process Plant Infrastructure, $51.4M $9.2M $60.6M
Powerline and Camp)
with an operating throughput of 3.5 Mtpa Owners Costs (Insurance, Construction
$24.6M $3.7M $28.3M
Facilities, First Fills and Capital Spares)
➢ DFS due in Q3 2021 will: Total Plant and Infrastructure $152.7M $24.8M $177.5M
Mine Contractor Establishment $2.5M $0.6M $3.1M
• Optimise mining schedule and mill Pre-production Mining $39.4M $9.9M $49.3M
throughput around 4Mtpa throughput Total $194.6 $35.3M $230M
(unused mill has been purchased) Operating Cost – Life of Mine (LOM) Cost (US$) LOM Cost / Ore t LOM Cost /Oz US$
Mining $527M 23 490
• Focus on reducing scale of pre- Processing and Maintenance $211.7M 9.24 197
production mining G&A $71.7M 3.13 67
Sustaining Capital $16M 0.69 14.9
• Model throughput of ox/trans material Selling $6.4M 0.28 6
Royalties $68.9M 3.01 64
through mill (currently treated same as Total $901.7M 39.3 839
fresh). Potential to lower processing
$/ore tonne (particularly in the first 2-3
years of operations)
* Base case capital and operating cost estimate has been prepared as a preliminary feasibility level study and are presented in United States Dollars (US$) to an accuracy level of +/-25%, as at Quarter 1 2021
(Q1/2021) 18ABUAJR EXPANDED PROJECT AG OP PFS, SCOPING STUDY APG OP & AG UG*
Expanded Project stated on a 100% basis and an average gold price of $1,491/oz (all amounts in US$) Various Gold Price (pre-tax) 1200 1300 1491 1800 1900
Average Production Y1-3 182,000oz/yr Net present value (NPV (5%)) $141 M $242 M $432 M $720 M $820 M
Average Production LOM (Y1-6) 168,000oz/yr Internal rate of return (IRR) 21% 31% 54% 73% 81%
Revenue LOM $2,141M Payback in Years (undiscounted) 4.7 3.7 2.4 2.2 2.1
Average Cash Costs of $863/oz (including royalties) LOM avg. annual cash flow $23 M $36 M $61 M $96 M $109 M
Production Costs LOM
Average All-in Sustaining Costs (AISC) of $903/oz
LOM cumulative cash flow
Pre-tax IRR of 54% and 2.4 year payback on initial $242 M $380 M $629 M $1,031 M $1,166 M
capital (undiscounted)
IRR
After-tax IRR of 43% and 2.8 year payback on initial
capital
Pre-tax NPV (5%) of $432M Various Gold Price (post-tax) 1200 1300 1491 1800 1900
NPV
Post-tax NPV (5%) of $311M Net present value (NPV (5%)) $92 M $168 M $311 M $527 M $602 M
Pre-tax Free Cashflow of $599M Internal rate of return (IRR) 17% 25% 43% 59% 66%
Free Cashflow LOM
Post-tax Free Cashflow of $461M Payback in Years (undiscounted) 5.2 4.1 2.8 2.4 2.2
Pre-Production capital of $230M (including pre- LOM avg. annual cash flow after
production mining and contingency). Underground $17 M $26 M $45 M $72 M $81 M
tax & capital
Capex development capital of $48.4M beginning from Year
6
LOM cumulative cash flow
$172 M $275 M $461 M $763 M $865 M
Remaining capital and closure costs of $48.1M
(undiscounted)
Project Life 12 years
Probable Mineral Reserves 15.7Mt ROM at 1.7 g/t Au for 860,000 ounces
Mineable quantities inclusive of Probable Mineral AG Open Pit: 22.9 Mt ROM at 1.5 g/t Au for 1,120,000
Reserves ounces at a strip ratio of 8.2 t:t
Scoping Study Production Targets APG Open Pit: 8.1 Mt ROM at 0.8 g/t Au for 209,000
ounces at a strip ratio of 3.3 t:t
AG Underground: 1.8Mt ROM at 2.8 g/t Au for
168,000 ounces
LOM Recoveries 96% for 1,436,000 ounces of gold recovered
• Expanded Project scoping study of the APG open pit and the AG underground have been prepared to an intended accuracy level of ±40% and must be read in conjunction with the cautionary statement. Financial model
assumes project start from beginning October 2021 . 19THE RIGHT TEAM TO BUILD ABUJAR
➢ Matt Wilcox, our Chief Operating Officer is tasked with managing
the team building our first gold mine at Abujar
➢ Mr Wilcox most recently was responsible for the development of
West African’s (ASX: WAF) 2.6Mtpa Sanbrado Gold Mine, which
was completed in March 2020, ahead of schedule and under
budget
➢ Prior to this he was Project Director of Nord Gold’s:
➢ 12Mtpa Gross Gold Project in Siberia, Russia
➢ 4Mtpa Bissa Gold Project and 8Mtpa Bouly Gold Project, both
located in Burkina Faso
➢ Matt’s build team:
➢ Guillaume Hubert – Earthworks Manager
➢ Daniel Kotzee – Construction Manager
➢ Hesbon Okwayo – Commercial Manager
➢ Beatrice Godde - HSE Superintendent
20GOLD STANDARD PROJECT EXECUTION IN WEST AFRICA*
PROJECT COMPANY COUNTRY SCHEDULE BUDGET
Houndé Endeavour Burkina Faso Ahead Under
Ity CIL Endeavour Côte d’Ivoire Ahead Under
Yaramoko Roxgold Burkina Faso Ahead Under
Wahgnion Teranga Burkina Faso Ahead Under
Sissingué Perseus Côte d’Ivoire Ahead On
Bissa1 Nordgold Burkina Faso Ahead On
Bouly1 Nordgold Burkina Faso Ahead Under
Fekola B2 Mali Ahead On
Mako Resolute/Toro Senegal Ahead On
Sanbrado1 WAF Burkina Faso Ahead Under
Yaouré Perseus Côte d’Ivoire Ahead Under
*After Orezeone presentation 28 January 2021 and company release 21CURRENT DEVELOPMENT TIMETABLE*
2021 2022 2023
Q1 Q2 Q3 Q4 Q1 Q2 Q3 Q4 Q1 Q2 Q3 Q4
Mining and environmental permits approved √
PFS completed √
Further resource / reserve and definition drilling √
DFS Update reserves and optimisation
Publish DFS results
Award of FEED and Order Mill Package (Mill secured) √
Detailed design and commencement of early works
Formal Investment Decision (FID)
Project financing
Debt drawdown
Tender Mining and contractor Mobilisation
Commencement of construction major works
Pre stripping and ore stockpiling
First gold and commercial production
*This timetable is indicative only and may change. Please refer to key risks that may cause changes to the timetable. 22APG HEAP LEACH – POTENTIAL TO ADD OUNCES TO PRODUCTION PROFILE*
➢ Four 10-kilogram closed cycle column leach tests
conducted on two transitional and two fresh composite
samples from APG
➢ Samples crushed to 14mm and loaded into 150mm by
1.5-meter-tall PVC columns for 120 days
➢ Excellent recoveries achieved from sighter program
➢ Initial landform analysis by Knight Piésold indicates
potential for first stage 40Mt heap leach (4 by 10m lifts)
➢ PFS testwork program to
assess potential for heap Packed
Leach Time Column Head Assay Recovered Gold Cement
leach to add to CIL Sample ID
Days
Height
Slump % g/t Au Gold, g/t Au Recovery % (Kg/t)
production expected to be (cm) start
completed in 2021 ZDD 153 trans 120 67 9 0.40 0.36 90 10
ZDD 174 trans 120 79 8.8 0.88 0.63 71.6 10
ZDD 157 fresh 120 49 1.5 0.40 0.36 90 0
ZDD 179 fresh 120 65 1.5 0.51 0.45 88.2 0
* Sighter level testwork performed by Intertek Ghana 23EMERGING WEST AFRICAN GOLD DEVELOPER
Growing 3.35Moz Aggressive exploration drilling to drive Funded for 2021 work program,
open pit gold resource resource growth continues in 2021 strong shareholder base
Large scale DFS underway
Catalyst rich
open pit opportunity optimise mine and mill
2 4 17CONTACT US:
Tietto Minerals
+61 8 9331 6710 +61 428738385 +61 431084305
admin@tietto.com
www.tietto.comAPPENDIX A
Abujar Gold Project - JORC Resources
Mineral Resource Estimates - RPM Global (July 2021)*
Oxide Transition Fresh Total
Area Class Quantity Au Quantity Au Quantity Au Quantity Au
Au (g/t) Au (g/t) Au (g/t) Au (g/t)
(Mt) (Moz) (Mt) (Moz) (Mt) (Moz) (Mt) (Moz)
Indicated 0.5 1.2 0.02 2.1 1.3 0.09 32.4 1.5 1.54 35.0 1.5 1.65
AG Inferred 0.4 1.0 0.01 1.7 0.9 0.05 13.3 1.7 0.74 15.3 1.6 0.80
Total 0.9 1.1 0.03 3.8 1.1 0.14 45.6 1.5 2.28 50.3 1.5 2.45
Indicated 0.5 0.7 0.01 1.9 0.7 0.05 6.0 0.7 0.14 8.4 0.7 0.20
APG Inferred 1.2 0.7 0.03 5.2 0.7 0.11 22.0 0.7 0.52 28.4 0.7 0.67
Total 1.7 0.8 0.04 7.1 0.7 0.16 28.0 0.7 0.67 36.7 0.7 0.87
SG Inferred 0.04 0.7 0.00 0.1 0.8 0.00 0.4 1.6 0.02 0.5 1.4 0.02
Grand Total 2.6 0.9 0.07 11.0 0.9 0.30 74.0 1.2 2.97 87.5 1.2 3.35
Note:
1. The Mineral Resources has been compiled under the supervision of Mr. Jeremy Clark who is a sub-consultant to RPM and a Registered Member of the Australian Institute of Mining and Metallurgy. Mr. Clark has sufficient experience that is
relevant to the style of mineralisation and type of deposit under consideration and to the activity that he has undertaken to qualify as a Competent Person as defined in the JORC Code.
2. All Mineral Resources figures reported in the table above represent estimates at 12 July, 2021. Mineral Resource estimates are not precise calculations, being dependent on the interpretation of limited information on the location, shape and
continuity of the occurrence and on the available sampling results. The totals contained in the above table have been rounded to reflect the relative uncertainty of the estimate. Rounding may cause some computational discrepancies.
3. Mineral Resources are reported in accordance with the Australasian Code for Reporting of Exploration Results, Mineral Resources and Ore Reserves (The Joint Ore Reserves Committee Code – JORC 2012 Edition).
4. The Mineral Resources have been reported at a 100% equity stake and not factored for ownership proportions.
Statement of Mineral Resources by Deposit as at 12 July, 2021. Reported at 0.25 g/t Au cut off within pit shells; and 1.0 g/t Au cut off below the pit shells for AG, and reported at 0.3 g/t Au cut off within pit shells;
19
and 1.0 g/t Au cut off below the pit shells for APG, and 0.3 g/t Au to a depth of 120m for SGAPPENDIX A
Abujar Gold Project - JORC Resources
Mineral Resources by cut-off RPM Global (July 2021)*
COG AG Indicated AG Inferred APG Indicated APG Inferred Combined
Quantity Quantity Quantity Quantity Quantity
FROM Au (g/t) Au (Moz) Au (g/t) Au (Moz) Au (g/t) Au (Moz) Au (g/t) Au (Moz) Au (g/t) Au (Moz)
(Mt) (Mt) (Mt) (Mt) (Mt)
0.1 46.1 1.2 1.8 44.5 0.8 1.2 11.9 0.6 0.2 66.3 0.5 1.1 168.7 0.8 4.4
0.2 44.1 1.2 1.8 41.4 0.9 1.2 11.7 0.6 0.2 62.1 0.6 1.1 159.3 0.8 4.3
0.3 39.2 1.4 1.7 35.3 1.0 1.1 10.4 0.7 0.2 52.3 0.6 1.0 137.2 0.9 4.1
0.4 32.8 1.6 1.7 27.7 1.2 1.1 7.8 0.8 0.2 38.9 0.7 0.9 107.2 1.1 3.8
0.5 27.4 1.8 1.6 22.0 1.4 1.0 5.7 0.9 0.2 26.0 0.8 0.7 81.2 1.3 3.4
0.6 23.1 2.0 1.5 17.2 1.6 0.9 4.2 1.0 0.1 16.6 1.0 0.5 61.0 1.6 3.1
0.7 19.4 2.3 1.4 13.7 1.8 0.8 3.1 1.2 0.1 11.8 1.2 0.4 48.1 1.8 2.8
0.8 16.7 2.5 1.4 11.6 2.0 0.8 2.4 1.3 0.1 8.5 1.3 0.4 39.1 2.1 2.6
0.9 14.7 2.8 1.3 9.9 2.3 0.7 1.9 1.4 0.1 6.9 1.4 0.3 33.4 2.3 2.4
1 13.1 3.0 1.3 8.6 2.4 0.7 1.5 1.5 0.1 5.5 1.6 0.3 28.7 2.5 2.3
1.1 11.9 3.2 1.2 7.6 2.6 0.6 1.2 1.7 0.1 3.8 1.8 0.2 24.5 2.7 2.1
1.2 10.8 3.4 1.2 6.8 2.8 0.6 0.9 1.8 0.1 3.0 1.9 0.2 21.5 2.9 2.0
1.3 9.9 3.6 1.1 6.2 3.0 0.6 0.8 1.9 0.0 2.6 2.0 0.2 19.5 3.1 2.0
1.4 9.2 3.8 1.1 5.6 3.1 0.6 0.7 2.0 0.0 2.4 2.1 0.2 17.8 3.3 1.9
1.5 8.5 4.0 1.1 5.2 3.3 0.5 0.6 2.1 0.0 1.9 2.3 0.1 16.2 3.5 1.8
1.6 7.9 4.1 1.0 4.8 3.4 0.5 0.5 2.2 0.0 1.5 2.5 0.1 14.7 3.7 1.7
1.8 7.0 4.4 1.0 4.1 3.7 0.5 0.4 2.4 0.0 1.2 2.7 0.1 12.7 4.0 1.6
1.9 6.6 4.6 1.0 3.8 3.9 0.5 0.3 2.4 0.0 1.1 2.8 0.1 11.8 4.1 1.6
2 6.2 4.8 1.0 3.5 4.0 0.5 0.3 2.5 0.0 1.0 2.9 0.1 11.0 4.3 1.5
2.5 4.8 5.5 0.8 2.5 4.7 0.4 0.1 3.2 0.0 0.6 3.2 0.1 7.9 5.1 1.3
3 3.8 6.3 0.8 2.0 5.3 0.3 0.1 3.5 0.0 0.3 3.9 0.0 6.1 5.8 1.1
Global Mineral Resources reported at varying cut-off grades no pit shell constraint applied.
19APPENDIX A
Abujar Gold Project – JORC Ore Reserves
Abujar Gold Project Ore Reserves have been declared as a Probable Ore
Mineable quantities reported below include Inferred Resources and do not constitute an “Ore Reserve” as
Reserve of 15.7Mt ROM at 1.71 g/t Au for 860,000 ounces as set out in the estimated in accordance with the JORC Code. An Inferred Mineral Resource has a lower level of confidence
table below. than an Indicated Mineral Resource and there is no certainty that further exploration work will result in
the conversion of the material into an Indicated Mineral Resource from which Ore Reserves can be derived.
Ore Reserve Estimate as at 31 December 2020 An Ore Reserve Statement is presented in the Ore Reserves section of this report.
AG Open Pit Mineable Quantities for Scheduling (Dry basis)
Proved Probable Total
Quantity Au Au Quantity Au Au Quantity Au Au ROM
ROM Gold Contained
Deposit Mineable Waste Strip
Mt g/t Moz Mt g/t Moz Mt g/t Moz Pit Total (Mt) Grade ROM Gold
Quantity (Mt) Ratio (t:t)
(g/t) (k oz)
AG (Mt)
0 0.0 0 15.7 1.7 0.86 15.7 1.7 0.86
Deposit Main Pit 175.0 19.2 155.8 8.1 1.6 984
Total 0 0.0 0 15.7 1.7 0.86 15.7 1.7 0.86 Central
1.7 0.2 1.5 6.6 0.7 5
Pit
Notes: South Pit 28.3 2.6 25.7 9.9 1.3 108
The Ore Reserve has been compiled under the supervision of Mr. Igor Bojanic who is a full-time employee of
Satellite
RPM and a Fellow of the Australian Institute of Mining and Metallurgy. Mr. Bojanic has sufficient experience 6.7 0.9 5.8 6.3 0.7 22
that is relevant to the style of mineralisation and type of deposit and mining method under consideration and to Pits
the activity that he has undertaken to qualify as a Competent Person as defined in the JORC Code. Total 211.8 22.9 188.9 8.2 1.5 1,120
The following marginal cut-off grades determined based on a USD 1,459 per troy ounce gold price, and costs
and mining and metallurgical modifying factors estimated as part of a PFS.
Of the total 23 Mt of ore mined:
Marginal cut-off grades: Oxide 0.35 g/t Au, Transition 0.35 g/t Au and Fresh 0.35 g/t Au.
• Oxide comprises: 1 Mt, or only 4% of the total;
All Ore Reserve figures reported in the table above represent estimates at 31 December, 2020. Ore Reserve
• Transition comprises: 4 Mt or 16% of the total, and
estimates are not precise calculations, being dependent on the interpretation of limited information on the
• Fresh comprises: 18 Mt or 80% of the total
location, shape and continuity of the occurrence and on the available sampling results. The quantities contained
in the above table have been rounded to three significant figures to reflect the relative uncertainty of the
estimate. Rounding may cause values in the table to appear to have computational errors.
All Ore Reserve estimates are on a dry basis.
The Ore Reserves have been reported at a 100% equity stake and not factored for ownership proportions.
19APPENDIX B: AG Oblique Long Section
29APPENDIX C: REGIONAL PERMITS
Highly prospective – Significant land package
• Boundiali Group (North Côte d’Ivoire)
✓ Within 20Moz+ Au province
• Bongouanou (South-East Côte d’Ivoire)
✓ Underexplored province
✓ Fully granted permits
✓ Reconnaissance geochemical survey planned
• Sinfra (Central Côte d’Ivoire)
✓ Near & along same structure of the Yaouré 3.8Moz deposit
• Cestos (Central North Liberia)
✓ Underexplored province
✓ Near & along same structure of Ity 5.4Moz mine
• Dube South (South-East Liberia)
✓ Underexplored province
✓ Fully granted permit
30APPENDIX D
ABUJAR AG OPEN PIT PFS - PRODUCTION AND FINANCIAL HIGHLIGHTS*
Base case is stated on a 100% basis and an average gold price of $1,506/oz (all amounts in US$) Various Gold Price (pre-tax) 1200 1300 1506 1700 1900
Average Production Y1-3 182,000oz/yr Net present value (NPV (5%)) $122 M $202 M $363 M $502 M $659 M
Average Production LOM (Y1-6) 168,000oz/yr Internal rate of return (IRR) 20% 30% 53% 63% 81%
Revenue LOM $1,618M Payback in Years (undiscounted) 4.7 3.7 2.4 2.3 2.1
Average Cash Costs of $824/oz (including LOM avg. annual cash flow after
$24 M $37 M $62 M $84 M $109 M
royalties) tax & capital
Production Costs LOM LOM cumulative cash flow
Average All-in Sustaining Costs (AISC) of $206 M $309 M $509 M $694 M $898 M
$839/oz (undiscounted)
Pre-tax IRR of 53% and 2.4 year payback on Various Gold Price (post-tax) 1200 1300 1506 1700 1900
initial capital Net present value (NPV (5%)) $85 M $145 M $266 M $370 M $488 M
IRR
After-tax IRR of 42% and 2.8 year payback on Internal rate of return (IRR) 16% 24% 42% 51% 65%
initial capital Payback in Years (undiscounted) 5.2 4.1 2.8 2.6 2.2
Pre-tax NPV (5%) of $363M LOM avg. annual cash flow after
NPV $18 M $27 M $46 M $63 M $82 M
Post-tax NPV (5%) of $266M tax & capital
Pre-tax Free Cashflow of $509M LOM cumulative cash flow
Free Cashflow LOM $154 M $232 M $382 M $521 M $673 M
Post-tax Free Cashflow of $382M (undiscounted)
Pre-Production capital of $230M (including
Capex pre-production mining and contingency)
Sustaining capital and closure costs of $32M
Project Life 10 years
15.7Mt ROM at 1.7 g/t Au for 860,000
Probable Mineral Reserves
ounces
Mineable quantities inclusive of Probable 22.9 Mt ROM at 1.5 g/t Au for 1,120,000
Mineral Reserves ounces at a strip ratio of 8.2 t:t
LOM Recoveries 96% for 1,075,000 ounces of gold recovered
* Base case is stated on a 100% basis and an average gold price of $1,506/oz (all amounts in US$). Financial model assumes project start from beginning October 2021.
31APPENDIX D: AUD = US$0.76
ABUJAR AG OPEN PIT PFS - PRODUCTION AND FINANCIAL HIGHLIGHTS*
Base case is stated on a 100% basis and an average gold price of $1,982/oz (all amounts in A$) Various Gold Price (pre-tax) 1579 1711 1982 2237 2500
Average Production Y1-3 182,000oz/yr Net present value (NPV (5%)) $161M $266M $478M $661M $867M
Average Production LOM (Y1-6) 168,000oz/yr Internal rate of return (IRR) 20% 30% 53% 63% 81%
Revenue LOM $2,129M Payback in Years (undiscounted) 4.7 3.7 2.4 2.3 2.1
Average Cash Costs of $1,084/oz (including LOM avg. annual cash flow after
$32M $49M $82M $111M $143M
royalties) tax & capital
Production Costs LOM LOM cumulative cash flow
Average All-in Sustaining Costs (AISC) of $271M $407M $670M $913M $1182M
$1,104/oz (undiscounted)
Pre-tax IRR of 53% and 2.4 year payback on Various Gold Price (post-tax) 1579 1711 1982 2237 2500
initial capital
IRR Net present value (NPV (5%)) $112M $191M $350M $487M $642M
After-tax IRR of 42% and 2.8 year payback on
Internal rate of return (IRR) 16% 24% 42% 51% 65%
initial capital Payback in Years (undiscounted) 5.2 4.1 2.8 2.6 2.2
Pre-tax NPV (5%) of $478M LOM avg. annual cash flow after
NPV $24M $36M $61M $83M $108M
Post-tax NPV (5%) of $350M tax & capital
Pre-tax Free Cashflow of $670M LOM cumulative cash flow
Free Cashflow LOM $203M $305M $503M $686M $886M
Post-tax Free Cashflow of $503M (undiscounted)
Pre-Production capital of $303M (including
Capex pre-production mining and contingency)
Sustaining capital and closure costs of $42M
Project Life 10 years
15.7Mt ROM at 1.7 g/t Au for 860,000
Probable Mineral Reserves
ounces
Mineable quantities inclusive of Probable 22.9 Mt ROM at 1.5 g/t Au for 1,120,000
Mineral Reserves ounces at a strip ratio of 8.2 t:t
LOM Recoveries 96% for 1,075,000 ounces of gold recovered
* Base case is stated on a 100% basis and an average gold price of $1,982/oz (all amounts in A$). Financial model assumes project start from beginning October 2021.
32APPENDIX D: AUD = US$0.76
EXPANDED PROJECT AG OP PFS, SCOPING STUDY APG OP & AG UG*
Expanded Project stated on a 100% basis and an average gold price of $1,962/oz (all amounts in A$) Various Gold Price (pre-tax) 1579 1711 1962 2237 2500
Average Production Y1-3 182,000oz/yr Net present value (NPV (5%)) $186 M $318 M $568 M $816 M $1079 M
Average Production LOM (Y1-6) 168,000oz/yr Internal rate of return (IRR) 21% 31% 54% 64% 81%
Revenue LOM $2,817M Payback in Years (undiscounted) 4.7 3.7 2.4 2.3 2.1
Average Cash Costs of $1,136/oz (including royalties) LOM avg. annual cash flow after
Production Costs LOM
Average All-in Sustaining Costs (AISC) of $1,188/oz $30 M $47 M $80 M $111 M $143 M
tax & capital
Pre-tax IRR of 54% and 2.4 year payback on initial
capital LOM cumulative cash flow
IRR $318 M $500 M $828 M $1178 M $1534 M
After-tax IRR of 43% and 2.8 year payback on initial (undiscounted)
capital
Pre-tax NPV (5%) of $568M Various Gold Price (post-tax) 1579 1711 1962 2237 2500
NPV
Post-tax NPV (5%) of $409M Net present value (NPV (5%)) $121 M $221 M $409 M $595 M $792 M
Pre-tax Free Cashflow of $788M Internal rate of return (IRR) 17% 25% 43% 52% 66%
Free Cashflow LOM
Post-tax Free Cashflow of $607M Payback in Years (undiscounted) 5.2 4.1 2.8 2.6 2.2
Pre-Production capital of $303M (including pre- LOM avg. annual cash flow after
production mining and contingency). Underground $22 M $34 M $59 M $82 M $107 M
tax & capital
Capex development capital of $63.7M beginning from Year
6
LOM cumulative cash flow
$226 M $362 M $607 M $870 M $1138 M
Remaining capital and closure costs of $63.3M
(undiscounted)
Project Life 12 years
Probable Mineral Reserves 15.7Mt ROM at 1.7 g/t Au for 860,000 ounces
Mineable quantities inclusive of Probable Mineral AG Open Pit: 22.9 Mt ROM at 1.5 g/t Au for 1,120,000
Reserves ounces at a strip ratio of 8.2 t:t
Scoping Study Production Targets APG Open Pit: 8.1 Mt ROM at 0.8 g/t Au for 209,000
ounces at a strip ratio of 3.3 t:t
AG Underground: 1.8Mt ROM at 2.8 g/t Au for
168,000 ounces
LOM Recoveries 96% for 1,436,000 ounces of gold recovered
• Expanded Project scoping study of the APG open pit and the AG underground have been prepared to an intended accuracy level of ±40% and must be read in conjunction with the cautionary statement. Financial model
assumes project start from beginning October 2021 . 33You can also read