Bright and blind spots of water research in Latin America and the Caribbean
←
→
Page content transcription
If your browser does not render page correctly, please read the page content below
Hydrol. Earth Syst. Sci., 25, 4631–4650, 2021
https://doi.org/10.5194/hess-25-4631-2021
© Author(s) 2021. This work is distributed under
the Creative Commons Attribution 4.0 License.

Bright and blind spots of water research
in Latin America and the Caribbean
Alyssa J. DeVincentis1 , Hervé Guillon1 , Romina Díaz Gómez1 , Noelle K. Patterson1 , Francine van den Brandeler2,3 ,
Arthur Koehl1 , J. Pablo Ortiz-Partida1,4 , Laura E. Garza-Díaz1 , Jennifer Gamez-Rodríguez1 , Erfan Goharian1,5 , and
Samuel Sandoval Solis1
1 Department  of Land, Air and Water Resources, University of California, Davis, USA
2 Department  of Geography, Planning and International Development Studies,
University of Amsterdam, Amsterdam, the Netherlands
3 Greenleaf Communities, Chicago, USA
4 Union of Concerned Scientists, Oakland, USA
5 Department of Civil and Environmental Engineering, University of South Carolina, Columbia, USA

Correspondence: ajdevincentis@ucdavis.edu

Received: 19 February 2021 – Discussion started: 8 March 2021
Revised: 22 June 2021 – Accepted: 7 July 2021 – Published: 30 August 2021

Abstract. Water resources management in Latin America            investigated using science of science: analysis of the produc-
and the Caribbean is particularly threatened by climatic, eco-   tion of science using large-scale data (Fortunato et al., 2018).
nomic, and political pressures. To assess the region’s abil-        Freshwater resources face mounting pressures, brought
ity to manage water resources, we conducted an unprece-          about by human population growth and urbanization
dented literature review of over 20 000 multilingual research    (Jenerette and Larsen, 2006; Immerzeel et al., 2020), cli-
articles using machine learning and an understanding of the      mate change (Gosling and Arnell, 2016), economic growth
socio-hydrologic landscape. Results reveal that the region’s     and consumption patterns (Mcdonald et al., 2014; O’dorico
vulnerability to water-related stresses, and drivers such as     et al., 2018), and the spread of misinformation and mistrust
climate change, is compounded by research blind spots in         in science (IPCC, 2014). LAC epitomizes these water chal-
niche topics (reservoirs and risk assessment) and subregions     lenges with its abundant yet unequally distributed water re-
(Caribbean nations), as well as by its reliance on an individ-   sources (DESA, 2019), mounting pollution, and the highest
ual country (Brazil). A regional bright spot, Brazil, produces   income inequality in the world (Varis et al., 2019). Marked
well-rounded water-related research, but its regional domi-      disparities exist in terms of water availability (both quality
nance suggests that funding cuts there would impede scien-       and quantity), climate change vulnerability, degree and form
tifically informed water management in the entire region.        of urbanization, conservation habits, and scientific productiv-
                                                                 ity, which each affect water resources management (Ciocca
                                                                 and Delgado, 2017; Lyon et al., 2019). Countries with abun-
                                                                 dant water resources, Brazil for example, experience water
1   Introduction                                                 scarcity due to a mismatch between water-rich areas and pop-
                                                                 ulation centers (Formiga-Johnsson and Kemper, 2005), while
Despite being the world’s most water-rich region, Latin          others, Argentina, Chile, and Bolivia for example, face flood-
America and the Caribbean (LAC) faces extreme weather            ing and melting glaciers (Barros et al., 2015; Soruco et al.,
events and a range of water-related stresses that are expected   2015; Masiokas et al., 2019), yet others in Central Amer-
to worsen with climate change (UN-OCHA, 2020). It is criti-      ica are increasingly devastated by hurricanes (Bárcena Ibarra
cal that responses are based on sound science and contextual-    et al., 2020).
ized. The state of water resources research in Latin America,
including its bright spots and blind spots, can be thoroughly

Published by Copernicus Publications on behalf of the European Geosciences Union.
4632                                                         A. J. DeVincentis et al.: Bright and blind spots in Latin America

   LAC is among the most urbanized regions in the world             ics (e.g. remote sensing). For each article, topic probabilities
where population densities in water-rich regions can be many        are the probabilities that the article’s content corresponds to
times higher than arid regions, such as in Argentina. These         each individual topic. In addition, we read a random subset
high-density areas face particular vulnerability to water qual-     of 2000 papers from the corpus to validate results from the
ity and supply reliability (Kim and Grafakos, 2019). For            topic model and identify study location. We leveraged this
example, São Paulo faced severe water shortages during a            manual reading process to identify the study location for the
2014 drought, while Mexico City has steadily and rapidly de-        entire corpus using machine learning and used article meta-
pleted its groundwater supply (Aguilar-Barajas et al., 2015).       data to generate a citation network of citing and cited refer-
Urban pressures on water resources are compounded by in-            ences within the corpus.
efficient farming practices, unregulated industries, and aging         To contextualize results from the literature review, we used
infrastructure across the region. Worldwide, and particularly       publicly available data to statistically cluster countries into
in LAC, these water challenges are expected to intensify with       groups with similar social and hydrological systems, socio-
climate change as variations in precipitation, temperature,         economic metrics, and measures of water resources abun-
and evaporation threaten water availability for current and         dance and use. This clustering process allowed for more
future water users (Dussaillant et al., 2019; Gesualdo et al.,      meaningful interpretation of subsequent results within and
2019; Zaninelli et al., 2019).                                      across countries. To further ground our results in the current
   While uncertainty surrounds the reliability of water sup-        research landscape, we invited 20 000 corresponding authors
plies to address water-related risks and meet future needs          from our corpus to share their experiences through a survey
in LAC, water resources management is a relatively young            focused on research discipline, accessibility, and connectiv-
field of study (Montanari et al., 2015) and suffers from a          ity. A total of 1969 respondents from 35 countries and a va-
lack of interdisciplinary and integrative perspectives, com-        riety of disciplinary backgrounds completed this survey.
mon in the environmental sciences (Norgaard, 2008). Recent             Bright spots and blind spots of water resources research
review papers are limited to a geographic area (Owusu et al.,       in LAC were evaluated using three concepts: abundance,
2016; Paiva et al., 2020), individual components of the water       spread, and connectivity. Abundance was measured as re-
budget such as a watershed (Dobriyal et al., 2012), particu-        search volume by country and by topic. Spread was estimated
lar methodology (Plummer et al., 2012), specific water user         by topic normality across countries and articles, describing
(Ran et al., 2016), or small sample of documents (Endo et al.,      how close a topic’s probability distribution is to the stan-
2017). Paiva et al. (2020), for instance, conducted a review        dard normal distribution. Connectivity was determined with
of 250 conference papers from the 2019 Brazilian Water Re-          a weighted citation network across countries and topics, de-
sources Symposium to better understand major advances and           scribing the probability that a specific node (country or topic)
challenges in Brazil’s water science.                               is cited by other nodes.
   Given these circumstances, it is critical to understand how         The rest of the article is organized as follows. The next
the breadth of past water resources research across LAC con-        section details how the data underlying this study were ac-
tributes to the scientific knowledge necessary for decision-        quired. Section 3 presents the methods we used to associate
making processes (Cvitanovic and Hobday, 2018). To assess           metadata (e.g. topic, location) with each document in the cor-
the state of water research in LAC, we used a science of sci-       pus. In that section, we also introduce the specific metrics and
ence approach (Fortunato et al., 2018) and performed an un-         methods used to infer bright and blind spots. Section 4 ex-
precedented, multilingual review of available peer-reviewed         poses results associated with metadata generation. Section 5
literature to identify bright spots of scientific inquiry: topics   presents and discusses bright spots and blind spots. The last
and locations where water research is abundant, spread out,         section summarizes our findings.
and well connected (Uzzi et al., 2013; Astudillo, 2016; Lar-
ivière et al., 2015). Conversely, blind spots of past research
are defined as topics and locations where water resources are       2     Materials
less-thoroughly studied. This approach identifies opportuni-
                                                                    In this section, we detail the specific process for corpus col-
ties to enhance collaboration within the research community
                                                                    lection, retrieving socio-hydrologic and survey data.
and to ensure future research meets societal needs.
   To perform the literature review, we assembled a corpus          2.1    Corpus collection
of 20 000 water resources research articles in English, Span-
ish, and Portuguese by querying online databases and mod-           The process of corpus collection consisted of four steps:
eled the topics of each article with latent Dirichlet alloca-
tion (Blei et al., 2003). Topics are groups of statistically co-        i. querying online databases;
occurring words, which we labeled based on four categories:             ii. retrieving documents;
5 general research topics (e.g. physical sciences), 43 specific
topics representing subfields of research (e.g. geochemistry),       iii. iteratively assessing quality of the corpus and correcting
17 water-budget topics (e.g. reservoirs), and 13 method top-              bias; and

Hydrol. Earth Syst. Sci., 25, 4631–4650, 2021                                         https://doi.org/10.5194/hess-25-4631-2021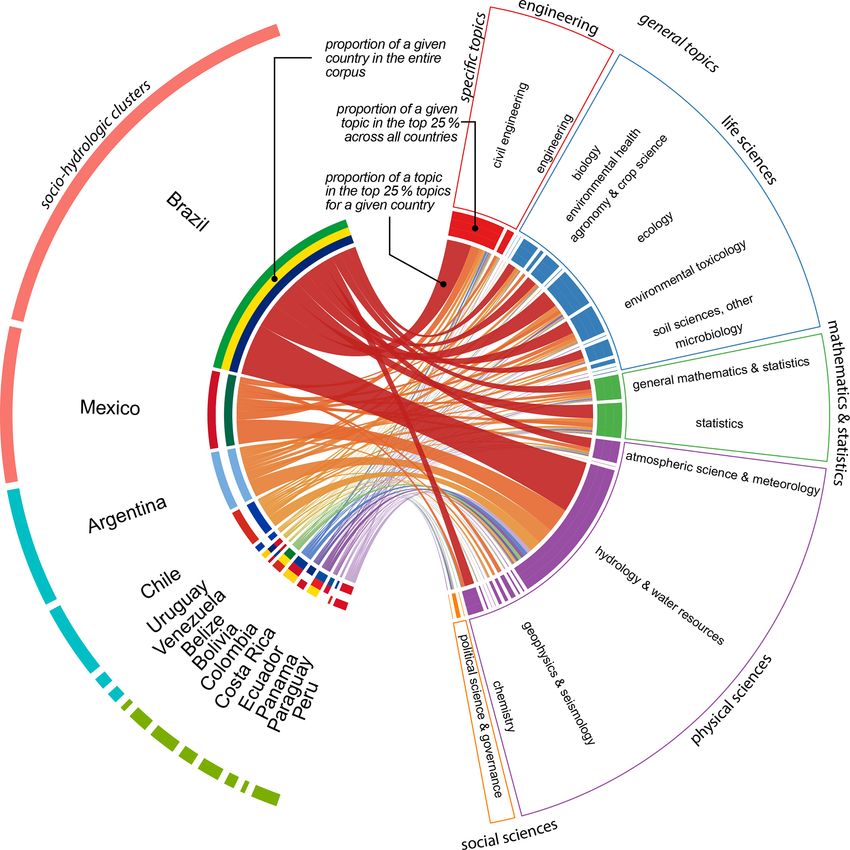
A. J. DeVincentis et al.: Bright and blind spots in Latin America                                                           4633

 iv. cleaning the corpus.                                        2.2   Collecting socio-hydrologic attributes
   First, we defined the query to obtain water resources re-     To build a database of socio-hydrologic country descriptors,
search about Latin American and Caribbean (LAC) coun-            we collected 43 relevant indicators from five indexes to com-
tries. We selected a peer-reviewed literature database based     pare and contrast LAC countries (Table S2, Data S1). We
on the following criteria: (1) inclusion of journals from LAC    selected the indicators from the following databases, chosen
(e.g. SciELO); (2) number of query results in English, Span-     for their international recognition and global or LAC-wide
ish, and Portuguese; and (3) expert assessment of the re-        breadth of data:
sults with a focus on relevancy. Web of Science and Scopus
databases were chosen. Results from the query were assem-          – AQUASTAT,        (http://www.fao.org/nr/water/aquastat/
bled into .ref data files.                                           tables/index.stm, last access: May 2021);
   Second, in accordance with institutional licensing, End-
                                                                   – Environmental        Performance      Index    (https:
Note was used to retrieve documents from the assembled
                                                                     //epi.envirocenter.yale.edu/epi-downloads, last ac-
reference files. This method of corpus collection showed an
                                                                     cess: May 2021);
unequal return rate across the three languages (Table S1 in
the Supplement), which was corrected for in the subsequent         – Global State of Democracy (https://www.idea.
steps.                                                               int/gsod-indices/#/indices/world-map, last access:
   Third, we performed a quality assessment of the corpus            May 2021);
to assess possible bias between query results and document
retrieval within distinct sources or time periods (Year). We       – Social Progress Index (https://www.socialprogress.org/
defined the within-corpus bias as the difference in relative         index/global/results, last access: May 2021);
frequencies f between the query and corpus, such that
                                                                   – LAC      INFORM         (http://www.inform-index.org/

B(Year) = 1 fquery (Year)−fcorpus (Year) ,

                                                           (1)       Subnational/LAC, last access: May 2021).

B(Source) = 1 fquery (Source)−fcorpus (Source) .           (2)   AQUASTAT is a global information system produced by
                                                                 the Food and Agriculture Organization of the United Na-
A corpus with satisfactory quality would be one presenting       tions and presents a perspective on agriculture and water
minimal bias from Eqs. (1)–(2). To address the possibility       resources availability, infrastructure to support large-scale
that our automated approach could result in between-corpus       regional planning, and analysis. The Environmental Per-
bias in terms of return rate, we augmented the corpus by         formance Index considers two fundamental dimensions of
manually downloading articles to correct for biases by year      sustainable development: environmental health, which rises
and presence of digital object identifier (DOI). We defined      with economic growth and prosperity, and ecosystem vital-
the English corpus as well-behaved and used it as a refer-       ity, based on 24 indicators (Wendling et al., 2018).
ence to adjust the Spanish and Portuguese corpora so that           The Global State of Democracy indices depict democratic
each language’s corpus reached similar return rates. This ad-    trends at the country, regional, and global levels across a
justment reduced both within- and between-corpus bias by         broad range of different attributes of democracy in the pe-
using systematic sampling with unequal inclusion probabil-       riod 1975–2015. Democracy is conceptualized as popular
ities of the pi (Madow and Madow, 1949), where pi was            control over public decision-making and decision makers and
defined using the normalized product of the bias functions       equality of respect and voice between citizens in the exercise
and i refers to the ith non-retrieved article. This procedure    of that control. The index translates these principles into five
was performed twice leading to a similar return rate across      main democracy attributes: representative government, fun-
languages (Table S1).                                            damental rights, checks on government, impartial adminis-
   Lastly, we performed a cleaning process to prepare the ar-    tration, and participatory engagement (International Institute
ticle texts for the topic model. Texts were converted into a     for Democracy and Electoral Assistance, 2017).
standardized version in which all cases were lowered, words         The Social Progress Index is a comprehensive measure of
not found in a dictionary were removed, and special pat-         quality of life, independent of economic indicators, and is
terns for words such as emails and URLs were assigned tags.      designed to complement economic measures such as gross
Additional cleaning removed punctuation (except for apos-        domestic product. Social progress is defined as the capacity
trophes and hyphens inside words) and single-letter words.       of a society to meet the basic human needs of its citizens,
Finally, lemmatization (the reduction of a word to a com-        establish the building blocks that allow citizens and commu-
mon base form) was performed using TreeTagger software           nities to enhance and sustain the quality of their lives, and
by changing all nouns into singular form and all verbs into      create the conditions for all individuals to reach their full po-
the infinite tense (Schmid, 1999). This final version of each    tential. The index aggregates three broad dimensions of so-
corpus, with lemmatization, was then used as input for topic     cial progress: basic human needs, foundations of wellbeing,
modeling.                                                        and opportunity (Fehder et al., 2018).

https://doi.org/10.5194/hess-25-4631-2021                                     Hydrol. Earth Syst. Sci., 25, 4631–4650, 2021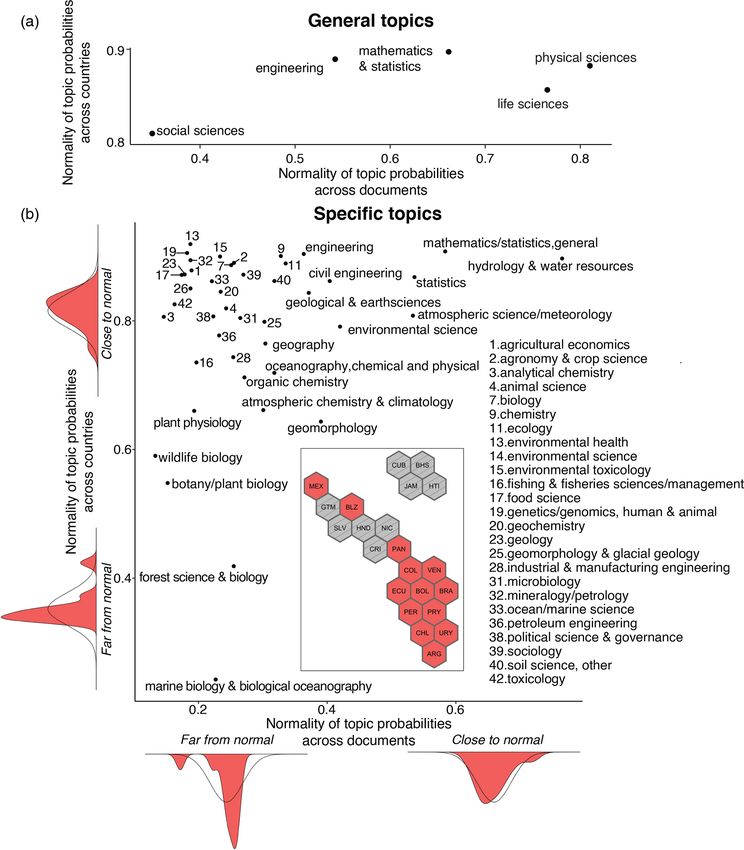
4634                                                        A. J. DeVincentis et al.: Bright and blind spots in Latin America

   The LAC INFORM Risk Index simplifies risk-based in-              iii. the metrics to identify bright and blind spots of water
formation for LAC countries. A risk score is calculated for              research.
each country by combining 82 indicators that measure three
dimensions: hazard and exposure, which captures potential          3.1     Clustering analysis
hazardous events and the number of people that could be ex-
posed; vulnerability, which measures the fragility of socio-       We clustered countries based on socio-hydrologic variables
economic systems and the strength of communities, house-           using two different methods: k-means clustering (Harti-
holds, and individuals to confront a crisis situation; and lack    gan and Wong, 1979) and hierarchical clustering (Murtagh,
of coping capacity, which takes into account a country’s insti-    1983). We performed the clustering with Euclidean distances
tutional and infrastructural strength to cope with and recover     and following Ward’s criterion. We then investigated the op-
from crisis (INFORM, 2018).                                        timal number of clusters by evaluating the evolution with the
   Although these indicators do not capture the full spectrum      number of clusters of the total within sums of squares and
and complexity of factors related to water, they allow for an      of the average silhouette width (Rousseeuw, 1987). In addi-
analysis of the topic modeling results based on country clus-      tion, we used the following four validation metrics to assess
ters with similar characteristics.                                 the stability of the clustering under the complete set of clus-
                                                                   tering variables and performed an iterative procedure where
2.3    Electronic survey                                           one variable is removed from the set, an approach akin to
                                                                   leave-one-out cross-validation:
Results from the literature review were ground-truthed with
an electronic survey sent to corresponding authors of the ar-        – The average proportion (APN) measures the proportion
ticles from the corpus. The survey aimed to shed light on re-          of observations not placed in the same cluster under
searchers’ characteristics by including questions about their          both cases and evaluates how robust the clusters are un-
research experience, institutional affiliation, publication his-       der cross-validation (Datta and Datta, 2003).
tory, their perceptions on funding and interdisciplinarity in        – The average distance between means (ADM) measures
the field of water resources, and open-ended questions. The            the variation of the cluster center and evaluates the sta-
survey received exemption from the University of California,           bility of the localization of the cluster in the multidi-
Davis, IRB Administration (ID 1335782-1).                              mensional clustering variable space (Datta and Datta,
   The survey was designed to include 16 questions, in three           2003).
languages (English, Spanish, and Portuguese), and take ap-
proximately 5 min to complete (Table S3). Respondents were           – The average distance (AD) measures the distance be-
asked questions about their position; institutional affilia-           tween observations placed in the same cluster and eval-
tion; years of experience; main research discipline; coun-             uates within-cluster stability (Datta and Datta, 2003).
tries of birth, residence, and research focus; number of peer-
reviewed publications; motivations for picking journals for          – The figure of merit (FOM) estimates the predictive
publications; source of funding; and opinions regarding in-            power of the clustering algorithm by measuring the
terdisciplinary research.                                              within-cluster variance of the removed variable (Yeung
   The survey was sent in November 2018 to corresponding               et al., 2001).
authors from 22 324 papers, a subset of the final corpus, using
                                                                   3.2     Metadata generation and mining
Qualtrics survey distribution software. This included articles
written in each language: 20 332 English, 1293 Spanish, and        Each document in the corpus was augmented by generating
699 Portuguese. The survey was resent to non-respondents           and mining metadata. The mined metadata correspond to au-
weekly until February 2019, leading to 1969 responses. The         thor keywords as well as the citing and cited literature result-
survey response data was cleaned and prepared for analysis.        ing in a citation network. The generated metadata correspond
The survey responses in Spanish and Portuguese were trans-         to modeled topics and study location.
lated to English and compiled into one document.
                                                                   3.2.1    Topic model
3     Methods                                                      The content of the corpus documents were modeled using la-
                                                                   tent Dirichlet allocation (LDA), a Bayesian, generative, prob-
In this section, we detail the following:
                                                                   abilistic model conceptualizing each document in a corpus of
    i. the clustering of countries from their socio-hydrologic     documents as a random mixture of topics (Blei et al., 2003).
       data;                                                       Topics are a Bayesian bag of words corresponding to a distri-
                                                                   bution over the vocabulary (i.e. the words appearing within
    ii. the generation and mining of metadata; and                 the corpus). In essence, one topic corresponds to words that
                                                                   have a significant probability to co-occur.

Hydrol. Earth Syst. Sci., 25, 4631–4650, 2021                                       https://doi.org/10.5194/hess-25-4631-2021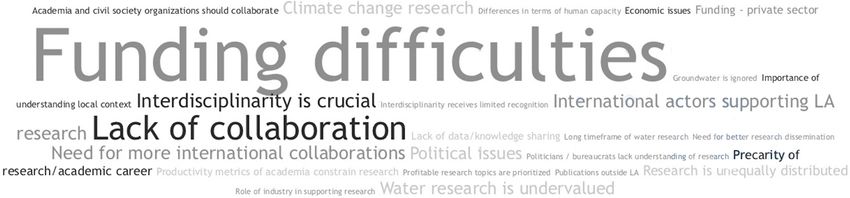
A. J. DeVincentis et al.: Bright and blind spots in Latin America                                                             4635

   The LDA was programmed to identify 105 topics in En-             In consequence, BC is a weighted directed adjacency matrix.
glish and 65 topics in the Spanish and Portuguese corpora           Similar reasoning leads to the citation network between spe-
based on commonly used metrics for LDA tuning. We then              cific research, method, and water budget topics by changing
conducted a quality assessment of the topic models through          the matrix C in the previous equation for the LDA probabilis-
cross-validation. For this we developed human-derived top-          tic predictions of topics.
ics for the English corpus by reading a subset of 1428 pa-
pers from the corpus and manually identifying single-word           3.2.3    Location prediction
tags based on keywords and main research topics. A simi-
lar percentage of documents were read for the Spanish and           We used machine learning to predict the location of the coun-
Portuguese corpora: 188 and 111, respectively.                      try of study of each paper in the English corpus. The train-
   As topics are statistical objects, they must be assigned a       ing labels were provided by human-reading randomly cho-
human label to make them tractable. An interdisciplinary re-        sen articles from the corpus (1428 human-derived labels) and
view panel of eight water experts therefore assigned labels         from text mining the article metadata (2663 text-mined la-
for each topic while simultaneously evaluating their signifi-       bels). Interestingly, the human-reading provided 563 obser-
cance. Topics were removed if multiple members of the re-           vations of irrelevant country locations (i.e. outside LAC) or
view panel determined that the most frequently occurring            irrelevant subjects of study (i.e. not water resources related).
words were irrelevant based on their expert knowledge of            This occurred in some cases when our queries returned ar-
water resources science. The remaining relevant topics were         ticles containing accurate keywords but different meanings
tagged with five labels independently by multiple reviewers,        than intended; for example, the search work “Mexico” re-
and the collection of proposed topic labels were then har-          turned irrelevant locations including regions of the United
monized to produce final topic labels. Topics were assigned         States around the Gulf of Mexico and irrelevant topics such
labels for each of several levels: (i) specific topic name;         as signal processing analyses employing the “Mexican hat”
(ii) theme, i.e., categories of scientific research as defined by   wavelet.
the US National Science Foundation (NSF) that were either              The human-derived labels were first used for construct-
(iii) specific or (iv) broad; and (v) description, i.e., spatial    ing a relevance filter based on simple binary classification
scale, water budget, or methods. These labels were consoli-         between “Relevant” and “Irrelevant” documents (n = 1386
dated into four topic categories: general, specific, methods,       after quality control). The predictors consist of the text docu-
and water budget.                                                   ment term matrix derived from the cleaned corpus text using
                                                                    tokens related to country names and of the topic member-
3.2.2   Metadata mining and citation network                        ship output by the topic model (p = 138). A benchmark of
                                                                    the six following models was conducted: featureless (base-
Article metadata containing the citing literature and author-       line), random forest, support vector machine, naive Bayes,
defined keywords for articles from the English corpus were          multinomial regression, and extreme gradient boosting. The
extracted using Elsevier API and each article’s DOI. We used        hyper-parameters were initially set at standard default value.
this citing literature to build a citation network. Keywords        The resampling scheme was 10 repetitions of 10-fold cross-
were used to supplement the country location labels assigned        validation. Best performing models were selected for further
during human-reading by looking for regular expressions of          tuning using a nested cross-validation (Bischl et al., 2012)
the name of the target countries. Of the 31 countries in LAC,       with a simple hold-out inner loop and 10 repeats of 10-
only 23 countries had a sufficient occurrence (i.e., at least       fold cross-validation as an outer loop. The size of the tuning
30 articles) within the human-read subset of the English cor-       grid was set to 16 between standard values for each hyper-
pus and were included in the citation network.                      parameter.
   The citation network was extracted from article metadata,           The prediction of the location of study for each document
which stores identifiers for the citing article (i.e. the article   was performed using both human-derived and text-mined la-
to which the metadata are attached to), and the cited articles.     bels (n = 3494 after quality control). The predictors con-
A total of 29 900 citations were found between 4603 unique          sisted of the text document-term matrix derived from the
articles of the English corpus. The resulting bibliographic         cleaned corpus text using tokens related to country names
network is defined by its 4603 × 4603 adjacency matrix B            (p = 33). Models and resampling schemes were similar to
and was filtered to remove edges between nodes external to          the ones used for the relevance filter. The hyper-parameters
the collected corpus. The citation network between countries,       were initially set at standard default value.
BC , was obtained by
                                                                    3.3     Bright spots and blind spots
BC = CT · B · C,                                             (3)
                                                                    This section details assessments of the following:
where C is a 4603 × 23 matrix containing the output of the
machine learning probabilistic predictions of the location of         i. ground truth from analyzing survey data;
study between 23 possible countries of study (see below).

https://doi.org/10.5194/hess-25-4631-2021                                         Hydrol. Earth Syst. Sci., 25, 4631–4650, 2021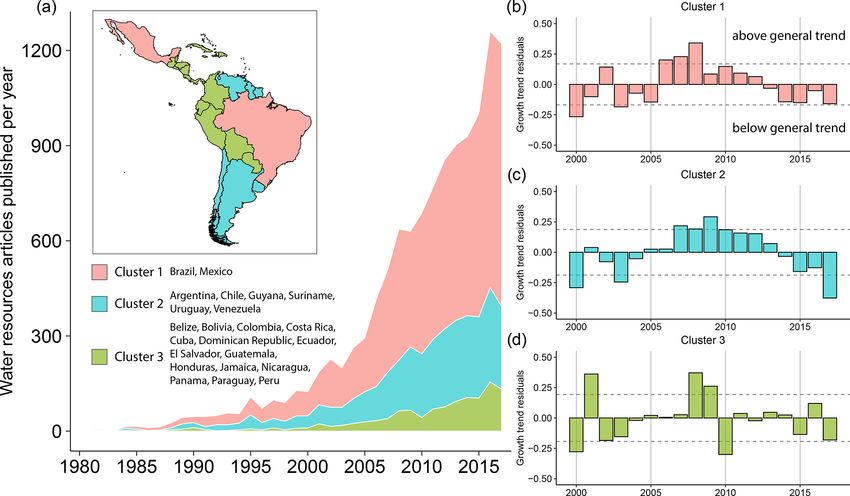
4636                                                       A. J. DeVincentis et al.: Bright and blind spots in Latin America

 ii. research volume;                                             English corpus. Each subset was filtered for documents that
                                                                  were labeled with a country of research and then for coun-
 iii. research spread using topic normality; and                  tries where the sum of documents per country was greater
                                                                  than 30. A statistical distance from standard, normal distribu-
 iv. research connectivity from network analysis.                 tion was calculated to describe the normality of topic proba-
                                                                  bilities from two perspectives: across documents and across
3.3.1   Survey analysis                                           countries. As a statistical distance, we chose the Jensen–
                                                                  Shannon distance because of its link with entropy (Lin, 1991)
Closed-ended responses of the electronic survey were ana-
                                                                  and its interpretation in terms of a proper distance (Endres
lyzed by tallying aggregate data by country and discipline
                                                                  and Schindelin, 2003). The Jensen–Shannon distance, dJS ,
of study. This allowed for a number of inferences such as
                                                                  is calculated between two probability density functions N
the most commonly represented research disciplines and the
                                                                  and P , and dJS = 0 if P = N (see Appendix A for full deriva-
countries of study and of origin of respondents. Research col-
                                                                  tion). Here, we chose N as the standard normal distribu-
laborations were analyzed based on the three main countries
                                                                  tion, N (0, 1). P is the standardized probability distribution
of study and the three main countries of research collabora-
                                                                  of topic probability distribution across either documents or
tions for every respondent.
                                                                  countries. To better meet the intuition of normality, we de-
   Open-ended responses were coded for content and ana-
                                                                  fine it as 1−dJS so that normality is closer to 1 when the P is
lyzed in ATLAS.ti, resulting in dozens of codes used to group
                                                                  closer to the standard normal distribution.
responses of similar content (Table S7). Comments irrelevant
to the study were removed. We also identified relationships
                                                                  3.3.4   Citation network analysis
between codes based on connections in the data. If respon-
dents mentioned political issues that hamper funding avail-
                                                                  The citation network was analyzed using Gephi 0.9.2 (Bas-
ability, we coded the two elements (e.g. “political issues”
                                                                  tian et al., 2009). Descriptive parameters and geometry met-
and “funding difficulties”, and we then linked them with the
                                                                  rics were calculated. We conducted this network analysis at
qualifier “is the cause of”). In addition, through the “word
                                                                  each LAC country level for general and specific topics, as
cruncher” tool, we generated a word frequency from the sur-
                                                                  well as water budget and methods topics. Probability adja-
vey comments resulting in a word cloud visualization where
                                                                  cency matrices were extracted from predictive model results
words’ sizes are proportional to their use frequency.
                                                                  and normalized to highlight the relationship between topics
3.3.2   Research volume over time                                 or countries regardless of sample size in our corpus.
                                                                     A force-directed graph algorithm, Fruchterman–
A timeline was created with the number of new research arti-      Reignold (FR), was selected to produce the networks’
cles published per year representing countries in the three       visualizations. It simulates the graph as a system of mass
socio-hydrologic clusters, to visualize growth in research        particles. The nodes are the mass particles and the edges are
output over time. The articles were sourced from the English      springs between the particles. The algorithm tries to mini-
corpus of water resources research, because these articles        mize the energy of this physical system. FR is most suitable
were labeled with the country of research and could therefore     for small networks and a better performance (Fruchterman
be associated with a socio-hydrologic cluster. To better un-      and Reingold, 1991; Jacomy et al., 2014). The force-directed
derstand trends observed in each socio-hydrologic cluster, a      citation networks show the degree of connectivity by the
residual analysis was performed. The data were transformed        nodes’ size and edge thickness, but there is no distinction
with a logarithmic transformation to obtain a roughly lin-        between positive or negative citations (Bruggeman et al.,
ear relationship between time and research output, and then       2012).
a linear regression was calculated. The residuals for each           For each network, the following geometric descriptions
year were plotted and displayed starting from 2000 to 2017.       were calculated: number of nodes (countries or research top-
Year 2000 was chosen as the starting point, because it marks      ics), number of edges (citation between countries or research
the time by which research output had increased enough to         topics), and thickness of the edges (connectivity proportion).
reach at least 30 new articles in each socio-hydrologic cluster   We also calculated network density and degree. Network
per year. The residuals were then plotted along with brack-       density is a measure of the connectedness of a graph, de-
ets of the standard deviation (for both positive and negative     fined as the number of connections divided by the number of
values) to provide a reference of significance.                   possible connections, with all possible edges and density = 1
                                                                  (Tonin et al., 2019). Degree is the number of connections
3.3.3   Topic normality                                           each node (country or topic) has with another node (coun-
                                                                  try or topic). Degree has generally been extended to the sum
The normality of research topics was estimated for general        of weights when analyzing weighted networks and labeled
and specific topics, as well as for the method and water bud-     node strength, so the weighted degree and the weighted in-
get topics. Documents in each subset were sourced from the        and out-degree were calculated (Newman, 2001; Barrat et al.,

Hydrol. Earth Syst. Sci., 25, 4631–4650, 2021                                      https://doi.org/10.5194/hess-25-4631-2021
A. J. DeVincentis et al.: Bright and blind spots in Latin America 4637
2004; Opsahl et al., 2010). In all visualizations, edge thick- sources research published in these languages. While access
ness represents weighted degree, and network node size rep- to more articles would have resulted in even closer alignment
resents research volume defined as the sum of probabilities with the English corpus, the existing alignment between top-
for the given node in the corpus. ics present across all three corpora is sufficient to support
our decision to base topic model conclusions on the English
corpus alone.
4 Results
4.2.2 Relevance filter and location prediction
4.1 Clustering results
For the relevance filter, the random forest, multinomial, and
LAC countries were clustered based on socio-hydrological support vector machine models were the best-performing
characteristics using hierarchical and k-mean clustering. models and showed no statistical difference in the distri-
Both clustering methods yielded similar results. The total bution of their performance measured by area under curve
within sums of squares evolved after two clusters were cho- (AUC, Fig. 2a). Random forest and multinomial were the
sen. Similarly, the average silhouette width strongly exhib- best-performing tuned models and showed no statistical dif-
ited a peak for two clusters. Further inspection of clustering ference in the distribution of their performance measured by
in principal component dimensions indicated that the clus- AUC (Fig. 2b). The distribution of the hyper-parameter re-
ter with Mexico and Brazil was significantly distinct from all sulting from the nested cross-validation showed a better con-
other countries, explaining the observation of a sharp peak in straint for the multinomial model which was selected for pre-
average silhouette width. However, validation metrics exhib- dictions. There were 12 616 articles predicted as relevant to
ited optimal null values of average proportion (AP) and aver- our study. The performance of this multinomial model cor-
age distance between means (ADM) for two or three clusters. responds to a mean AUC of 0.82, a mean accuracy of 77 %,
In addition, average distance (AD) and figure of merit (FOM) and a true positive rate of 86 %.
were lower for three clusters than for two. Based on these For predicting location of the country of study of each pa-
results, we chose three clusters to describe the grouping of per, random forest outperformed every other model with a
countries based on their socio-hydrologic variables. mean multiclass AUC of 0.99 and a mean accuracy of 96 %
(Fig. 3). No further tuning was performed, and the random
4.2 Metadata generation forest with default hyper-parameters was used for predic-
tions. More complex approaches were investigated: using ad-
4.2.1 Topic model
ditional geographical tokens (e.g. rivers and mountain range
We determined if the LDA successfully identified a relevant names), multi-label classifications (e.g. binary relevance, la-
topic based on the top 10 occurring words which showed a bel powerset), or deep learning models of natural language
86 % agreement between expert-identified topics and LDA- processing (e.g. Google’s BERT; Devlin et al., 2018) both
derived topics. We judged the performance of the LDA by on full texts and abstracts. These more complex methods
comparing the topic model output from the English corpus yielded similar results than our simpler initial approach and
to the output from the Spanish and Portuguese corpora. The were therefore not pursued further for this study.
specific topic label for each topic was used for comparison.
4.3 Survey results
The number of topics with each specific label were grouped
by language and tallied (Fig. 1, Tables S4–S6). The most common categories of answers in the comment
Our findings are based on the output of a topic model of ar- section were summarized (Table S7). Difficulties related to
ticles written in English and are predicated on the assumption funding stood out as the main challenge for respondents
that the English language corpus accurately represents the (Fig. 4). These were often linked to political or economic
breadth of regional research published in English, Spanish, trends in their countries. Respondents further explained that
and Portuguese given that non-English corpora were small available funds are not only distributed unequally across
fractions of the English corpus (4 % and 2 % for Spanish and countries but also within countries and across research ar-
Portuguese, respectively). Comparing the topic model per- eas. Collaboration, or the lack thereof, was another impor-
formance of the three corpora (Fig. 1) supports this assump- tant theme. Many respondents claimed that they collaborated
tion. One-third of the specific topics present in the English more with North America, Europe, and Australia than with
corpus are present in all languages. Importantly, this subset other LAC countries, in large part due to funding opportu-
of topics includes the majority (10 of 16) of the top 25 % of nities. Many indicated an interest in collaborating with re-
research topics from the English corpus. Another third of the searchers in other LAC countries.
topics are present in two of the three languages, and the last
third is only present in English. Because of the small size of
the Spanish and Portuguese corpora, it is likely that their top-
ics do not cover the entire scope of peer-reviewed water re-
https://doi.org/10.5194/hess-25-4631-2021 Hydrol. Earth Syst. Sci., 25, 4631–4650, 20214638 A. J. DeVincentis et al.: Bright and blind spots in Latin America
Figure 1. Topic model performance assessed by the total number of specific topics present in each language. Bolded topics represent the
top 12.5 % of research (named topics in Fig. 6). Numbers in each box correspond to the number of topics from the topic model that were
manually grouped together under a common label.
5 Bright spots and blind spots sons for this growth could relate to a wide array of changes in
LAC over the last 40 years beyond an increasing interest in
5.1 Volume: growth through time addressing water-related knowledge gaps: increased access
to the internet and online resources, availability of existing
First, we look at research volume by country and topic. The research in online repositories, and expansion of opportuni-
cumulative research growth showed an exponential growth ties in higher education (Delgado-Troncoso and Fischman,
trend over the last 4 decades, although the trend was more ev- 2014; Baskaran, 2017).
ident in cluster 1 (Brazil and Mexico) than in clusters 2 or 3 A residual analysis identifies three distinct periods
(Fig. 5). These results were used to interpret periods of time since 2000, the first year that each socio-hydrologic cluster
in which the scientific production of water research was in- was represented by over 30 research papers in each language.
creasing or decreasing on a region-wide scale, in reference to Annual output was lower than each cluster’s general trend for
the growth trajectories of each socio-hydrologic cluster. Rea- the first few years, followed by a period of relatively higher
Hydrol. Earth Syst. Sci., 25, 4631–4650, 2021 https://doi.org/10.5194/hess-25-4631-2021A. J. DeVincentis et al.: Bright and blind spots in Latin America 4639 Figure 2. Machine learning performance for relevance prediction based on simple binary classification between “Relevant” and “Irrele- vant” documents (n = 1386). (a) Performance of untuned models; (b) performance of selected tuned models. Brackets highlight statistical differences between distributions. output from 2007–2012, ending with a trend of decreasing in research output. For example, a connection may exist be- growth from 2013–2017, although some residuals are below tween Brazil’s economic crisis starting in 2012 and the sub- a single standard deviation within these periods. It is possi- sequent drop in research output from 2013–2017. ble that uniform anomalies below or above general growth trends correspond to region-wide events, although a several- year lag could be possible between causal events and effects https://doi.org/10.5194/hess-25-4631-2021 Hydrol. Earth Syst. Sci., 25, 4631–4650, 2021
4640                                                          A. J. DeVincentis et al.: Bright and blind spots in Latin America

Figure 3. Machine learning performance for prediction of the location of study for each document using both human-derived and text-mined
labels (n = 3494). Brackets highlight statistical differences between distributions.

Figure 4. Word cloud based on word frequency from survey comments.

5.2    Where and what is being studied?                               resentation in overall research, with cluster 1 (Brazil and
                                                                      Mexico) receiving the most research, followed by cluster 2,
Combining research topics with predicted study location de-           then cluster 3, which includes most of Central America and
scribes the composition of water research in LAC with a               the Caribbean. Although population size likely affects each
chord diagram (Fig. 6). This chord diagram was obtained               country’s representation in the overall research output, it does
from the weighted bipartite network between countries and             not precisely correlate with research volume. We therefore
topics (Fig. 6). For legibility, the network was filtered to re-      expect that other factors used to define the country clusters
move the edges with weight lower than the 75th percentile of          (e.g. a country’s water and economic resources, geography,
the edges of a given country. In other words, for each country,       and history) influence the likelihood that researchers study
only the top 25 % links are displayed.                                that country.
   While research about Brazil, Mexico, Argentina, and Chile             Mexico and Argentina alternate for second highest repre-
are bright spots that dominate the research landscape, the            sentation, depending on the topic, after Brazil. These find-
absence of countries in the Caribbean and most of Central             ings are confirmed by survey respondents, of which 35 %
America indicates a shortage of research in these regions.            study Brazil, followed by Mexico with 15 %, and Argentina
A country’s socio-hydrologic cluster correlates to its rep-

Hydrol. Earth Syst. Sci., 25, 4631–4650, 2021                                           https://doi.org/10.5194/hess-25-4631-2021
A. J. DeVincentis et al.: Bright and blind spots in Latin America 4641
Figure 5. Growth of water resources research. (a) New articles per year for each socio-hydrologic cluster (inset). (b–d) Residual analysis
estimating the deviation from the exponential trend for each socio-hydrologic cluster.
with 9 % (across all research topics). Only 12 % of survey re- uments, while marine biology and forest science are likely
spondents focused most of their research on countries in the blind spots. The majority of specific topics have high nor-
Caribbean or Central America. mality across countries (> 0.8) but low normality across doc-
Water research is not distributed equally among disciplines uments (< 0.4). These topics are either infrequently men-
and is primarily conducted in the physical and life sciences, tioned or, if mentioned, are the sole subject of a paper,
representing together 80 % of topic probabilities. Survey re- lacking integration in interdisciplinary research. For water
sponses also confirm these findings, as 80 % of respondents budget topics (Fig. 8a), precipitation, which must be moni-
identified as life and physical scientists. The lack of wa- tored and understood to manage water resources, has a dis-
ter research in social sciences may reflect a combination of tribution closest to normal, representing a bright spot, while
low publication rates (compared to physical sciences), disci- glaciers is far from having a normal distribution, likely be-
plinary preference for publishing in books rather than peer- cause few countries have glaciers to study (i.e. Argentina,
reviewed articles, a historical framing of water management Bolivia, Chile), and they are relatively less relevant for other
as a purely technical discipline (Callaghan et al., 2020), and countries’ water budgets. For method topics (Fig. 8b), statis-
financial resources from governments biased towards physi- tics, quantitative methods, and water sampling are identified
cal sciences and engineering. as bright spots of water research methods across the region.
The least normality is seen in two topics of great impor-
5.3 Spread: research on reservoirs and risk assessment tance for water management: reservoirs and risk assessment.
is siloed Both topics have normality values far below 1 across both
countries and documents, suggesting poor representation of
Next, we look at the spread of water research in LAC, de- these topics on a broad scale (Fig. 8). These are alarming
scribed by topic normality for general, specific, water bud- blind spots given the importance of reservoirs for water sup-
get, and method topics. Importantly, Caribbean nations and ply reliability and their impacts on local communities and
most of Central America did not have enough research to ecosystems. Furthermore, a lack of research in reservoirs and
be included in these analyses and represent blind spots. For risk assessment has troubling future consequences as climate
general topics (Fig. 7a), physical and life sciences represent change increasingly acts as a risk multiplier, including for
bright spots, with topics spread normally across both coun- reservoir operation. Although it is possible that information
tries and documents. Conversely, underlining findings from on reservoirs and risk assessments exists in gray literature,
research volume (Fig. 7), the limited spread of social sci- such as government reports and university publications, this
ences across documents represents a blind spot. For specific information is not as accessible as scientific publications and
topics (Fig. 7b), hydrology, atmospheric sciences, statistics, limits regional knowledge sharing. These findings confirm
and mathematics are bright spots across countries and doc-
https://doi.org/10.5194/hess-25-4631-2021 Hydrol. Earth Syst. Sci., 25, 4631–4650, 20214642 A. J. DeVincentis et al.: Bright and blind spots in Latin America
Figure 6. Composition of water research in LAC according to study location and top 25 % of studied research topics. On the left, countries
are identified individually and by their associated socio-hydrologic cluster. On the right, research topics are grouped by their general category.
The top 50 % of specific topics are listed within each general category.
similar results in a country-specific analysis of water research 27 nodes and 729 edges, and a maximum degree of connec-
opportunities in Brazil (Paiva et al., 2020). tivity of 5 %.
The high volume of research about Brazil (45 % of the la-
beled English corpus) motivated further investigation to see
5.4 Connectivity: Brasil é número um
if this large scientific output is proportionally more influen-
tial than the research about other countries. Brazil is a cen-
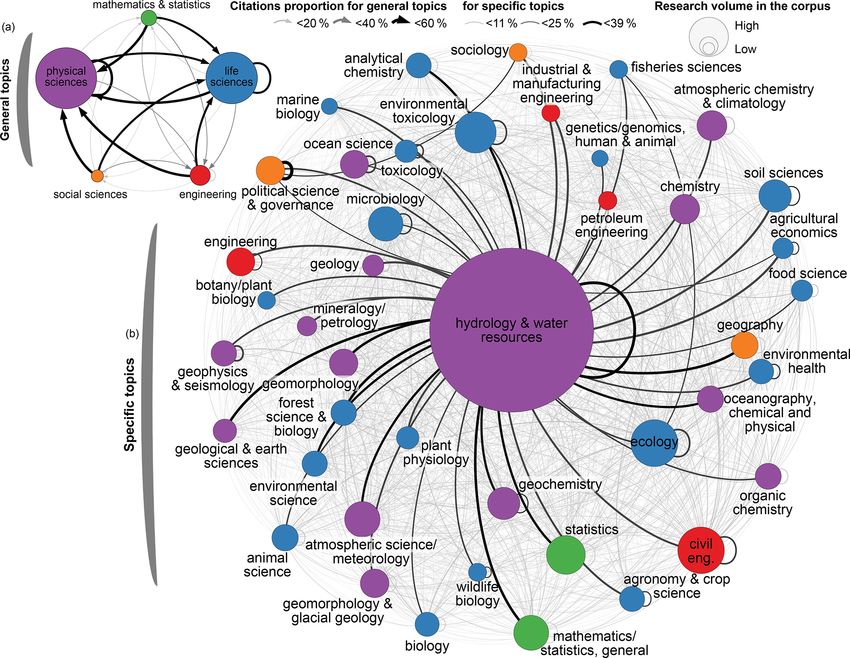
We complete our description of LAC’s water research port- tral bright spot of the citation network (Fig. 9), as citations
folio by estimating degrees of connectivity. Four network by publications from all countries, including Brazil itself, are
graphs were produced. The network graphs showed a den- primarily directed toward research about Brazil (49 %). Fur-
sity value of 1; as expected, all topics and countries are con- thermore, the geographic location or socio-hydrologic clus-
nected. The country citation network identified 23 nodes and ter of a country do not appear to indicate the extent of ci-
529 edges. The network degree of connectivity has a maxi- tations of researchers working in that country. For example,
mum degree of < 50 %, medium degree of < 30 %, and min- although Argentina and Chile share a particularly long bor-
imum degree of less than < 10 %, where each node corre- der and a rich history of political and economic ties, the ci-
sponds to a LAC country and where colors represent socio- tation network reveals only a medium degree (14 %) of con-
hydrological clusters. The general topics network identified nectivity between the two countries. Similarly, countries in
5 nodes and 25 edges, with a degree of connectivity from a the Caribbean and Central American regions that share many
maximum of 45 % to a minimum of 27 %. The specific topics similarities, including water management challenges, show a
network has 43 nodes and 1849 edges, with a maximum de- low degree of connectivity (less than 5 %).
gree of connectivity of 18 %, a medium degree of 10 % and
a minimum of 5 %. The water budget and topics network has
Hydrol. Earth Syst. Sci., 25, 4631–4650, 2021 https://doi.org/10.5194/hess-25-4631-2021A. J. DeVincentis et al.: Bright and blind spots in Latin America 4643 Figure 7. Normality of research topics for (a) general topics and (b) specific topics. Inset shows the countries excluded from the analysis (gray). Results from our survey complement findings from the ci- entific agenda within the country and a need for more in- tation network. Over half of participating researchers collab- terdisciplinary research and collaboration with international orated with researchers outside of the country(ies) they study. communities, “especially with other Latin American coun- Despite being the only Portuguese-speaking country, Brazil tries with shared water issues” (Paiva et al., 2020). was the country most often listed in collaborations within A quarter of research collaborations involve non-LAC re- LAC (17 %). Brazil’s prominence may be partially explained searchers, mostly in the United States (14 %). This may re- by the legacy of relationships formed during graduate-level flect differences in access to funds and highlights how more training when Brazilian researchers study abroad and when affluent countries can influence the scope of research con- graduate students from other South American countries study ducted in LAC. Respondents indicated that insufficient and in Brazil. Despite its greater connectivity, the review of 250 precarious funding arrangements are their main challenge. water science papers presented at the 2019 Brazilian Water 89 % of respondents said that the government is their main Resources Symposium still found a lack of a common sci- source of funding, which may explain that a country’s po- https://doi.org/10.5194/hess-25-4631-2021 Hydrol. Earth Syst. Sci., 25, 4631–4650, 2021
4644                                                             A. J. DeVincentis et al.: Bright and blind spots in Latin America

Figure 8. Normality of research topics for (a) water budget topics and (b) methods topics.

                                                                        cross-country collaboration between countries. For instance,
                                                                        22 % of researchers in the neighboring countries of Argentina
                                                                        or Chile either study both countries or collaborate with one
                                                                        another, while 24 % of those researchers report collabora-
                                                                        tion with Brazil. Researchers from Mexico and Brazil, who
                                                                        share a socio-hydrologic cluster, collaborate even less, with
                                                                        only 14 % reporting to work or collaborate in both countries,
                                                                        despite a high level of connectivity from Mexico to Brazil
                                                                        in the citation network. Conversely, more than 80 % of re-
                                                                        searchers in the Caribbean reported collaborating with re-
                                                                        searchers from other Caribbean nations and few collaborated
                                                                        with Brazil. This is in opposition to the findings from the ci-
                                                                        tation network, showing few citations within the Caribbean
                                                                        and more frequent citations of publications on Brazil, but this
                                                                        could partially be due to the limited number of articles study-
                                                                        ing the Caribbean region included in our corpus.

                                                                        5.5   Opportunities exist for building research
                                                                              communities

                                                                        We assessed the connectivity of water research throughout
                                                                        the region by aggregating research from all countries by topic
                                                                        (Fig. 10). Separate networks are presented to illustrate con-
Figure 9. Connectivity between LAC countries, measured by direc-        nectivity between the five general topics (Fig. 10a) and spe-
tional citations between articles’ country of study. The direction of   cific topics (Fig. 10b). A reciprocal relationship between the
each edge is represented by drawing it clockwise from an earlier
                                                                        physical and life sciences dominates the citation network,
node to a later node.
                                                                        while research within social sciences, engineering, and math-
                                                                        ematics is cited less often (Fig. 10a). Research connectivity
                                                                        from all subdisciplines is heavily polarized towards research
litical and economic context were mentioned as further ag-              on hydrology and water resources; however, certain topics
gravating funding availability. Funding difficulties were also          display a comparable degree of self-citation (Fig. 10b). This
associated with a lack of value given to water research and             may indicate that water resources research communities in
to the long timeframes associated with research that are mis-           political science and governance, civil engineering, ecology,
aligned with decision-makers’ timelines.                                geophysics, and toxicology are siloed or more connected to
    Furthermore, being physically close or part of the same             non-water resources research communities.
socio-hydrologic clusters did not increase the likelihood of

Hydrol. Earth Syst. Sci., 25, 4631–4650, 2021                                                https://doi.org/10.5194/hess-25-4631-2021
A. J. DeVincentis et al.: Bright and blind spots in Latin America 4645
Figure 10. Connectivity between topics of research, measured by directional citations between articles’ research topic for (a) general topics
and (b) specific topics. The direction of each edge is represented by drawing it clockwise from an earlier node to a later node.
Interestingly, behind these few silos and the central node, erature would increase the size of the Spanish and Portuguese
a vast network of connectivity exists. While this level of con- corpora. Of the literature we found, very little focused on
nectivity is low (less than 10 %), it supports the character- Caribbean countries, and this lack of information limited
ization of water resources as a scientific discipline where subsequent analysis. A targeted method of corpus augmen-
research topics are already integrated (Rosbjerg and Rodda, tation and human-read validation towards less-represented
2019), albeit with room for strengthened interdisciplinarity. countries and topics will likely increase the model’s pre-
Survey respondents confirm this low level of background dictive capabilities and may improve the representation of
connectivity, reporting dissatisfaction with the interdisci- Caribbean countries.
plinarity of their research. Nonetheless, an opportunity ex- In addition, while the presented citation network included
ists to build off these existing connections to form commu- all LAC countries, the exclusion of countries outside of LAC
nities of researchers and strengthen research impact through prevented a more comprehensive analysis of LAC countries’
knowledge sharing and collaboration across disciplines (Uzzi reliance on non-regional research. Survey responses sug-
et al., 2013; Astudillo, 2016; Larivière et al., 2015). gested that reliance on non-LAC research was high, as re-
searchers stated they were more likely to collaborate with
5.6 Limitations and future research opportunities scientists outside of LAC than within LAC. Inclusion of non-
LAC countries in the analysis of scientific interactions could
present many opportunities for expanding our findings in fu-
The wide scope of this study, intended to capture the breadth ture research. Finally, our study indicated where bright and
of the state of water resources research across LAC, required blind spots appear across research in LAC, but did not aim to
inevitable compromises in the depth of information and the examine causal relations for these patterns, a common short-
subsequent ability to thoroughly interpret our results. No- coming in Science of Science (Fortunato et al., 2018). Sur-
tably, much scientific literature in Spanish and Portuguese vey results indicate that funding for research is an important
was not readily available or accessible online, and this re- driver influencing where bright and blind spots occur.
sulted in the need to rely on English publications as a proxy
of research across LAC. A targeted method to collect gray lit-
https://doi.org/10.5194/hess-25-4631-2021 Hydrol. Earth Syst. Sci., 25, 4631–4650, 20214646 A. J. DeVincentis et al.: Bright and blind spots in Latin America However, a more comprehensive answer would require exploring historical, political, economic, and social dynam- ics influencing the allocation of research resources. Overall, this work displays the value of our novel method to inter- pret results from machine learning, points to the need for a deeper and wider understanding of existing water resources research in water vulnerable regions, and warrants expanding our methods to include gray literature and coverage across the Global South. 6 Conclusions This unprecedented multilingual literature review provides insights into bright and blind spots of water research through- out LAC. Our results reveal that the region’s vulnerabil- ity to water-related stresses, and drivers such as climate change, is compounded by research blind spots in certain topics (e.g. reservoirs and risk assessment) and in entire subregions (e.g. Caribbean nations). Although certain top- ics and countries are under-studied in relation to the rest of the corpus, research on most components of the water budget (e.g. precipitation) represents a bright spot and suggests that most countries can make science-informed decisions regard- ing their water management. Research on water resources in Brazil dominates the research landscape, representing an- other bright spot. However, Brazil’s dominance also high- lights a regional vulnerability: while research on Brazil is vast, well-rounded, and highly influential across LAC, fund- ing cuts and policy shifts that affect the country’s scientific output can halt progress and impede scientifically informed water management throughout the region. Supporting soci- etal and ecological needs while addressing challenges linked with future water-related risks will depend on countries’ abil- ities to improve the accessibility of existing research (in En- glish, Spanish, and Portuguese), expand research in under- studied topics (particularly in the social sciences), and har- ness existing opportunities for knowledge sharing. Hydrol. Earth Syst. Sci., 25, 4631–4650, 2021 https://doi.org/10.5194/hess-25-4631-2021
You can also read