Bright lights in the big cities: migratory birds' exposure to artificial light
←
→
Page content transcription
If your browser does not render page correctly, please read the page content below
RES EARCH COMMU NICATIONS 1
Bright lights in the big cities: migratory birds’
exposure to artificial light
Kyle G Horton1*, Cecilia Nilsson1, Benjamin M Van Doren2, Frank A La Sorte1, Adriaan M Dokter1, and Andrew Farnsworth1
Many species of migratory birds have evolved the ability to migrate at night, and the recent and rapid expansion of artificial light
at night has markedly altered the nighttime sky through which they travel. Migrating birds regularly pass through heavily illumi-
nated landscapes, and bright lights affect avian orientation. But risks to migrating birds from artificial light are not spatially or
temporally uniform, representing a challenge for mitigating potential hazards and developing action plans to catalog risks at con-
tinental scales. We leveraged over two decades of remote-sensing data collected by weather surveillance radar and satellite-based
sensors to identify locations and times of year when the highest numbers of migrating birds are exposed to light pollution in the
contiguous US. Our continental-scale quantification of light exposure provides a novel opportunity for dynamic and targeted con-
servation strategies to address the hazards posed by light pollution to nocturnally migrating birds.
Front Ecol Environ 2019; doi:10.1002/fee.2029
T rillions of flying organisms (eg birds, bats, insects) occupy
the airspace within the troposphere during different peri-
ods of their annual cycles (Diehl 2013). The recent recognition
et al. 2008) as well as weather factors such as fog and precipita-
tion (Gauthreux and Belser 2005). High-power light installa-
tions can even attract migrants in already heavily photo-
of airspace as vital habitat – one that is subject to increasing polluted areas and in skies with clear weather conditions (Van
modification by humans – highlights the fundamental need to Doren et al. 2017).
understand how organisms cope with such alterations An increasing number of artificial structures are now pres-
(Lambertucci et al. 2015), which pose numerous challenges to ent in the lowest reaches of the troposphere (Davy et al. 2017),
airborne organisms during periods of transit, including noc- and their continued expansion poses an ever-increasing threat
turnally migrating birds. Of the nearly 630 terrestrial species of to wildlife. In the contiguous US, annual fatal bird collisions
birds regularly occurring in North America, approximately with buildings, communication towers, power lines, and wind
70% are considered migratory, and of these more than 80% turbines cumulatively number in the hundreds of millions
migrate at night (WebTable 1). Yet most studies of associated (Loss et al. 2015). For nocturnally migrating birds, direct
risks have focused on terrestrial habitats, underscoring a fun- mortality as a result of collisions due to attraction to light
damental knowledge gap that can be addressed with recent (Gauthreux and Belser 2005) is the most obvious and direct
technological (including computational) advances. effect of ALAN, but there are also more subtle effects, such as
Light pollution of the airspace is a relatively recent but disrupted orientation (Poot et al. 2008) and changes in habitat
growing threat to nocturnally migrating birds (Longcore and selection (McLaren et al. 2018). There is also growing evidence
Rich 2004; Van Doren et al. 2017; Cabrera-Cruz et al. 2018). that light pollution alters behavior at regional scales, with
Increasing urbanization has greatly amplified the amount of migrants occupying urban centers at higher- than-expected
artificial light at night (ALAN; Kyba et al. 2017), with almost rates as a function of urban illumination (La Sorte et al. 2017).
one- half of the contiguous US experiencing substantially While ALAN acts as an attractant at both large (La Sorte et al.
photo-polluted nights (Falchi et al. 2016). Light sources – 2017) and local (Van Doren et al. 2017) scales, there is also
including streetlights, safety lights, and extensively lit buildings evidence of migrating birds avoiding strongly lit areas when
– can disturb wildlife in a multitude of ways (Gauthreux and selecting critical resting sites needed to rebuild energy stores
Belser 2005; Hölker et al. 2010; Rodríguez et al. 2017). High- (McLaren et al. 2018).
power light installations like lighthouses and communication
towers are known to attract nocturnal migrants and are Challenges to conservation and mitigation
responsible for substantial mortality (Gauthreux and Belser
2005; Longcore et al. 2012). The numbers of birds attracted to To date, mitigating actions to reduce impacts of ALAN
or trapped by illumination depend on light wavelength (Poot have involved directed and specific efforts, including reduc-
tions in excess lighting, the periodic switching off of high-
1
Cornell Lab of Ornithology, Cornell University, Ithaca, NY intensity lights (Van Doren et al. 2017), and adjusting
*(kgh48@cornell.edu); 2Edward Grey Institute, Department of wavelengths in situations where lights cannot be shut down
Zoology, University of Oxford, Oxford, UK (Poot et al. 2008; Longcore et al. 2018). These actions are
© The Ecological Society of America Front Ecol Environ doi:10.1002/fee.2029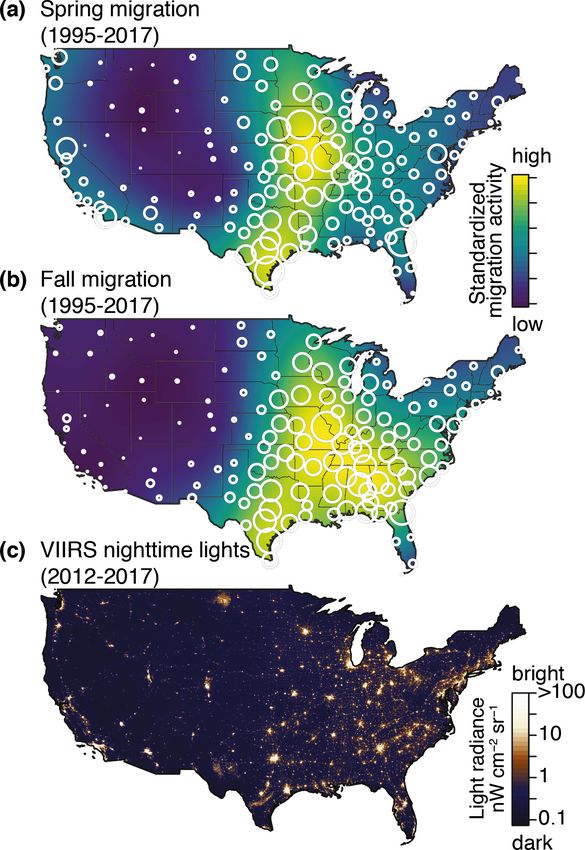
2 RE S E ARC H CO M M UN I CAT I O N S KG Horto et al.
to 15 November) between spring 1995 and spring 2017 to
characterize cumulative migration activity across the contig-
uous US. We acquired radar data through the Amazon Web
Service portal, extracting data from a 30- minute window
centered on 3 hours after local sunset. This time period was
chosen because it represents the average peak in nocturnal
migratory activity (eg Farnsworth et al. 2015; Horton et al.
2015; see Horton et al. [2018] and Van Doren and Horton
[2018] for additional details regarding radar processing).
With respect to creating profiles of migration activity, we
calculated altitude, speed, and direction using the lowest
elevation scans (0.5–4.5°) at distances of 5 km to 37.5 km
from the radar station (Farnsworth et al. 2015). We deter-
mined migration activity from reflectivity (η, cm2 km−3) and
flight direction and groundspeed from radial velocity
between 100 m and 3000 m above ground level, at 100-m
altitudinal bins using the WSRLIB package (Sheldon 2015).
We excluded altitudinal bins with velocity azimuth displays
with root mean squared error (RMSE) 5 m s−1 to limit poor fits. In addition, we
removed slow-flying objects (airspeed 50%).
Methods To extrapolate migration activity to areas not sampled by the
radars, we relied on a generalized additive model using the R
Weather surveillance radar
package “mgcv” (Wood 2011; R Core Team 2017). We first cal-
We used weather surveillance radar (WSR) data from 143 culated the average migration activity for each ordinal day
stations from spring (1 March to 31 May) and fall (15 August across all years and then summed each night through the sea-
Front Ecol Environ doi:10.1002/fee.2029 © The Ecological Society of America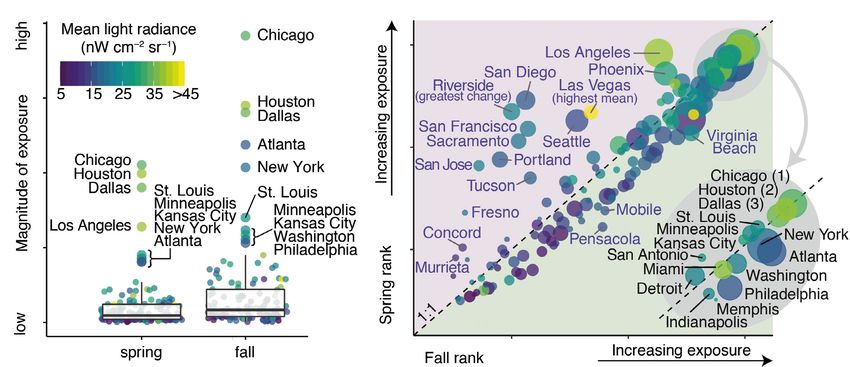
Nocturnally migrating birds and artificial light RES EARCH COMMU NICATIONS 3
son to estimate the cumulative migration activity for each radar
station. We fit radar station latitude, longitude, and the interac-
tion of latitude and longitude with smoothing splines to predict
the cumulative seasonal activity across the contiguous US.
Artificial light at night
We used the monthly Day/Night Band (DNB) product from
the Visible Infrared Imaging Radiometer Suite (VIIRS) onboard
the joint National Oceanic and Atmospheric Administration
(NOAA)/National Aeronautics and Space Administration Suomi-
NPP satellite to quantify the magnitude of ALAN radiance
(Earth Observation Group, NOAA National Geophysical Data
Center; https://bit.ly/2nCjqvz). Monthly composites of radiance
(nanoWatts per square centimeter per steradian; nW cm−2
sr−1) are projected at 15 arc-second geographic resolution and
are filtered to exclude data from stray light, lightning, lunar
illumination, and cloud cover. However, because these data
are not filtered for auroras and fires, we averaged across 3
months (October–December) over 6 years (2012–2017) to
dampen the influence of episodic lighting events; these months
were chosen because they fall outside the primary storm season
in North America, which would obscure radiance measures.
As an added step to ensure data quality, we excluded any
pixel with fewer than 5 use-days prior to averaging monthly
composites. Finally, we removed pixels with radiance values
greater than 900 nW cm−2 sr−1 to remove wildfires and other
ephemeral high-intensity lighting events (Kyba et al. 2017).
Exposure index calculation
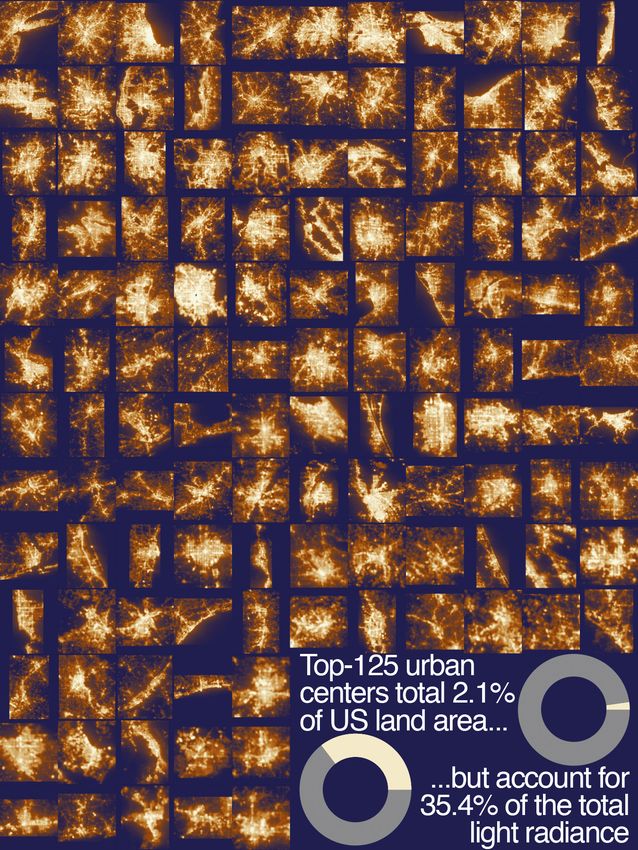
To quantify migrant exposure to ALAN, we summarized Figure 2. Average cumulative distribution of migrant birds during (a)
exposure at two levels: (1) across the contiguous US and spring and (b) fall migrations from 1995 to 2017 measured by weather
(2) in the top 125 largest urban centers by area (Figure 1). surveillance radar (WSR). Circles indicate WSR station locations and are
We used the 2017 US Census database to define the bound- scaled to cumulative migration activity. The magnitudes of spring and fall
aries of these urban centers and used the primary city cumulative movements are standardized to the same range. (c) Log10-
name in our presentation of urban area (eg Dallas–Fort scaled mean radiance of ALAN measured by the VIIRS on the Suomi-NPP
Worth–Arlington, Texas, is presented as “Dallas”). Across satellite.
the contiguous US, we calculated exposure as the product
of cumulative migration activity × radiance, whereas over in distribution in the fall (Figure 2b). In the western US,
urban areas we calculated exposure as the product of cumu- we observed greater migratory activity in the spring than
lative migration activity × summed radiance of the entire in the fall. Furthermore, we observed a 63% increase in
urban area. To differentiate seasonal differences irrespective cumulative migratory activity from spring to fall. Examining
of increases in bird populations, we standardized cumulative the annual nightly pulses of migratory movements at each
migratory activity to range between 0 and 1, and standard- radar station, we observed that half of the cumulative migra-
ized activity relative to the highest value across the contiguous tory activity passed each station in 6.2 ± 2.5 (mean ± stand-
US. Exposure difference was calculated as the product of ard deviation [SD]) nights in spring and 7.1 ± 2.6 nights
log10-scaled VIIRS radiance (standardized 0 to 1) and sea- in fall.
sonal differences in migratory activity.
Light pollution
Results The general pattern of nightly radiance showed greater aver-
Migration activity age radiance in the eastern half of the US, with a few notable
exceptions from urban areas in the Pacific states, Desert
Migration activity in spring was greatest in the central US Southwest, and a few Rocky Mountain cities (Figure 2c).
(Figure 2a) and generally more widespread and more easterly As expected, the strongest radiance values were observed
© The Ecological Society of America Front Ecol Environ doi:10.1002/fee.2029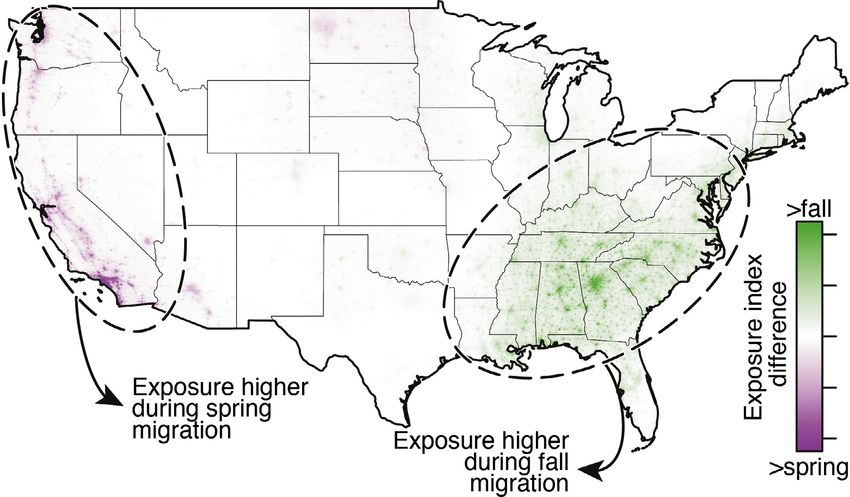
4 RE S E ARC H CO M M UN I CAT I O N S KG Horto et al.
fall exposure rankings, respectively. Six areas,
including Chicago, Houston, and Dallas,
showed no change in ranking (Figure 4b). Of
the 125 largest US cities, the top 10 greatest
changes in seasonal rankings occurred in west-
ern states (eg Riverside, San Diego, San Jose;
Figure 4b). Of the top 10 risks for exposure,
the majority occurred in the central US: seven
in spring and six in fall.
Discussion
We conducted a quantitative assessment of
continent-scale exposure of actively migrating
birds to nighttime light pollution. The findings
leverage recent advances in data access and
Figure 3. Seasonal differences in exposure to ALAN. The magnitude of spring and fall cumula- machine learning to capture new and rich
tive movements were standardized to the same range (0 to 1) to highlight seasonal differences details in characterizing bird movements aloft
in migratory routes. Exposure difference was calculated as the product of log10-scaled VIIRS in relation to radiance from human population
radiance (standardized 0 to 1) and seasonal differences in migratory activity. centers. With considerations for urban areas
and the numbers of migrants flying above
in urban areas. Across the US, 69.5% of the summed linear them, we can now provide the data necessary to guide con-
light radiance came from just 5% of the land area. The top servation actions to identify locations where ALAN-reducing
125 largest urban areas accounted for only 2.1% of total programs may be most effective.
land area and 35.4% of total summed linear radiance.
Shifted seasonal distributions
Continental exposure risk Greater abundance of migrants in fall increases the number
Increased migratory activity during fall was observed in of birds at risk to ALAN, which was apparent in the gen-
almost all areas, resulting in 53.8% higher total of exposure eral increase in exposure indices from spring to fall. However,
in the fall. After standardizing for differences in overall shifts in migratory routes between spring and fall migration
migration activity between seasons, we determined that there also affect the numbers of birds exposed to higher light
was still a 13.1% higher sum of exposure in the fall, when levels (Figure 2). More easterly fall routes, often described
migrants moved through more photo-polluted airspaces in as looped migration (La Sorte et al. 2014), take birds over
the eastern half of the US (Figure 3). Departures from this more heavily photo-polluted areas than do spring routes,
trend were evident in the western half of the country, where leading to even higher numbers of birds – and many young
spring movements along the Pacific coast led to higher spring birds – exposed to ALAN in fall. At most sites, exposure
exposure (Figure 3). indices are therefore higher during fall than in spring,
indicating that any mitigation efforts (eg lights-out cam-
Urban exposure risk over the 125 largest US cites paigns) would have a larger effect during the fall, especially
with juveniles as they undertake their first migratory jour-
Mean avian light exposure in cities was 24 times as high
ney. However, while the risk of mortality for juveniles is
as the countrywide average. Larger cities tended toward greater
likely to increase in the fall, any effects of ALAN on migrants
exposure risk (linear regression, spring: F1,123 = 135.8, P <
in the spring will directly affect breeding activities. Birds
0.001, R2 = 0.52; fall: F1,123 = 203.1, P < 0.001, R2 = 0.62),
moving along westerly routes during spring migration are
but there were notable exceptions, such as Boston (4th in
the exception to this general pattern, likely related to their
size but 36th and 24th in exposure in spring and fall) and
use of more westerly, low-elevation routes during spring
Des Moines (99th in size but 28th and 36th in exposure in
as compared to fall (La Sorte et al. 2014). For example,
spring and fall) (WebTable 2). Regardless of season, the
the patterns in Los Angeles and other cities in California
highest levels of exposure to anthropogenic light at night
are the opposite of most East Coast cities, with higher
were observed in Chicago, Houston, and Dallas, in descending
exposure during spring migration (Figures 3 and 4).
order (Figure 4; see WebTable 2 for a complete list). These
three cities showed exposure magnitudes that were 19 (spring)
Uneven temporal distributions
to 21 (fall) times as high as the median exposure of the
remaining 122 cities (Figure 4a). In total, 45 and 74 urban Migration periods may span more than 6 months in total,
areas exhibited higher spring exposure rankings and higher with hundreds of millions of individual migrants aloft on a
Front Ecol Environ doi:10.1002/fee.2029 © The Ecological Society of AmericaNocturnally migrating birds and artificial light RES EARCH COMMU NICATIONS 5
(a) (b)
Figure 4. Seasonal (a) magnitude and (b) relative rankings of the 125 largest urban areas in the continental US. Point color shaded by the mean light radi-
ance and sizes (in [b]) are scaled by the square root of urban area. (a) Only urban areas outside the 25th and 75th quartiles are labeled and (b) areas with
a change in seasonal rank of ≥20 positions are labeled and identified in blue. Inset in (b) depicts the top 15 (spring or fall) rankings; note that Los Angeles
and Phoenix show both ranking changes ≥20 and are ranked in the top 15, and therefore are not included in the inset. Urban areas in the purple shading
(above the 1:1 dashed line) had higher spring exposure rankings, whereas those in the green shading (below the 1:1 dashed line) had higher fall exposure
rankings.
given night; however, their passage occurs in sporadic waves, differing sources. In addition, the extent to which species
with a large majority of birds passing individual sites during – or even populations – differentially respond to ALAN
just a few peak nights. We observed that half of the total remains unclear, but could have important conservation
number of migrants for each season passed each radar site implications. Furthermore, different datasets are available (eg
in just 6.7 ± 2.6 (mean ± SD) nights, a notable finding when a world atlas of artificial night sky brightness; Falchi et al.
paired with the recent capacity to confidently forecast (12–72 2016), which may provide valuable information for charac-
hours in advance) these episodic events (Van Doren and terizing ALAN’s disruptions to aerial organismal biology (eg
Horton 2018). This advance has the potential to offer a detailed horizon glow versus upward radiance). Although we did
and tailored guide for mitigation actions to substantially lower not directly compare different sources of ALAN information
the numbers of birds exposed to risks of ALAN while simul- with respect to exposure risks, we believe that such com-
taneously minimizing adverse effects to stakeholders, including parisons will be fundamentally important.
municipalities and industry. In addition, birds disproportion- Reducing nighttime lights for the benefit of migrants and
ately use modified habitats (eg urban areas) during fall migra- other wildlife represents yet another instance of anthropogenic
tion (Zuckerberg et al. 2016), and because migrants are more and environmental trade-offs, in this case among avian safety,
numerous and less experienced in fall, an emphasis on fall human safety, energy expenditure, and societal and psycholog-
mitigation efforts is especially important. ical expectations. It is therefore important that conservation
efforts and future research are directed to the times and places
Conclusions where they will have the largest impact. An important step in
this direction is identifying where the highest numbers of birds
ALAN continues to increase in many areas globally (Kyba are exposed to the highest amounts of ALAN. Here we have
et al. 2017), presenting an ever-growing ecological threat to shown where the greatest threats exist, and how these threats
all nocturnally active animals (Longcore and Rich 2004; vary seasonally. The combination of large amounts of noctur-
Guetté et al. 2018), particularly migrating birds. Concerted nal illumination and their location in the most trafficked air-
conservation efforts at local (eg Van Doren et al. 2017) and space across the US elevate metropolitan Chicago, Houston,
continental scales are necessary to reduce exposure of migrants and Dallas to the top of the exposure risk ranking. While all
to light pollution. The disproportionate relationship between urban areas should take care to minimize ALAN, our analysis
the land area occupied by cities and the amount of ALAN indicates that actions taken in these particular cities would
emitted leaves little doubt where conservation action is most benefit the largest numbers of birds. Through our analysis, we
needed: urban centers. Such efforts require balance with the have identified risk; however, directly linking risk with adverse
needs of stakeholders. ALAN ranges from bright sources effects on bird populations is a challenge, and future research is
to dim stray light, and it remains an open question how needed to fully understand the impacts of ALAN on migratory
conservation action should be prioritized over these widely species.
© The Ecological Society of America Front Ecol Environ doi:10.1002/fee.20296 RE S E ARC H CO M M UN I CAT I O N S KG Horto et al.
Acknowledgements Lambertucci SA, Shepard ELC, and Wilson RP. 2015. Human–wild-
life conflicts in a crowded airspace. Science 348: 502–04.
We thank S Kelling for constructive feedback on early drafts Larkin RP. 1991. Flight speeds observed with radar, a correction: slow
of this manuscript. This work was supported by three Edward “birds” are insects. Behav Ecol Sociobiol 29: 221–24.
W Rose Postdoctoral Fellowships, Marshall Aid Comme Liaw A and Wiener M. 2002. Classification and regression by ran-
moration Commission, Leon Levy Foundation, Wolf Creek domForest. R News 2: 18–22.
Charitable Foundation, and US National Science Foundation Longcore T and Rich C. 2004. Ecological light pollution. Front Ecol
IIS-1633206 and DBI-1661329. Environ 2: 191–98.
Longcore T, Rich C, Mineau P, et al. 2012. An estimate of avian mor-
References tality at communication towers in the United States and Canada.
PLoS ONE 7: e34025.
Cabrera-Cruz SA, Smolinsky JA, and Buler JJ. 2018. Light pollution is Longcore T, Rodríguez A, Witherington B, et al. 2018. Rapid assess-
greatest within migration passage areas for nocturnally-migrating ment of lamp spectrum to quantify ecological effects of light at
birds around the world. Sci Rep-UK 8: 3261. night. J Exp Zool Part A 329: 511–21.
Davy CM, Ford AT, and Fraser KC. 2017. Aeroconservation for the Loss SR, Will T, and Marra PP. 2015. Direct mortality of birds from
fragmented skies. Conserv Lett 10: 773–80. anthropogenic causes. Annu Rev Ecol Evol S 46: 99–120.
Diehl RH. 2013. The airspace is habitat. Trends Ecol Evol 28: 377–79. McLaren JD, Buler JJ, Schreckengost T, et al. 2018. Artificial light at
Falchi F, Cinzano P, Duriscoe D, et al. 2016. The new world atlas of night confounds broad-scale habitat use by migrating birds. Ecol
artificial night sky brightness. Science Advances 2: e1600377. Lett 21: 356–64.
Farnsworth A, Van Doren BM, Hochachka WM, et al. 2015. A char- Poot H, Ens BJ, De Vries H, et al. 2008. Green light for nocturnally
acterization of autumn nocturnal migration detected by weather migrating birds. Ecol Soc 13: 47.
surveillance radars in the northeastern US. Ecol Appl 26: 752–70. R Core Team. 2017. R: a language and environment for statistical
Gauthreux SA and Belser CG. 2005. Effects of artificial night lighting on computing. Vienna, Austria: R Foundation for Statistical
migrating birds. In: Rich C and Longcore T (Eds). Ecological conse- Computing.
quences of artificial night lighting. Washington, DC: Island Press. Rodríguez A, Holmes ND, Ryan PG, et al. 2017. Seabird mortality
Guetté A, Godet L, Juigner M, and Robin M. 2018. Worldwide induced by land- based artificial lights. Conserv Biol 31:
increase in artificial light at night around protected areas and 986–1001.
within biodiversity hotspots. Biol Conserv 223: 97–103. Sheldon D. 2015. WSRLIB: MATLAB toolbox for weather surveil-
Hölker F, Wolter C, Perkin EK, and Tockner K. 2010. Light pollution lance radar. Amherst, MA: School of Computing, University of
as a biodiversity threat. Trends Ecol Evol 25: 681–82. Massachusetts.
Horton KG, Shriver WG, and Buler JJ. 2015. A comparison of traffic Van Doren BM and Horton KG. 2018. A continental system for fore-
estimates of nocturnal flying animals using radar, thermal imag- casting bird migration. Science 361: 1115–18.
ing, and acoustic recording. Ecol Appl 25: 390–401. Van Doren BM, Horton KG, Dokter AM, et al. 2017. High-intensity
Horton KG, Van Doren BM, La Sorte FA, et al. 2018. Navigating urban light installation dramatically alters nocturnal bird migra-
north: how body mass and winds shape avian flight behaviours tion. P Natl Acad Sci USA 114: 11175–80.
across a North American migratory flyway. Ecol Lett 21: 1055–64. Wood SN. 2011. Fast stable restricted maximum likelihood and mar-
Horton KG, Van Doren BM, La Sorte FA, et al. 2019. Holding steady: ginal likelihood estimation of semiparametric generalized linear
little change in intensity or timing of bird migration over the Gulf models. J Roy Stat Soc B 73: 3–36.
of Mexico. Glob Change Biol 25: 1106–18. Zuckerberg B, Fink D, La Sorte F, et al. 2016. Novel seasonal land
Kyba CCM, Kuester T, de Miguel AS, et al. 2017. Artificially lit sur- cover associations for eastern North American forest birds identi-
face of Earth at night increasing in radiance and extent. Science fied through dynamic species distribution modelling. Divers
Advances 3: e1701528. Distrib 22: 717–30.
La Sorte FA, Fink D, Buler JJ, et al. 2017. Seasonal associations with
urban light pollution for nocturnally migrating bird populations. Supporting Information
Glob Change Biol 23: 4609–19.
La Sorte FA, Fink D, Hochachka WM, et al. 2014. Spring phenology Additional, web-only material may be found in the online
of ecological productivity contributes to the use of looped migra- version of this article at http://onlinelibrary.wiley.com/doi/
tion strategies by birds. P Roy Soc B-Biol Sci 281: 20140984. 10.1002/fee.2029/suppinfo
Front Ecol Environ doi:10.1002/fee.2029 © The Ecological Society of AmericaYou can also read