COMPUTATIONAL MODEL FOR ANALYSIS SPREAD IN FLOOD CHANNELS URBAN DRAINAGE MODELO COMPUTACIONAL PARA EL ANÁLISIS DE LA PROPAGACIÓN DE LA INUNDACIÓN ...
←
→
Page content transcription
If your browser does not render page correctly, please read the page content below
Aqua-LAC - Vol. 4 - Nº 2 - Dic. 2012. pp. 19 - 28.

     COMPUTATIONAL MODEL FOR ANALYSIS SPREAD IN FLOOD CHANNELS URBAN DRAINAGE

                    MODELO COMPUTACIONAL PARA EL ANÁLISIS DE LA PROPAGACIÓN
                      DE LA INUNDACIÓN EN LOS CANALES DE DRENAJE URBANO

                                                 Stênio de Sousa Venâncio*
                                          Luiz Fernando Resende dos Santos Anjo**

ABSTRACT
The scenario analysis for knowledge of the transitional system of urban macro drainage work is necessary for the planning
of structural and nonstructural measurements. To this end, a computational model 1D is presented to study the flood propa-
gation in urban drainage channels. This work investigates the unsteady flow in the Cocó River estuary, located in the city of
Fortaleza-CE. It is one of the cases studied in the first author’s graduate program, which proposes a computation model to
simulate unsteady flows of open channels with many purposes (such as hydroelectric power, water supply, irrigation, etc.)
and contributes to automation of their operational control systems . The determination of maximum water level achieved
along the estuary is the aim of this study, having practical application on the definition of elevation of streets, avenues and
new constructions to be executed on the border or inside the flood areas. The complete 1D hydrodynamic equations of
Saint-Venant are approximated by a completely implicit method of finite differences and conveniently discretized for the
model, which was developed in FORTRAN language. The flow given by the entrance hydrograph of the analyzed estuary
(upstream boundary condition) was obtained for a return period of 50 years. The water depth is the boundary condition
downstream of the problem, and its variation, obtained by measuring the tide in a 24 hour period, was approached by a
mathematical function. This function was obtained for the purpose of measuring the maximum water level that occurs in
the estuary. Was still considered to two lateral hydrographs and an inflow distributed along the estuary. The unsteady flow
analysis is based on the temporal results of water level and flow at several cross sections of the estuary.
Keywords: urban flooding, macrodrainage, computational model.

RESUMEN
El análisis de escenarios para el conocimiento del sistema transitorio de obra de drenaje urbano macro son necesaria
para la planificación de medidas estructurales y no estructurales. Con este fin, se presenta un modelo computacional 1D
para estudiar la propagación de inundación en los canales de drenaje urbano. Este trabajo investiga el flujo transitorio en
la desembocadura del río Cocó, ubicado en la ciudad de Fortaleza-CE. Es uno de los casos estudiados en el programa
de posgrado del primer autor, que propone un modelo de computación para simular flujos inestables de canales abiertos
con muchos propósitos (por ejemplo, energía hidroeléctrica, abastecimiento de agua, riego, etc.) y contribuye a la au-
tomatización de sus sistemas de control operacional. La determinación del nivel de agua máximo alcanzado a lo largo del
estuario es el objetivo de este estudio, teniendo aplicación práctica en la definición de la elevación de las calles, avenidas
y nuevas construcciones para ser ejecutado en la frontera de o dentro de las áreas de inundación. Las ecuaciones hi-
drodinámicas completa de 1D de Saint-Venant son aproximadas por un método totalmente implícito de diferencias finitas y
discretizar convenientemente para el modelo, que fue desarrollado en lenguaje FORTRAN. El flujo dado por el hidrograma
de entrada de la ría analizado (condición de frontera aguas arriba) se obtuvo para un periodo de retorno de 50 años. La
profundidad del agua es la condición de frontera aguas abajo del problema, y su variación, obtenidos mediante la medición
de la marea en un período de 24 horas, fue abordado por una función matemática. Esta función se obtuvo con el propósito
de medir el nivel máximo de agua que se produce en el estuario. Todavía era considerado a dos hidrogramas laterales y
una afluencia distribuidos a lo largo del estuario. El análisis de flujo transitorio se basa en los resultados temporales de
flujo en varias secciones transversales de la ría y el nivel del agua.
Palabras clave: las inundaciones urbanas, macrodrenaje, modelo computacional.

*       Prof. Adjunto II - Departamento de Engenharia Civil, Instituto de Ciências Tecnológicas e Exatas - ICTE, Universidade Federal
        do Triângulo Mineiro - UFTM
**      Professor Adjunto III da Universidade Federal do Triângulo Mineiro (UFTM) e Diretor do Instituto de Ciências Tecnológicas e
        Exatas (ICTE) da UFTM, Departamento das Engenharias, Universidade Federal do Triângulo Mineiro

                                                                                                                  Recibido: 10/7/2012
                                                                                                                 Aceptado: 31/08/2013

18                                              Aqua-LAC - Vol. 4 - Nº. 2 - Set. 2012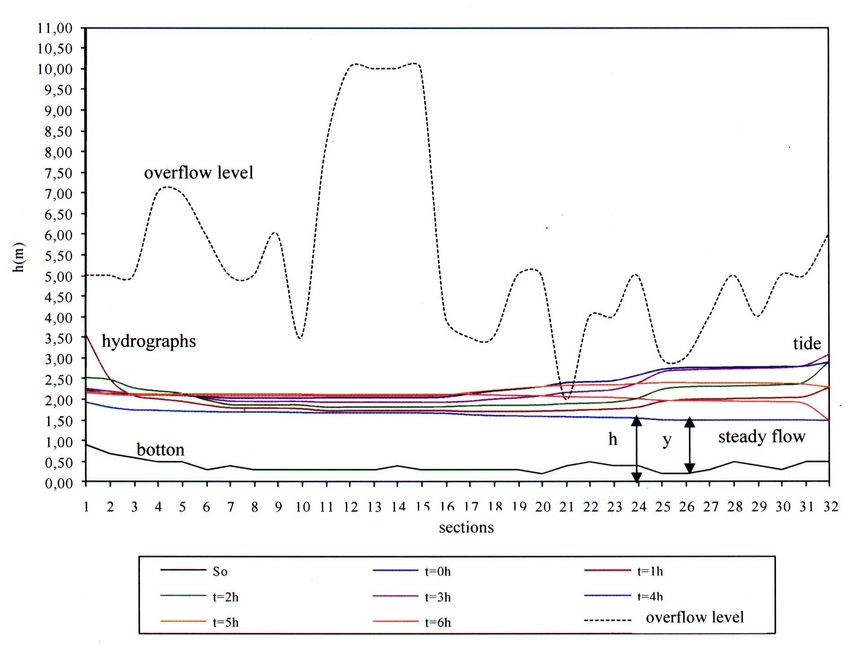
Comptational Model for Analysis Spread in Flood Channels Urban Drainage

1. INTRODUCTION                                                   ages is in the restriction of access to source code,
                                                                  which complicates the understanding of certain types
The growth of cities was not accompanied by govern-
                                                                  of errors, besides many of them do not include impor-
ing instruments for the soil use and occupation. As
                                                                  tant parameters in the analysis process, or are not
stated by CRUZ & TUCCI (2008):
                                                                  used properly by users. One of these parameters is
      “According to IBGE (2000), considering                      sediment transport, whose effect impact in reducing
      5.507 Brazilian municipalities, only 841                    flow capacity of the urban drainage channels. Some
      have Urban Master Plans (PDU) (15.3%),                      conclusions about the hydrosedimentological simu-
      and of these, only 489 in the latest ver-                   lation are presented at the end, from the literature
      sion of the plan are later than 1990 (8.9%                  review by Venâncio (2009). The description of the
      ). When analyzing only those cities with                    item 2.2 (Numerical Model) is presented in Venâncio,
      population exceeding 20,000 inhabitants,                    Sousa and; Villela (2005).
      485 have PDU from a total of 1483 mu-
      nicipalities (32.7%). Even where there are
      PDUs, most of these plans only deal with                    2. METHODOLOGY.
      architectural aspects, without considering                  2.1 Study Area.
      environmental effects and especially on the
      drainage infrastructure. Within the urban                   The Rio Coco is part of the basin of the rivers in the
      practices that have spread across the coun-                 east coast of Ceará, with its catchment area of ap-
      try, the use of valleys avenues associated                  proximately 485 km ², with a total length of the main
      with the plumbing of urban streams was                      river about 50 km (SEMACE, 2012). The river runs
      observed. This sort of urbanization ampli-                  through the municipalities of Pacatuba, Maracanaú
      fies the impacts and changes the environ-                   and Fortaleza, and its source is situated on the east-
      ment in an inappropriate way. Solutions of                  ern slope of the Sierra Aratanha. Its mouth is on the
      this type generally have a cost much higher                 edge of the beaches of Hunting and Fishing and Sa-
      than a sustainable solution and increased                   biaguaba, thus emptying into the Atlantic Ocean. The
      losses due to flooding, erosion and water                   Coco River Basin is considered the largest river in
      quality. The sum of technical ignorance of                  the city of Fortaleza, it has 25 km of its length in the
      an important part of professionals working                  capital.
      on drainage, population and policy makers                   The area chosen for analysis in question is the entire
      have kept this scene.”                                      area that is related to influence Coco River estuary,
Changing this setting requires changing the strategic             and comprises approximately 15 km of the length of
pattern of the city integrated planning and it involves:          the river from its mouth upstream, within the limits
urban planning and soil use, sanitation, solid waste              of the city of Fortaleza (Figure 1). The portion of the
and urban drainage. All these elements have strong                river, which is the state capital of Ceará, has man-
interference with each other and require integrated               grove ecosystem associated with fluvial-marine plain,
solutions.                                                        which occupies the excerpts from the river located on
                                                                  BR-116 to its mouth, where it forms an estuary.
All this dynamic and the increased frequency of floods
in recent decades have become increasingly impor-                 These areas due to favorable conditions such as
tant to incorporate tools to help the decision making             mixing of saline water with fresh water, soil type, low
process in the management of urban drainage.                      coefficients of oxygen in the soil (ie, reducing envi-
                                                                  ronment) and tidal regimes, the dominant species are
The change in rainfall patterns, widely treated by the
                                                                  Rhizophora mangle L, Avicenia Schaveriana Stapf
media on the issue of global climate change, is an
                                                                  and Leech, and Laguncularia racemosa (SEMACE,
aggravating factor in the secure management of ur-
                                                                  2012).
ban infrastructure in terms of flooding, with additional
impact on the coastal cities where the tide cycle is              Natural environments are subject Cocó intensely
decisive in determining timing of water levels in the             human activity that intervenes significantly through
drainage channel.                                                 constructions of households, urban roads, public fa-
                                                                  cilities and commercial developments. These urban
According to Mark et al. (2004), with the current ad-
                                                                  facilities directly interfere in sedimentary processes,
vances in computer technology, many cities in de-
                                                                  morphological, ecological and oceanographic re-
veloped countries use computer simulations to solve
                                                                  gion. Historically, since 1933 the Estuary Coco con-
their local problems of flooding. The practice involves
                                                                  centrated low-income housing, and currently has a
building models of drainage systems using applica-
                                                                  number of environmental and social problems arising
tions such as MOUSE (Abbott et al., 1982, Lindberg
                                                                  from lack of urban planning, mainly due to population
& Jørgensen, 1986), SOBEK-Urban (Heeringen et
                                                                  growth and inadequate implementation of structural
al., 2002), InfoWorks CS (Chan & Vass, 2002) and
                                                                  designs, such as sanitation basic fluvial drainage
SWMM (Huber & Dickinson, 1992). Based on simu-
                                                                  works, construction of affordable housing and other
lation results, mitigation measures can be evaluated
                                                                  forms of occupation (RGP, 2009).
and the optimal solution can be implemented. The
main caveat with regard to commercial software pack-

                                             Aqua-LAC - Vol. 4 - Nº.2 - Set. 2012                                      19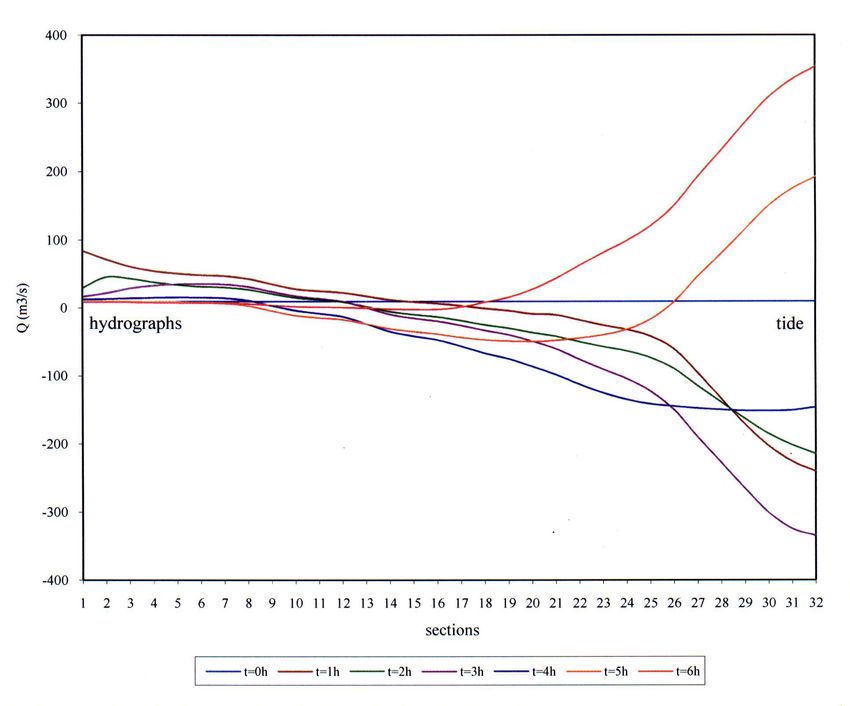
S. de Sousa Venâncio and L.F. Resende dos Santos Anjo

                                Figure 1. Location of the study area in Fortaleza/CE.

Even being inserted in the semi-arid climate, its loca-         where ∂y/∂t is the rate of temporal variation of water
tion change this reality by being among nearby hills            height considering the bottom of the channel; ∂Q/∂x
causing summer rains occur more often in the city               rate of spatial variation of flow, B the width of the free
and surrounding area than in the rest of the state.             surface, and qLAT the intake of side flow in meters
The average annual temperature is 26° C. The aver-              from the banks. From the relation ∂y/∂t = ∂h/∂t - ∂z/∂t,
age rainfall is about 1600 mm. Without the seasons              where ∂h/∂t is the variation of water height relative to
well defined, there is only the rainy season, from Jan-         a horizontal reference plane at the considered time
uary to July and the dry from August to December.               and ∂z/∂t = 0 (once the bottom slope does not vary
With most of the sandy soil agriculture becomes of              with time), the general equation can be rewritten as:
little economic significance, and since the 1990 the
entire length of the city was considered urban area
(WIKIPEDIA, 2013).
                                                                          					(2)
The average flow in the estuary, in steady state, is 10
m3/s, obtained by measuring station river. The moni-
toring of historical rainfall data and qualitative and
quantitative water resources of the Basin estuarine             The equation of movement amount is given as fol-
Coco are managed by the COGERH (Company Wa-                     lows:
ter Resources Management) from the state govern-
ment of Ceará.

                                                                						(3)
2.2 Numerical Model
The mathematical model conceptual employed to
                                                                where Sf is the slope of the power line; S0 to the chan-
study the free flow in the transient regime with bidi-
                                                                nel bottom slope; ∂y/∂x the rate of spatial variation of
rectional flow, is set out in the literature, for validations
                                                                water depth; ∂V/∂x rate of spatial variation of mean
generated in various applications. It is composed of
                                                                flow velocity; ∂V/∂t the rate of temporal variation of
the hydrodynamic equations completes, Continuity
                                                                mean velocity and g is the acceleration of gravity.
and amount movement, known as the Saint-Venant
                                                                Substituting S0 by ± ∂z/∂x and Sf by V2/CH2.RH = Q2/
equations.
                                                                A2.CH2.RH in Eq. (3), it can be written as:

2.2.1 Governing Equations
The continuity equation follows the way presented by            						 (4)
Henderson (1966):
                                                                where A is the cross-sectional area, and RH is the
          					(1)                                              hydraulic radius of the section, and CH the Chezzy
                                                                coefficient, a function of hydraulic radius and Man-
                                                                ning roughness coefficient (CH=RH1/6/n) determined

20                                          Aqua-LAC - Vol. 4 - Nº.2 - Set. 2012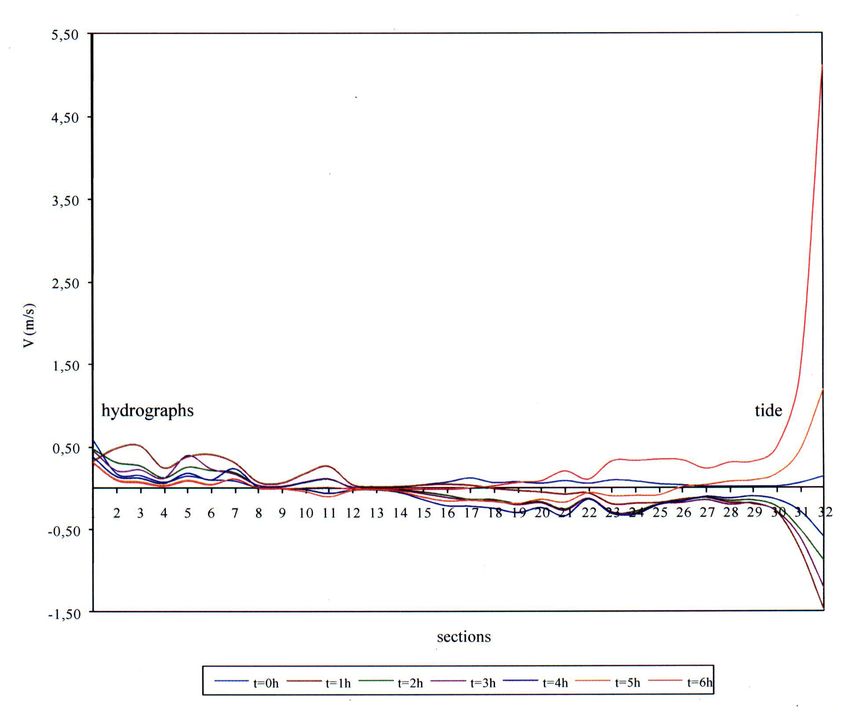
Comptational Model for Analysis Spread in Flood Channels Urban Drainage

for each step of time of the established discretization.
Introducing the relation ± ∂z/∂t = ∂h/∂x - ∂y/∂x in Eq.                    					(8)
(4) and multiplying it by g.A2, it becomes:

�Q     �Q    g                            2   �h
   A+Q    + 2     QQ +g
                      A                          =0               which is multiplied by 2Δt and it is
�t     �x C H R H                             �x         (5)

                                                                  						 (9)

2.2.2 Discretization

                                                                  Defining     as a and rearranging Eq. (9) in terms
One of the most used schemes for the variable flow                of K and K +1, you can write it as
analysis in channels is the implicit finite difference
scheme by Preissmann (apud LIGGET and CUNGE
1975), given by:                                                  			                                                 (10)

						 (6)                                                        					                                               (11)

q and f are weighting factors which, for f = 0,5 e q =            Therefore
1 a fully implicit scheme considered by Preissmann is
presented as follows:

                                                                  (for side flow input), and

                                                                  (for side flow output), reminding that if there is no en-
                                                                  try and exit of side flow, the term EJ becomes
           �f f iK+1+1 � f iK +1                                  the discrete equation of continuity is the following
              =
and        �x         �x              		                 (7)
                                                                  					                                               (12)
where the average of the variable f is calculated by
                                                                  Applying the approximation scheme for the move-
                 , which i would represent the sections,          ment amount equation Eq. (5) and following the
                                                                  same steps taken earlier, it is
k the calculation time and f the representative value
of any variable of the problem where, for the present-
ed case is given by Q (m3 / s) and h (m) .

Discretizing the continuity equation Eq. (2) for this
scheme, it follows

                                                                  					                                              (13)

                                                                  with and .

                                              Aqua-LAC - Vol. 4 - Nº.2 - Set. 2012                                      21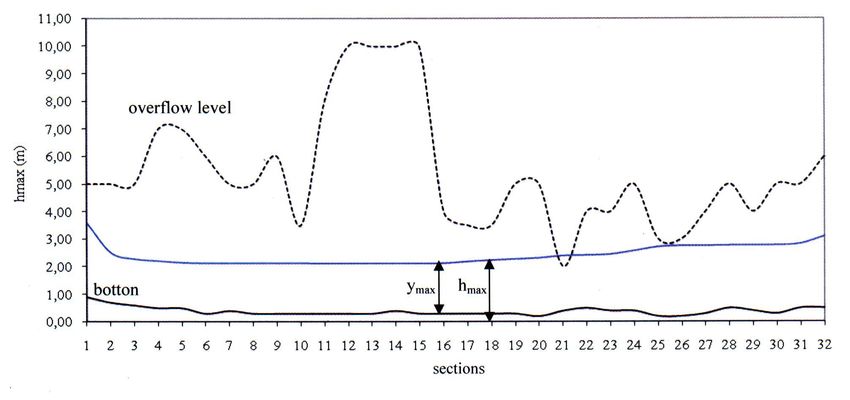
S. de Sousa Venâncio and L.F. Resende dos Santos Anjo

Reducing the terms of the equation for

the equation of movement is treated as

					                                                   (14)

3. APLICATION
The studied estuary was spatially discretized into 32          input hydrograph and downstream tide equation. Two
sections (NZ = 32 sections), listed from upstream to           side hydrographs are still considered. The outline of
downstream, with a total length L = 15.500m. The               the problem is shown in Figure 1 below.
boundary conditions of the problem are the upstream

     Figure 2 - The Cocó River estuary Scheme to the application of the model, with HID21 and HID30 repre-
                                        senting the two side hydrographs.

For the discretized mathematical equations above,              where the overwritten index of Q and h represent the
the following linear system occurs:                            time of calculation, and the subscribed index repre-
                                                               sent the considered sections. The values A, B, C, D
                                                               and E are determined by expressions previously de-
                                                               veloped in an explicit way. Thus we can conclude that
                                                               for NZ = n sections, the system consisted of 2.(n-1) =
                                                               equations and 2.n= unknowns what in this case rep-
                                                               resents a number of 62 equations and 64 unknowns.
                                                               Introducing the boundary system, this becomes:

					                                                   (15)

22                                         Aqua-LAC - Vol. 4 - Nº.2 - Set. 2012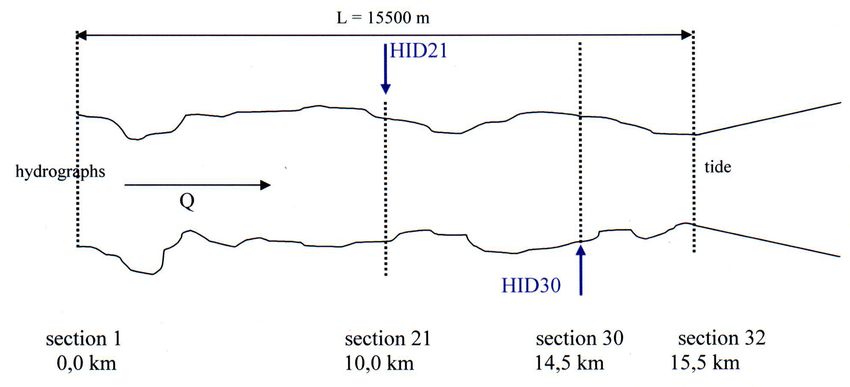
Comptational Model for Analysis Spread in Flood Channels Urban Drainage

                                                                  acceleration of gravity; z = 500 m = spacing between
                                                                  sections; Dt = 3600 s = time interval of calculation;
                                                                  Nt = 6 = number of time intervals for calculating; qLAT
                                                                  = 0.0001 m3/sm = lateral contribution; n = 0.035 =
                                                                  Manning coefficient; Nz = 32 = number of discrete
                                                                  sections; HID21 = side hydrograph in section 21;
                                                                  HID30 = side hydrograph in section 30; ALT = initial
                                                                  height of water, obtained by the energy equation via
                                                                  Step Method; QUOTA = bottom of the channel quota
                                                                  obtained topographically.
                                                                  The system of equations is then prepared in a matrix,
                                                                  according to Fortuna (2000), expressed as in Figure
					                                                   (16)      3, to be solved numerically. The Matrix A and vector
                                                                  B are explicitly calculated in time K and the vector U
                                                                  obtained implicitly by solving the system at time K+1.

and therefore a system with 64 equations and 64
unknowns. F1 = h1 is obtained by downstream tide
equation as follows:                                              3.1 Computational Model
                                                                  With the aim of implementing the simulation of tran-
                                                                  sient flow in open channels, with discretization of
					                                                   (17)      the Saint-Venant 1D equations through the scheme
                                                                  implicit by Preissmann, a computer model in FOR-
                                                                  TRAN language was developed. The model applied
Where:                                                            in this study can be extended to other cases making
yinic = 1.00 m = initial height of the tide in section            adjustments in geometry, boundary conditions, tem-
1 (when.t = 0h); A = 1.60 m = height of the tide;                 poral and spatial discretization. In cases of natural
P = 3.141592654; T = 12 H = period of the tide; z1                channels, the approach must be careful, because the
= share of the channel bottom in section 1; t = time              geometry of the sections is approximated by math-
of computation in hours; F32 = Q32, is the upstream               ematical functions that may exhibit divergence in the
boundary condition attributed directly to the charac-             limits of maximum and minimum water depth. The
teristic hydrograph of the estuary.                               block diagram of the model is shown in figure 4.
To solve the system, are given further: Qi = 10.00
m3 / s = initial flow in the channel; g = 9.81 m/s2 =

                          Figure 3 – Matrix of the equations used for the numeric solution.

                                             Aqua-LAC - Vol. 4 - Nº.2 - Set. 2012                                     23
S. de Sousa Venâncio and L.F. Resende dos Santos Anjo
Figure 4 – Block Diagram of the Model.
4. RESULTS Hydraulic changes occurring in the estuary, during
periods of high and low tide, are equivalent to the re-
The height of water data, flow and speed in func-
sults of work carried out for the same purpose (varia-
tion of time are summarized in Figures 5, 6 and 7
tion of water levels in the estuary), where the main
for the discretized sections of the estuary. The
bottleneck is the unavailability of field data to feed
initial time t = 0 h was considered when the estu-
calibration of the model. As an example of equiva-
ary is at steady state. The time steps are in a pe-
lent studies can be cited: Como exemplo de estudos
riod of 1min in a simulated total period of 6 hours.
equivalentes pode ser citado: Pinho (2005); Stoschek
Figure 5 shows the evolution of water height with time
e Zimmermann (2006); Kwnow, Maa e Lee (2007);
along the estuary, with a predominance of the tide on
Ganju e Schoellhamer (2009) and Hu et al. (2009).
the amount of flow between sections 16 and 32. The
maximum height occurs within the first 2 hours for the
sections between 1 and 5 due to the influence of the 6. CONCLUSIONS
hydrograph peak. For other sections the maximum is
This computer model simulation performed for the
reached in the third hour, depending on the maximum
conditions of the drainage channel, estuarine stretch
height of the tide. The overflow observed in section
of the River Coco within a period of 6 hours, with the
21 is an important detail of the simulation, because it
determination of maximum levels in the estuary. These
corresponds to a characteristic point of flooding.
levels served as parameters for interventions in the
Figure 6 shows the propagation of the downstream areas adjacent to the estuary for urbanization pur-
flow (characterized by the rising tide into the estuary) poses. Therefore, the main objective was achieved.
the time of 3h, when its height is maximum . After
a period of three hours the tide begins to go down,
For the application of the computational model pre-
freeing the flow of the accumulated amount flow in
sented in this study in other cases, even with no
the period. The flow then tends to steady state, with
estuary, there must be an adaptation to the specific
positive values along the estuary, i.e., with the pre-
geometric and hydraulic situation addressed, as well
dominance of the amount flow.
as boundary conditions of the particular problem.
The graph in Figure 7 shows the peak level reached It is also important to note that the computational
in the various sections of the estuary in the simulated model implemented here was motivated by the need
period, expressing clearly the sector where flooding to serve a practical purpose and, therefore, it is lim-
occurs (section 21). ited to only simulate the occurrence of peak levels.
24 Aqua-LAC - Vol. 4 - Nº.2 - Set. 2012Comptational Model for Analysis Spread in Flood Channels Urban Drainage
Figura 5 - Evolution of water height in time.
Figura 6 - Evolution of the flow in time.
Aqua-LAC - Vol. 4 - Nº.2 - Set. 2012 25S. de Sousa Venâncio and L.F. Resende dos Santos Anjo
Figura 7 - Maximum level of water in the estuary.
This limitation is imposed by the tidal equation which actions from the quantification of transient phenom-
does not reproduce the minimum heights. enon in the drainage channels.
Despite the actual phenomenon is reproduced in Finally, the availability of data for field calibra-
the same order of magnitude (of space and time) the tion and validation extensive computational time
validation of this simulation is subject to making mea- for the adjustment and sensitivity analysis of the
surements of water height in the channel during the data and also the limitations of templates to cover
rise of the tide. These field data, not available to carry certain data types, or to consider them as appro-
out this simulation, would allow the calibration of the priate, make process of numerical simulation re-
model and check its efficiency. sults that hard to not always represent accuracy.
In the case of natural channels (not prismatic sec-
tions), it is worth noting that care must be taken as 6. REFERENCES.
the geometric aspect. As the geometric configura-
tion of the sections are approximated by mathemati-
cal functions (A = f (y)) and P = f (y)), the correlation ABBOTT, M.B.; HAVNO, K.; HOFF-CLAUSSEN,
obtained should be analyzed carefully for the maxi- N.E.; KEJ. A., A modeling system for the design and
mum and minimum heights reached in the simula- operation of storm sewer networks. Engineering Apli-
tion of water, avoiding to numerical instabilities. cations of computacional hydraulics. Editors: AB-
The next step of this work is the validation with the BOTT, M.B.; CUNGE, J.A. Pitman. v.1, ch.2, 1982,
consequent inclusion of sediment transport module. p.11-39. London
The major deadlock in this type of modeling, based CHAN, A.; VASS, A., Modeling a Pressurized Waste-
on previous work is the unavailability of field data, no water System, a Case Study. Ninth International
contemplation of important parameters for numerical Conference on Urban Storm Drainage (ICUD), 2002.
models (winds, turbulence, temperature, etc.) and CD-ROM. Portland.
empirical mathematical modeling with results showing
significant errors. Not less important is the necessary CRUZ, M. A. S. e TUCCI, C. E. M., Avaliação dos
qualification for the collection and interpretation of Cenários de Planejamento na Drenagem Urbana,
data and appropriate use of model for each situation. Revisa Brasileira de Recursos Hídricos – RBRH, v.3
All this reality justifies the continuation of studies in n.3, set-2008, p.59-71.
this direction, pointing to computational programs GANJU, N. K.; SCHOELLHAMER, D. H. Calibration
with open source codes, which facilitate the inter- of an estuarine sediment transport model to sediment
pretation of errors in the results and relevant adjust- fluxes as an intermediate step for simulation of geo-
ments, which do not happen with commercial soft- morphic evolution. Continental Shelf Research 29,
ware because of the so-called “black boxes”. Without 2009. p.148-158.
intending to model the nature accurately, the com-
putational tool provides more efficient and integrated HEERINGEN, K.; VERWEY, A.; MELGER, E. Dutch
Approach to High Speed Urban Drainage Modeling
with SOBEK.,2002. In.: Ninth International Confer-
26 Aqua-LAC - Vol. 4 - Nº.2 - Set. 2012Comptational Model for Analysis Spread in Flood Channels Urban Drainage
ence on Urban Storm Drainage (ICUD). CD-ROM. PINHO, J.L.S., Modelação da hidrodinâmica e
Portland. dinâmica sedimentar no estuário do rio Cávado. Re-
vista da Universidade do Minho, Portugal – Dep. En-
HENDERSON, F. M., Open Channel Flow, Macmillan
genharia Civil - ISSN 0873-1152. 24 (2005) 5-16.
Publishing, Inc, New York, 1966, 522p.
RGP – Revista Geografia e Pesquisa, Carttografia
HU, K.; DING, P.; WANG, Z.; YANG, S. A 2D/3D hy-
Aplicada à Análise Geoambiental: Um Estudo de
drodynamic and sediment transport model for the
Caso com Fotografias Aéreas de Pequeno Formato
Yangtze Estuary, China. Journal of Marine Systems,
no Lagamar do Rio Cocó – Fortaleza – Ceará, UN-
2009. 23p.
ESP/Ourinhos, v.3, n.1, jan-jun (2008), ISSN 1982-
HUBER, W.C.; DICKINSON, R.E., Storm Water Man- 9760.
agement Model, version 4: user’s manual. EPA/600/3-
SEMACE – Secretaria do Meio Ambiente do Estado
88/001a (NTIS PB88-236641/AS), 1992, U.S. Envi-
do Ceará. Parque Ecológico do Rio Cocó. Disponível
ronmental Protection Agency. Athens, Georgia.
em: . Acesso em: 12 out. 2012.
implication of the constant erosion rate model to sim-
STOSCHEK, O.; ZIMMERMANN, C. Water Exchange
ulate turbidity maximums in the York River, Virginia,
and sedimentation in na estuarine tidal harbor using
USA. Estuarine and Coastal Fine Sediments Dynam-
three-dimensional simulation. Journal of Waterway,
ics, 2007. p.331-354.
Port, Coastal, and Ocean Engineering, ASCE, 2006.
LIGGETT, J.A. e CUNGE, J.A., Unsteady Flow in p.410-414.
Open Channels – Cap 4 – Volume I – editado por
WIKIPÉDIA – Disponível em:< http://pt.wikipedia.
K.Mahmood e V.Yevjevich, 1975, 484p.
org/wiki/Geografia_de_Fortaleza>. Acesso em: 17
LINDBERG, S.; JØRGENSEN, T.W., Modelling of Ur- jul. 2013.
ban Storm Sewer Systems. In: Proceedings of the
VENANCIO, S. S., Simulação Numérica Aplicada ao
International Symposium on Comparison of Urban
Assoreamento do Reservatório Represa Velha, tese
Drainage Models with Real Catchment Data. UDM
doutorado EESC/USP, 2009, 168p.
’86. Dubrovnik, 1986, Yugoslavia.
VENANCIO, S. S.; SOUSA, L. B. S. de; VILLELA, S.
MARK, O.; WEESAKUL, S.; APIRUMANEKUL, C.;
M., Modelo Computacional para Análise de Transien-
BOONYAAROONNET, S.; DJORDJEVIC, S., Poten-
te Hidráulico em Canais – o caso do estuário do Rio
tial and limitations of 1D modelling of urban flooding.
Cocó. XVI Simpósio Brasileiro de Recursos Hídricos
Journal of Hydrology. Volume 299, Issues 3-4, De-
– SBRH, Nov/2005 – João Pessoa-PB- pg. 1-11.
cember 2004, Pages 284-299.
Aqua-LAC - Vol. 4 - Nº.2 - Set. 2012 27You can also read