Building A Better Electric Utility: An Asset Management Plan for Saskatoon Light & Power
←
→
Page content transcription
If your browser does not render page correctly, please read the page content below

APPENDIX 1

Building A Better Electric Utility:
 An Asset Management Plan
 for Saskatoon Light & Power

                                       MARCH 2018
Saskatoon Light & Power

INTRODUCTION
In 2011, it was identified that a strategic change would need to be made to address Saskatoon
Light & Power’s (SL&P) aging infrastructure.

A consulting firm was hired and they produced a report in June 2012 providing an
independent Capital Development Planning Study. The purpose of the report was to
identify the long-term capital funding requirements necessary to achieve or exceed industry
reliability standards while maximizing the return on these investments.

The consultant reported that SL&P would need to respond to concerns about their aging
infrastructure and the demands being placed on that infrastructure from growth by
significantly increasing their capital spending from previous levels.

SL&P has been able to increase its capital investment by $5.3 million over a six-year period
(2013-2018) increasing the capital contribution from $10.8 million to $16.1 million. Although
SL&P has made some progress, more attention is required in order to maintain SL&P’s assets
at an acceptable level now and into the future.

It is important to note that the consultant also observed that SL&P has been able to either
meet or exceed reliability statistics in relation to comparable utilities across Canada, as
shown in Table 1 below. The need to adjust capital provision funding levels is therefore
aimed at maintaining the performance of the utility into the future.
Table 1 – SL&P Index of Reliability

                                               Index of Reliability
1.0000

0.9998

0.9996

0.9994

0.9992

0.9990
              2007       2008         2009     2010   2011    2012    2013      2014   2015   2016

                                             SL&P      Canadian Urban Average

2       City of Saskatoon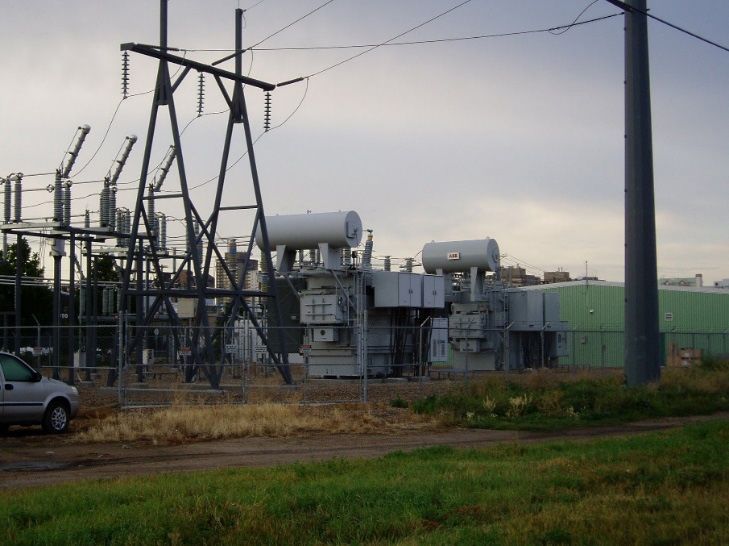
Saskatoon Light & Power

CURRENT INVENTORY
The current inventory of SL&P assets is valued at over $702 million as detailed in Table 2 below:
Table 2 – SL&P Inventory Summary (in Millions of $)

 Asset Class                                                            Replacement Cost          % of Asset

 Transmission                                                                      $19.20               3%

 Substation                                                                       $202.40               29%

 Overhead/Underground Distribution                                                $261.00               37%

 Downtown Network System                                                           $69.00               10%

 Street Light System                                                              $127.80               18%

 Generation                                                                        $12.50               2%

 Metering                                                                          $10.90               1%

 Total                                                                           $702.80

Transmission – Transmission assets include lines and equipment that deliver bulk power
from SaskPower supply points to SL&P lines and substations.

Transmission Tower (Lattice Structure)     138 kV Transmission Entering Bulk Power Substation

Substations – The utility is served by 21 substations located in various areas of the city.
Inside each substation are a number of transformers. These transformers are key assets
owned by the utility.

                                                                              SASKATOON LIGHT & POWER     3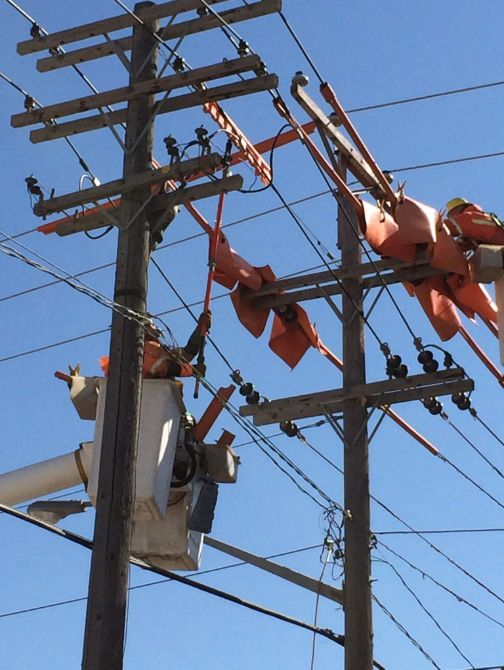
Saskatoon Light & Power
Overhead Distribution – Approximately 60% of the utility’s distribution system consists of
overhead lines (400 km) with the rest being buried underground.
The majority of the overhead system is supported using wooden poles, with the balance of
the poles being made of steel.
Underground Distribution – The underground distribution system consists of 265 km of
cable which was largely installed in the 1960’s and 1970’s.
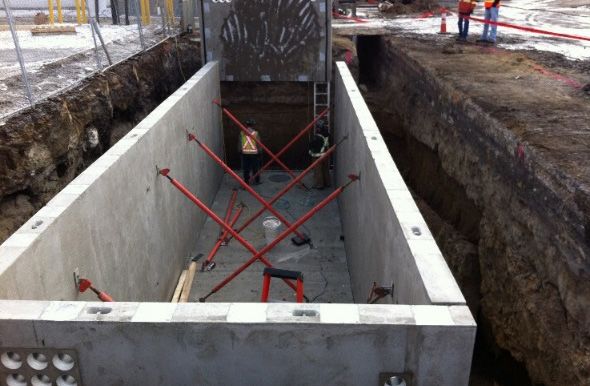
Downtown Network System – SL&P operates a distribution network in the downtown area
consisting of underground concrete vaults and duct banks. These vaults are large “rooms”
built under the sidewalk to house transformers and place these systems underground and
out-of-sight. There are 20 vaults and 50 transformers in the system.
Crews working on Overhead Distribution
Network Vault under Construction – Floor and Walls
Street Light System – SL&P operates 79.5% of the city’s street light network (approximately
25,000 fixtures) with SaskPower operating the balance.
PHYSICAL CONDITION OF ASSETS
The condition of assets and how they are assessed varies with construction materials,
components, operational environment, and specific external inputs. In general, components
degrade with age and time in service. More demanding environments and overload events
shorten the expected life of equipment. Ongoing maintenance can extend the life of the
asset but is not always cost effective. The majority of the electrical assets need to be capable
of surviving overload conditions and have excess capacity for contingency situations. The
system as a whole is designed to take advantage of this capacity and so demands a high
degree of confidence in the performance and condition of most assets. Also given the
nature of electricity, consequences from asset failures can vary widely, from little to no effect
to widely catastrophic. Table 3 as follows, provides a summary of general condition ratings
and descriptions which have been applied to each asset category.
4 City of Saskatoon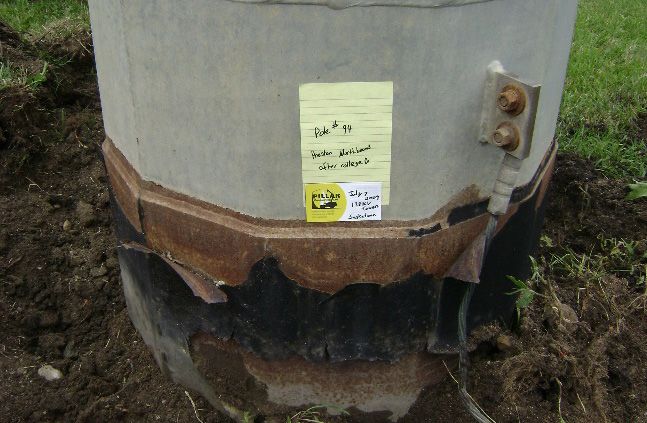
Saskatoon Light & Power
Table 3 – SL&P Structural Condition Rating Summary

 Physical Condition                   Description & Action

 Very Good                            Like new condition.

 Good                                 Minor deficiencies noted, monitoring and minor maintenance required.
                                      Signs of deterioration are evident. Some potential for failure, monitoring and planning for
 Fair
                                      rehabilitation required.
 Poor                                 Advanced deterioration and high potential for failure evident. Rehabilitation required.

 Very Poor                            Structure no longer capable of providing required reliability standards.

Below are examples of assets in various states of condition:

Transmission Tower Base in Good Condition                           Transmission Tower Base in Poor Condition

Transmission tower structures have a special protective coating to inhibit rust. Damage or
degradation of this coating allows rust to form, thus weakening the structure.

Substation Transformer Oil Leak (1st Ave)      Substation Transformer Oil Leak (College Park)

The mineral oil contained in a substation transformer is essential for electrical insulation
and cooling. Over time leaks can develop into dangerously low oil levels, cause issues with
auxiliary equipment, and be harmful to the environment.

                                                                                    SASKATOON LIGHT & POWER                     5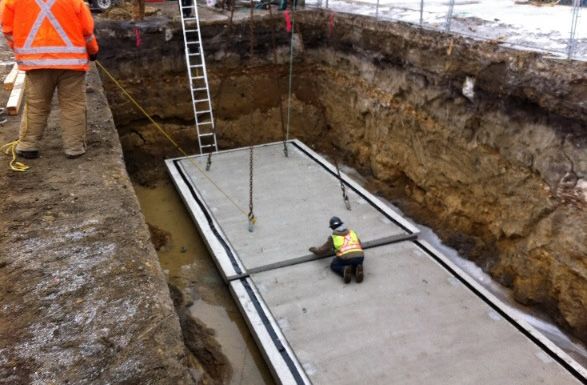
Saskatoon Light & Power

Dirt and Contamination Inside Switchgear        Switchgear Failure from Contamination

The build-up of dust, dirt, and other contaminants inside switchgear can compromise the
integrity of insulating components, which can result in catastrophic failures.

Network Vault Roof in Good Condition            Network Vault Roof in Poor Condition

The roof structures in the downtown network vaults have removable sidewalk panels to
permit installation and removal of large equipment. The steel components can rust over
time, making removal of the panels difficult. If there is significant rust build-up, the concrete
sidewalk panels can crack or break, collapsing on the equipment below.

Network Vault Grate in Good Condition           Network Vault Grate in Poor Condition

The downtown network vaults also have steel grates used for access to the vault and to
provide cooling/venting for the equipment below. Over time these grates can rust, warp,
and plug with debris. This can make access difficult, compromise the venting systems, and
create tripping hazards on the sidewalk.

6       City of Saskatoon
Saskatoon Light & Power

New Overhead Distribution Transformer                         Leaking Overhead Distribution Transformer

Similar to substation power transformers, oil-filled distribution transformers can develop
leaks with similar impacts on operation and the environment. While the units themselves
are much smaller with fewer affected customers, there are more than 4,000 in service.

Wood Distribution Pole - New            Wood Distribution Pole - Good Condition       Wood Distribution Pole - Poor Condition

With approximately 13,000 wood distribution poles in service, condition varies widely. Poles
can rot, crack, and weaken over time, and the degradation may not be visible (below the
ground line or internal to the pole). Poles in poor condition are unsafe for workers to climb,
and are more prone to failure from stresses due to wind or equipment loads and tensions.

Street Light Pole in Good Condition                           Street Light Pole in Poor Condition

Street light poles are prone to rusting, but the condition is not always readily visible since
the rust may start from the inside of the pole. Rusting may also occur behind decorative
bases, inside shrouds or beneath mounting plates.

                                                                              SASKATOON LIGHT & POWER                           7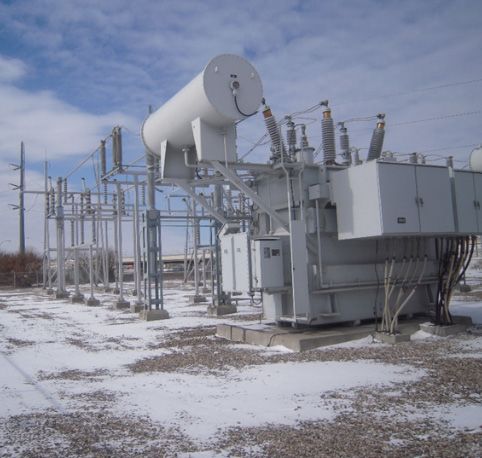
Saskatoon Light & Power

EXPENDITURE LEVELS
The Administration evaluates the condition of the City’s assets in order to develop annual
programs that will maintain the assets at the desired target condition for the least cost.
Condition assessments are conducted to develop annual capital improvement plans.

The level of service for each type of asset is defined; however, as the level of service increases
for the asset, so does the maintenance cost. In order to be able to compare the level of
investment for all assets corporate-wide, five levels of expenditures are identified below. It
should be noted that expenditure levels are not condition assessments, but lead to a change
in the asset condition over time. “A” represents the highest level of expenditure and “F”
represents no expenditure.
Table 4: Expenditure Levels

 Expenditure Level            Asset Condition                        Description

                                                                     Sufficient expenditures to keep assets in the desired
 A                            Getting Better Quickly                 condition and to increase asset condition/value quickly
                                                                     over time.
                                                                     Sufficient expenditures to keep assets in the desired
 B                            Getting Better                         condition and to increase asset condition/value slowly
                                                                     over time.
                                                                     Sufficient expenditures to keep asset in constant
 C                            Maintain Assets in current condition
                                                                     condition over time.
                                                                     Insufficient expenditures to maintain asset condition.
 D                            Getting Worse
                                                                     Over time asset condition will deteriorate.
 F                            Getting Worse Quickly                  No expenditures. Asset condition/value decreased rapidly.

There are two questions that should be asked prior to proceeding with an asset
management plan:

1. What is the desired asset condition level?

2. How quickly would City Council like to reach their desired asset condition level, and
corresponding expenditure level?

Table 5 aligns the desired condition and expenditure level. The table also shows the required
funding to meet a level “B” expenditure level and associated funding gap.

8       City of Saskatoon
Saskatoon Light & Power
Table 5: Funding Gap 2018 (in Millions of $)
                             Physical Condition    Physical Condition   Desired Expenditure   Required Average
 Asset
                                  Actual               Desired                 Level           10-Year Funding
                                0% Very Good         61% Very Good
                                 100% Good             39% Good
 Transmission                      0% Fair              0% Fair               Level B                    2.19
                                  0% Poor               0% Poor
                                0% Very Poor          0% Very Poor
                                0% Very Good         0% Very Good
                                 72% Good             100% Good
 Substations                      28% Fair              0% Fair               Level B                      5.5
                                  0% Poor               0% Poor
                                0% Very Poor          0% Very Poor
                                0% Very Good         30% Very Good
                                 30% Good              70% Good
 Downtown Network                 64% Fair              0% Fair               Level B                    2.17
                                  6% Poor               0% Poor
                                0% Very Poor          0% Very Poor
                                0% Very Good        100% Very Good
                                 90% Good              0% Good
 Distribution                      0% Fair              0% Fair               Level B                    6.47
                                  10% Poor              0% Poor
                                0% Very Poor          0% Very Poor
                               80% Very Good        100% Very Good
                                 10% Good              0% Good
 Metering                          0% Fair              0% Fair               Level B                    0.59
                                  10% Poor              0% Poor
                                0% Very Poor          0% Very Poor
                               10% Very Good         0% Very Good
                                 47% Good              78% Good
 Lighting                         37% Fair              22% Fair              Level B                    3.15
                                  5% Poor               0% Poor
                                1% Very Poor          0% Very Poor
                               16% Very Good         0% Very Good
                                 84% Good             100% Good
 Generation                        0% Fair              0% Fair               Level B                      0.3
                                  0% Poor               0% Poor
                                0% Very Poor          0% Very Poor
 Other Projects                     N/A                   N/A                                            4.06
 Total Funding
                                                                                                        24.43
 Required
 Less: External Funding                                                                                  1.33
 Sub Total                                                                                               23.1
 2018 Capital
                                                                                                         16.1
 Contribution
 Funding Gap                                                                                              7.0

                                                                        SASKATOON LIGHT & POWER             9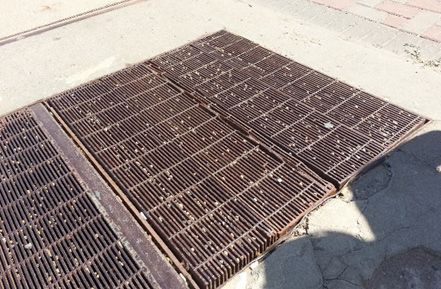
Saskatoon Light & Power
As outlined in this report, expenditure levels are below the desired levels, and this has led
to a general decline in the overall condition of our assets. This needs to be addressed. As
shown in Table 5 (page 9), the current funding for capital contribution is $7.0 million below
the required annual funding based on the average 10-year capital plan to meet desired
condition levels.

PRESERVATION PROGRAMS
When SL&P develops its capital budget each year, it takes into account the performance of
the electrical grid over the past year and targets spending to prevent future power outages.

The four primary causes of power outages in 2016 were:
1. Trees contacting overhead power lines (25%);
2. Defective equipment (23%);
3. Scheduled outages for maintenance work (22%);
4. Interference by a third party such as damage from a vehicle collision, bird contacts with
   overhead power lines, contractor dig-ins with underground cables, etc. (15%).

                                    Causes of Outages
                                            Human
                             Unknown        Element     Adverse
                               5%            2%       Environment
                       Lightning                         1%
                         2%
                   Adverse
                   Weather
                                                      Scheduled
                    5%                                 22%
                               Foreign
                             Interference
                               15%
                                                      Tree Contacts
                                     Defective           25%
                                    Equipment
                                       23%

A study was conducted in 2012 to review SL&P preventative maintenance (PM) practices
for energy delivery equipment. The type, frequency and level of PM can have a significant
impact on capital spending. For example, if PM declines over time, equipment deterioration
and failures can accelerate. Enhanced maintenance is often a cost-effective alternative to
capital replacements. Moreover, certain PM extends the life of critical assets.

Transmission
Most of SL&P’s transmission lines are steel poles requiring little maintenance. The majority
of these lines are located in areas where minimal tree trimming is needed; however, some
lines are susceptible to damage from particularly large trees located outside of the right-

10   City of Saskatoon
Saskatoon Light & Power
of-way. Tree trimming of both public and private trees is necessary, but even with adequate
trimming there are still chances for uprooted trees or large branches to fall onto the lines
and create power outages.
In 2005, SL&P performed a comprehensive electrical inspection of its entire transmission
system. The inspection and analysis identified the susceptibility of certain equipment,
particularly insulators, to corona-related deterioration. Three categories of deterioration
were identified, and corona rings were installed on line insulators within the areas with
the most severe readings. SL&P has performed two subsequent inspections and lines with
moderate readings have been addressed to avoid insulator failure.
Substations
SL&P performs a monthly inspection of every substation, which includes the recording
of equipment operations, observable problems, and any items requiring immediate
resolution. Annual oil samples are taken from each power transformer and analyzed for
indication of any internal degradation. SL&P also recently completed the final year of a
three-year electrical testing program for all substation transformers. These tests indicate
any immediate condition issues and establish a baseline for the future testing program.
Some transformers also have some monitoring equipment that provide continuous online
feedback on various parameters of operation.
Substation equipment typically requires periodic maintenance, particularly those with
moving parts or large and expensive equipment where a loss of the device would result in
major outages (such as transformers).
Substation Transformer Substation Switchgear Substation Control Cabinet
OVERHEAD LINE MAINTENANCE
Reliability statistics indicate that tree-related outages are one of the leading causes of power
outages. This is a common concern for urban electrical utilities.
SL&P undertakes a significant annual tree trimming program. The utility works with the
Parks division to trim City-owned trees interfering with street lights and power lines in front
of properties. The utility also patrols rear lanes and trims trees away from the lines.
Work is also done regularly on overhead lines to upgrade feeders to meet increased demand.
Infill development increases urban density and drives the need for additional electrical
capacity. Whenever possible, these projects are scheduled to replace older lines that are
weathered and needing to be replaced.
SASKATOON LIGHT & POWER 11Saskatoon Light & Power Wood Poles There are a variety of ways in which poles are identified for replacement. Through large-scale voltage conversion projects or opportunities involving other companies requiring access to a pole, the pole may be replaced. Also when other types of work are being performed, a pole or series of poles may be identified for replacement. The long-term plan is to identify poles in critical locations and perform systematic inspections for these poles. A system-wide inspection may be performed once an asset management system is implemented. Street Lights SL&P does not have a complete database of street light pole condition, but has established an inspection program. About 1,400 poles are inspected annually, with areas of high traffic (pedestrian and vehicle) being targeted first. Issues with street lights are generally easier to detect, as corroded poles, deteriorated bases, and broken fixtures are more observable and do not require extensive tests. Street light maintenance mostly includes the replacement of bulbs or broken fixtures. Cables and Padmount Equipment (Radial) SL&P inspects padmount equipment annually for external wear, base deterioration, or obvious damage. SL&P has identified padmount transformers using live-front termination, proposing to replace these devices with dead-front terminations. Some cables have been injected with silicon to extend their service lives. Cable testing is very labour intensive and requires power interruptions (offline tests) in order to be effective. New methods are being developed that may allow for reliable testing of cable with less effort and no power interruption. Secondary Networks SL&P has established an annual inspection program that started with an extensive assessment of existing assets. Additionally, control devices are being upgraded to include on-line monitoring capability. Network transformers have also been added to the annual oil inspection program. SL&P has also installed primary protective devices that minimize the impact of faults, as these will be cleared rapidly. POTENTIAL PLAN TO ADDRESS THE FUNDING GAP There is currently a $7.0 million annual funding gap between the contribution to the capital reserves and the amount necessary to achieve the desired physical condition. In 2018, SL&P plans to contribute $16.1 million to capital reserves which in time will need to increase to $23.1 million (in 2018 dollars) as outlined in Table 5. Due to the size of the gap, it is recognized that any potential plan to address this situation will need to be developed over a number of years. The goal would be to maintain a healthy Return on Investment (ROI) for the City while increasing investments into the capital reserve as electricity rates increase over time. SaskPower sets electricity rates on a periodic basis. It has been the practice of SL&P to match those increases to provide rate consistency for all customers within the city’s boundaries. Therefore, it is not practical to set higher or lower electricity rates than SaskPower’s in order to adjust the amount of funding SL&P can provide to capital reserves. 12 City of Saskatoon
Saskatoon Light & Power
A rate model has been developed to project the impact that various factors would have on
both the ROI and capital provisions over time.

Key assumptions include:
• Electricity rates will increase 5% annually from 2018 to 2020 and then 3% thereafter;
• Bulk power charges from SaskPower will increase at the same rate;
• The target capital provision of $23.1 million (in 2018 dollars) will increase at a rate of
  2% annually;
• ROI will remain constant until capital provisions meet the desired funding level and will
  then increase; and
• Grant-in-Lieu (GIL) will continue to grow annually based on rate increases.

The model shows that capital provisions will achieve the target goal by 2023 (six years).
ROI will remain at the current level of $24.66 million from 2018 to 2022. Beginning in 2023,
ROI will continue to grow. A new Capital Development Planning Study will be required at
that time to project future capital spending requirements and an updated rate model will
be developed to guide future ROI increases.

The following chart shows the total financial benefit achieved over the past 20 years and the
resulting benefit over the next 10 years based on the potential plan for 2018 to 2027.

                     Return on Investment & Capital Provision
                      (20 Year History Plus 10 Year Projection)
35,000,000

30,000,000

25,000,000

20,000,000

15,000,000

10,000,000

 5,000,000

         0
             1998
             1999
             2000
             2001
             2002
             2003
             2004
             2005
             2006
             2007
             2008
             2009
             2010
             2011
             2012
             2013
             2014
             2015
             2016
             2017
             2018
             2019
             2020
             2021
             2022
             2023
             2024
             2025
             2026
             2027

                          Return on Investment               Capital Provision

                                                        SASKATOON LIGHT & POWER           13
Saskatoon Light & Power
The end result of this plan would be to gradually adjust the percentage allocated in the four
main categories of expenses in order to better balance investments in capital provisions
with total financial benefit to the City. The following two pie charts show the allocation of
funds based on current levels (2018) and the projected allocation (2022).
Summary of Expenses (2018) Summary of Expenses (2022)
Return on Return on
Investment and Investment and
Grants-in-Lieu Grants-in-Lieu
Purchase of 28% Purchase of 25%
Bulk Power OM&A Bulk Power OM&A
from SaskPower (Operating, from SaskPower (Operating,
Maintenance and Maintenance and
53% Administration)
53% Administration)
10% 10%
Provisions to Provisions to
Capital Reserves Capital Reserves
9% 12%
As part of this plan, the utility intends to reduce overall renewal costs and extend the life
expectancy of assets. This will be accomplished through the implementation of an asset
management system. Currently, asset data and maintenance history resides in separate
systems and databases. As a result, it is difficult to query and analyze the data. As well, current
work management and project reporting systems are not designed to easily capture and
report the necessary data. By implementing an asset management system, the utility will be
able to improve efficiency in the utility’s maintenance efforts by targeting the maintenance
on the most critical elements of the system.
The Asset & Financial Management department has a project budgeted in 2017-2021
to implement an Enterprise Resource Planning system, which includes implementing a
corporate-wide Asset Management System.
14 City of SaskatoonSaskatoon Light & Power
CLIMATE ADAPTION STRATEGY
One of the key impacts for SL&P from climate change will be the potential for more frequent
and severe storms. Strong winds combined with rain or snow create conditions for trees to
bend and snap, sometimes falling onto overhead power lines and creating power outages. As
these types of storms become more frequent, it will become increasingly important to trim
trees away from power lines. Therefore, the potential funding plan has maintained operating
budget funding at a level that will allow trees to be trimmed on a seven-year cycle.
Increased lightning strikes on the electrical grid is another significant concern. The utility
has installed protection systems to reduce the impact of electrical surges on the utility’s
assets, but these protection systems will need to be replaced and upgraded in the future.
It is not practical to eliminate all future power outages from occurring, so SL&P has designed
its grid to be resilient and have built-in redundancy in accordance with industry standards.
For example, if a certain segment of the power grid is affected by a power outage, that
segment can often be isolated and have power rerouted around the area to continue serving
customers beyond the damaged area. New smart grid technology is being implemented to
help identify the location of outages faster and reroute power more easily.
Climate change mitigation may also have an impact on our customers’ reliance on
electricity. It is expected that electric vehicles will become more popular in the near future
as environmentally concerned customers move away from gasoline powered vehicles. This
may increase demand on the power grid. Over time, it is likely that electric vehicles will have
a significant share of the vehicle market.
Customers have also been investing in solar photovoltaic cells for their homes and
businesses in recent years through the utility’s Net Metering Program. While the total
amount of electricity generated remains very small (0.04% of the annual electricity sold to
customers), the number of connected customers generating their own power is doubling
every two years. Distributed generation systems typically do not meet the full needs of the
customer, so customers still rely on the utility for a portion of their power and for a backup
supply when their system fails. The reduced amounts collected from these customers do not
provide sufficient funding to maintain the extensive distribution system that is necessary
to serve all customers. Therefore, SL&P will continue to explore solutions to this issue in
collaboration with SaskPower.
The utility has also recently invested in sustainable electricity generating projects
including the development of the Landfill Gas Power Generation Station and a Solar Power
Demonstration project. Other projects under consideration include a hydropower project
at the weir, a combined heat and power project at St. Paul’s Hospital, and a utility-scale solar
plant. Generating clean energy meets the corporate direction to reduce greenhouse gas
emissions while providing benefits to our customers, the environment, and the City.
Visit saskatoon.ca for more information on the City’s overarching Climate Adaptation
Strategy, and Corporate Asset Management Plan.
SASKATOON LIGHT & POWER 15You can also read