BUILDING A BETTER RESOURCE INVESTMENT COMPANY - JULY 2021
←
→
Page content transcription
If your browser does not render page correctly, please read the page content below

BUILDING A BETTER RESOURCE
   INVESTMENT COMPANY
           JULY 2021
FORWARD LOOKING STATEMENTS

This presentation contains “forward-looking information” within the meaning of applicable Canadian securities legislation and United Stated federal securities laws. Forward-
looking information includes, but is not limited to, information with respect to future operating and development plans, the adequacy of Norvista’s financial resources,
business plans and strategy and other events or conditions that may occur in the future. Generally, forward-looking information can be identified by the use of forward-looking
terminology such as “plans”, “expects”, or “does not expect”, “is expected”, “budget”, “scheduled”, “estimates”, “forecasts”, “intends”, “anticipates”, or “does not anticipate”, or
“believes” or variations of such words and phrases or state that certain actions, events or results “may”, “could”, “would”, “might”, or “will be taken”, “occur”, or “be achieved”.
Forward-looking information is subject to known and unknown risks, uncertainties and other factors that may cause the actual results, level of activity, performance or
achievements of Norvista to be materially different from those expressed or implied by such forward-looking information, including risks associated with the competitive nature
of the resource and financial services markets, the effect of government regulation and compliance on Norvista and its industry, reliance on key personnel and the uncertainty of
future market conditions, including its impact on resource and financial services. Forward-looking information is based on the reasonable assumptions, estimates, analysis and
opinions of management made in light of its experience and its perception of trends, current conditions and expected developments, as well as other factors that management
believes to be relevant and reasonable in the circumstances at the date that such statements are made, but which may prove to be incorrect. Assumptions have been made
regarding, among other things: Norvista’s limited operating history, Norvista’s ability to manage future capital needs and the uncertainty of availability of additional financing,
the competitive nature of the resource and financial services industry, currency exchange risks, the need for Norvista to manage its planned growth and expansion, Norvista’s
ability to protect its proprietary rights, the effect of government regulation and compliance on Norvista and the resource and financial services industry, the ability of Norvista
to maintain properly working systems, reliance on key personnel, global economic and financial market deterioration and impeding access to capital or increasing the cost of
capital, volatile securities markets impacting security pricing unrelated to operating performance and the ability of Norvista to enforce judgments against a foreign corporation
and its management. Readers are cautioned that the foregoing list is not exhaustive of all factors and assumptions which may have been used. Although Norvista has attempted
to identify important factors that could cause actual results to differ materially from those contained in forward-looking information, there may be other factors that cause
results not to be as anticipated, estimated or intended. There can be no assurance that such information will prove to be accurate, as actual results and future events could differ
materially from those anticipated in such information. Accordingly, readers should not place undue reliance on forward-looking information. Norvista does not undertake to
update any forward-looking information, except in accordance with applicable securities laws.

                                                                                                                                                                                       2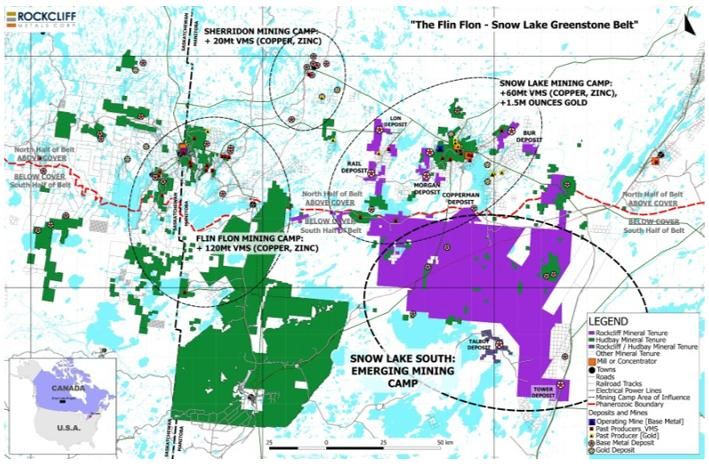
OVERVIEW
●    Norvista is a publicly listed resource-focused merchant bank
     and investment company. This structure provides three key

                                                                                       POSITIONING
     advantages over traditional investment vehicles:

                                                                                       NORVISTA
     1. Available to All        2. No Investment               3. Liquidity for        TO TAKE
                                                                                       ADVANTAGE OF
         Investors                 Restrictions              Investors without
                                                                  Disrupting
                                                           Investment Strategy

●    Three key pillars of our plan to transform the Company:
                                                                                       THE COMING
                                          $
                                                                                       COMMODITY
           1. Scale             2. Diversification               3. Hedging
                                                                                       BULL MARKET
    getting AUM to size that    reducing single asset       mitigate macro risk with
          makes sense          exposure & liquidity risk   commodity-linked hedges
                                                                                                      3
BUILDING IT BETTER
Investment Issuers like Norvista have existed for years but there
have been very few long-term successes. Notable issues include:
 1. Trading at a Discount to NAV
 2. Uneconomic Scale (Operating Costs >2% AUM)
 3. Insufficient Investment Liquidity to Manage Costs               CREATING A
The issues are solvable – creating the potential for a better
publicly listed resource investment vehicle.
                                                                    NEW BREED OF
We plan to take the following steps that we believe will address
all three issues:                                                   INVESTMENT
 1. Scale – merge with similarly undersized companies plus
    equity raises to get to an economic scale
 2. Diversify & Hedge the Portfolio
                                                                    ISSUER
 3. Buybacks & Dividends Once at Scale
 4. Minimize Operating Expenses

We expect the transformation process to take 18-24 months to
complete

                                                                                   4
Goal
The Path Forward Become a >C$250M
Publically Listed Resource
+24 Months Investment Company
• Institute a regular dividend and
First Six Months buyback program
• Continue Portfolio Transition • Continue Acqusitions & Share Swaps
• One or more Acqustions of Similar
Companies Objective: +C$50M Market Cap
• One or more Share Swaps
• Develop & Implement Marketing
THE PATH TO
Strategy
CREATING A
Objective: +C$20M Market Cap
SUSTAINABLE
First 12-18 Months BUSINESS
• Portfolio Repositioned for Long
Term Strategy
Day One • Two or more Acqustions of Similar
Companies
• New Management • Two or more Share Swaps
• Start Portfolio Transition to Long
Term Strategy Objective: +C$40M Market Cap
5A DIFFERENT INVESTMENT APPROACH
● Investments are split into three portfolios: Merchant Banking, Quantitative & Hedging
Merchant Banking – Driving Alpha Quantitative – Liquidity with Plus Beta Performance
to Resources
Focuses on taking advantage of value dislocations Uses a seven-step quantitative methodology 1 to
within the junior resource space identify equity investment opportunities in junior and
The mandate for this portfolio is broad and could mid-cap resource space
include investments like: Demonstrates outperformance vs traditional ETFs
• Equity investments in undervalued publicly listed over the long-term 2
companies
• Equity investments in private companies
• Royalties Hedging – Downside Protection
• Convertible or Traditional Debt
Hedges are put in place to protect the portfolios value
• Direct property interests against significant negative moves in the underlying
commodities
Norvista management will take a hands-on approach The additional benefit is that this provides liquidity
with the investee companies where warranted when markets are weak
1. See Appendix for methodology details
2. Based on back-testing the quantitative methodology, actual performance may differ from historical returns 6Capital Markets Profile
CAPITAL STRUCTURE SHARE OWNERSHIP
Ticker TSX-V: NVV Management & Directors
5.6%
Share Price (July 21, 2021) C$0.10
52-Week Trading Range C$0.095 – C$0.23 Institutions
16.1%
Basic Shares Outstanding 70.1M
Options1 6.4M
FD Shares Outstanding 76.5M
Market Capitalization (Basic) C$7.0M
Cash ~C$0.76M
Market Value of Equity Portfolio2 C$9.0M
Debt Nil
Net Asset Value per Share2 C$0.129
Retail & High Net Worth
Discount to Net Asset Value 22% Investors
1. 6,400,000 options outstanding with a weighted average exercise price of C$0.128 per share
78.3%
2. Reflects market prices of equity portfolio as of July 31, 2021 plus net working capital divided by fully diluted
in-the-money shares outstanding
7Current Portfolio Construction 1 Asset Breakdown (%)
Other Investments &
Working Capital,
12.8%
Investments C$ Per Share
Rockcliff Metals (CSE:RCLF) C$0.078 Minera Alamos
(TSXV:MAI),
Rockcliff Metals
Minera Alamos (TSXV:MAI) C$0.035 27.0%
(CSE:RCLF),
60.2%
Other Investments & Working Capital C$0.016
Total C$0.129
Asset Breakdown by Location (%) Asset Breakdown by Commodity (%) Asset Breakdown by Stage (%)
USA, 10% Africa, 0.1% Uranium, 0.2% Exploration,
Zinc, 9%
4%
Mexico, 27% Precious
Production,
Metals, 30%
27%
Canada, 63%
Development,
Copper, 60% 69%
Latin America,
0.5%
1. As at July 31, 2021
2. Working Capital is based on Cash on Hand, minus managements estimate for known liabilities and may change with future estimates/financial reports 8Core Investments
TSXV:MAI CSE:RCLF
• Proven mine builders with three low-CAPEX gold projects in Mexico • Large project portfolio: 7 high-grade, copper rich VMS deposits
− Santana Project (Sonora, Mexico): commissioning open pit heap leach gold − Total NI 43-101 resources of 530M lbs CuEq at 4.16% CuEq
operation in scheduled for first production in Q3 2021
• Premier mining region: Flin Flon – Snow Lake Mining District in Manitoba
− Cerro de Oro Project (Zacatecas, Mexico): maiden inferred resource of
640,000 oz Au at 0.41 g/t Au amenable to low-cost heap leach • Near-term development potential: PEA on just 2 of its deposits outline a
7-year underground mine producing 41M lbs CuEq per year and an after-
− La Fortuna Project (Durango, Mexico): permitted gold-silver-copper project
with robust PEA for a 50K oz AuEq/year open pit mine at low AISC of
tax NPV8% of C$122M (US$3.55/lb copper price)
US$440/oz with 93% IRR at US$1,250/oz gold price − PEA in the process of being updated
• Emerging producer with +150K oz/year potential over next 3-5 years • Compelling value: trading at an EV/Project NPV of only 0.13x
Share Price C$0.60 Share Price C$0.07
% from 52-Week High 23% % from 52-Week High 50%
Market Capitalization (Basic) C$265M Market Capitalization (Basic) C$22M
Cash & Cash Equivalents C$21M Cash & Cash Equivalents C$6M
Debt Outstanding Nil Debt Outstanding Nil
Shares Owned 3,717,000 Shares Owned 72,544,000
Market Value of Holdings C$2.4M Market Value of Holdings C$5.4M
Rockcliff Land Position in the Flin Flon – Snow
P/NAV (Consensus Research) 0.56x Santana gold recovery plant (commissioning) EV/Resource C$0.03/lb CuEq Lake Greenstone Belt
Consensus Research Target Price C$1.08 EV/Project NPV8% 0.13x
Highlights based on publicly available information from each investee company 9INVESTMENT THEMES BEYOND THE CORE
● As we transition the Company’s Investments in both the Merchant Banking and Quanitative portfolios are focused
on the following macro themes
Precious Metals
• The combination of the negative real rates (low nominal rates plus high inflation) coupled with significant U.S. debt
and U.S. deficits should benefit the gold price and by association the silver price
• The reduction in COVID restrictions should result in increased M&A focused on pipeline growth for cashed up major
and mid-cap companies
Green Metals
• Both government recovery spending and global sentiment is pushing towards electrification
• Benefits multiple metals but several have limited quality investment opportunities plus underlying cyclical
supply/demand fundamentals need to be favourable
• Norvista Focus – Copper, PGMs, Lithium, Nickel
Uranium
• Fits the decarbonization/green theme but different fundamentals
• Inventory decline, restarts, lack of new production has started pushing the price higher – we expect more to come
• Focus – Producers, Developers that work at reasonable prices
10THE TEAM DRIVING THE CHANGE
Derek Macpherson • 10 years of capital markets experience primarily in research at both bank owned and boutique investment banks
(P.Eng, MBA) • As a Mining Analyst identified numerous early-stage and turnaround opportunities that were mispriced by the market
•
Executive Chairman Previously Senior VP, Investment Banking as well as a Mining Analyst at Red Cloud Securities Inc.
• Also worked six years as a metallurgist
• President & CEO of Gold79 Resources (TSXV:AUU)
• Bachelor of Engineering and Management from McMaster University and MBA from the Schulich School of Business (York University)
Samuel Pelaez • Dedicated the past decade to financing natural resource projects while serving as Chief Investment Officer and Portfolio Manager at
Galileo Global Equity Advisors, and as an analyst at US Global Investors
(CFA, M. Fin) • Early investor in numerous resource discoveries and has been an active participant in Canadian resource corporate transactions
President, Director, • President, CEO & Director of Gossan Resources (TSXV:GSS)
CEO & CIO • Bachelors of B. Administration from the Schulich School of Business and Masters in Finance from The University of Cambridge
Carmello Marrelli • CFO since 2014
(CPA) • Principal of Marrelli Support Services Inc. and DSA Corporate Services Inc.
• Previously he was a partner with Marrelli & Drake Corporate Services
CFO
• Bachelor of Commerce degree from the University of Toronto
19BOARD OF DIRECTORS
Derek Macpherson • 10 years of capital markets experience primarily in research at both bank owned and boutique investment banks
(P.Eng, MBA) • Previously Senior VP, Investment Banking as well as a Mining Analyst at Red Cloud Securities Inc.
•
Executive Chairman President & CEO of Gold79 Resources (TSXV:AUU)
• Bachelor of Engineering and Management from McMaster University and MBA from the Schulich School of Business (York University)
Samuel Pelaez • Dedicated the past decade to financing natural resource projects while serving as Chief Investment Officer and Portfolio Manager at
Galileo Global Equity Advisors, and as an analyst at US Global Investors
(CFA, M. Fin) • Early investor in numerous resource discoveries and has been an active participant in Canadian resource corporate transactions
President, Director, • President, CEO & Director of Gossan Resources (TSXV:GSS)
CEO & CIO • Bachelors of B. Administration from the Schulich School of Business and Masters in Finance from The University of Cambridge
Darren Koningen • CEO and Director of Minera Alamos Inc.
(P.Eng) • Previously the CEO of NWM Mining Corp., VP Project Development at GoWest Gold Ltd., VP Operations and VP Engineering at
Castle Gold Corp and a Senior Process Engineer (mining and metallurgy) with Kvaerner Engineering
Independent Director • Bachelor of Applied Science, Mineral Process Engineering from Queen’s University
David Regan (MBA) • Extensive career in business operations, management consulting and financial services
• CEO of Sona Nanotech Inc. and previously served as EVP, Strategy and Corporate Development at WildBrain Ltd
Independent Director
• Previously worked in New York for global management consulting firm A.T. Kearney in the Financial Institutions Group
• MBA degree from INSEAD
Jeffrey Singer (MBA) • Over 25 years of experience in the asset management industry
• Previously the Executive Vice President and Chief Investment Officer at Investors Group Inc. in Winnipeg
Independent Director
• Previously the Senior Vice President-Global Equities and Head of Global Research at the Caisse de Depot
• Spent 17 years in New York as a portfolio manager with Bernstein Investment Research and Management
• MBA degree from Harvard Business School
19CONTACT 82 Richmond Street East Toronto, ON, M5C 1P1 Derek Macpherson Executive Chairman Email: dmacpherson@norvistacapital.com Phone: 416-294-6713
Appendix 1: QUANTITATIVE PORTFOLIO PROCESS

1   Quantitative Single Factor Testing

2   Statistical Multi -Factor Construction

3   “Safe Harbour”

4   Asymmetric Risk Profile Selection

5   Active Trading Discipline Matrix

6   Options Overlay

7   Quarterly Reassessment
                                             14
Appendix 2: MODEL QUANTITATIVE PORTFOLIO PERFORMANCE1 1. Based on back-testing the quantitative methodology, actual performance may differ from historical estimates of returns 15
Appendix 3: MERCHANT BANKING PORTFOLIO
INVESTMENT EVALUATION
1   Management – track record and capability

2   Balance Sheet – capital to move the project to the next stage

3   Scarcity – good assets in good jurisdictions are rare

4   Potential – what could this be? what does that mean to value?

5   Valuation – what do we see that the market is missing?

6   Catalysts – what events are going to close the valuation gap?

                                                                    16
You can also read