Burke County Community Health Needs Assessment 2019
←
→
Page content transcription
If your browser does not render page correctly, please read the page content below
Burke County
 Community
Health Needs
 Assessment
    2019

               1
Table of Contents
Executive Summary………………..………………………………………………………………………3
Background and Introduction………………………………………………………………………………7
        Data Collection…………………………………………………………………………………….7
        Populations at Risk…………………………………………..…………………………………….9
Community Profile………………...………………………………………………………………………14
        Geography……….………………………………………………………………………………..14
        History………………….…………………………………………………………………………15
        Demographics……………………...……………………………………………………………..16
Social Determinants of Health…………………………………………………………………………….18
        Poverty…………………………..……………………………………………………………..…18
        Employment…………………………………..…………………………………………………..22
        Unemployment……………………………………………………………………………………24
        Education …….………………………………………………..…………………………………24
        Housing………………………………………..………………………………………………….26
        Transportation…………………………………………………………………………………….27
Behavioral/Mental Health………………………………………………………………………………....31
Older Adult Profile………………………………………………………………………………….…….33
Sexually Transmitted Infections/Pregnancy..………………………………………………………….….35
Tobacco……………………………………………………………………………………………………38
Morbidity and Mortality…………………………………………………………………………………..39
Environmental…………………………………………………………………………………………….40
Areas of Success………………………………………….……………………………………………….41
Areas of Concern…………………………………….……………………………………………………44
Top Health Priorities………………………………………………………………………………………45
        Priority One……………………………….………………………………………………………45
        Priority Two………………………………………………………………………………………47
        Priority Three…………………………………………..…………………………………………50
Acknowledgements…………………………………………………………………………………..……51
Appendices………………………………………………………………………………………...………52
        Appendix A: Burke Wellness Initiative Members
        Appendix B: 2019 Burke County CHNA Survey
        Appendix C: 2019 Burke County CHNA Survey Results
        Appendix D: Focus Group Results
        Appendix E: Access to the 2019 Burke County CHNA
        Appendix F: References

                                                                         2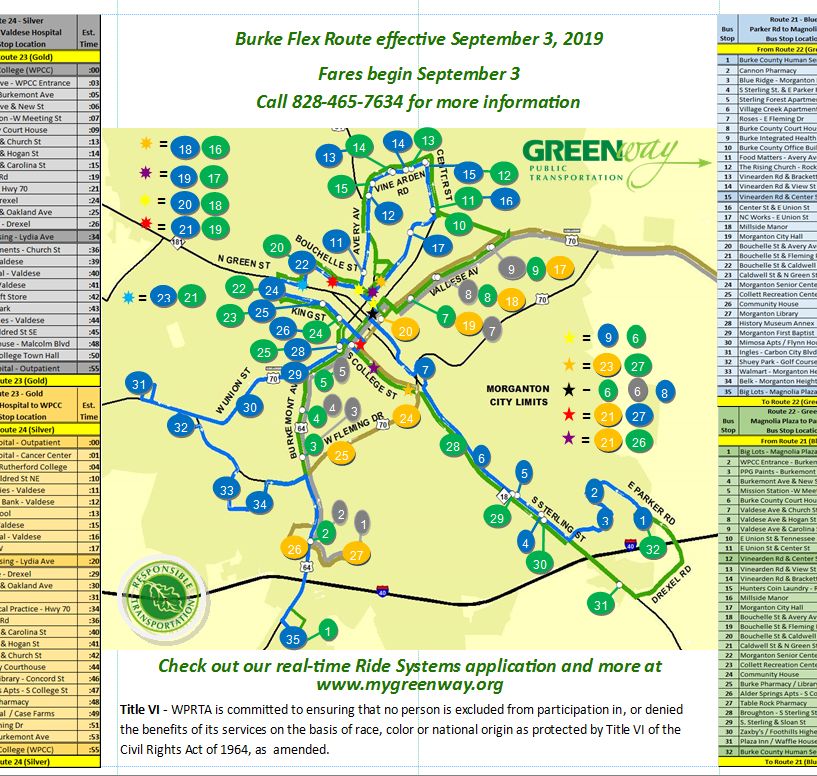
Executive Summary

Overview

The Community Health Needs Assessment (CHNA) is completed through a collaborative process
in which community members gain insight into health concerns and resources within the county.
This CHNA was completed as a joint effort between the Burke County Health Department
(BCHD) and Carolinas Healthcare System Blue Ridge, along with the organizations/individuals
that comprise the Burke Wellness Initiative.

The assessment was developed on four pillars split into primary and secondary data. The two
components of primary data resulted from both survey and focus group data from Burke County
residents, regarding health and social issues that impact the health of the people living in Burke
County. The primary data was collected from 1,049 completed surveys and approximately 81
focus group attendees. The two pillars of secondary data were gathered from state, national and
local statistics. Information from this community health needs assessment reveals the health and
quality of like in Burke County while identifying the strengths, challenges and resources in the
community.

Priority Determination

In September 2019, the Burke Wellness Initiative and additional community partners reviewed
the top five health and social issues identified in the results of the community survey and focus
groups. The group participated in a prioritization exercise to determine the priorities to develop
into a comprehensive Community Health Improvement Plan. The top three priorities identified
for the 2019 CHNA are:

1) Heart Disease/Stroke
2) Substance Use Disorder
3) Chronic Obstructive Pulmonary Disease (COPD)

Data Review

Demographics
• Estimated population of 88,898 residents
• Total estimated population saw a slight increase from 88,842 to 88,898 since the 2016
  assessment
• Median age in Burke County stayed the same from 2016 at 43.6
• Gender distribution consists of 49.4% male and 50.6% female
• 85(+) age group has steadily increased over the last couple of years which is indicative of the
  trend for Burke County

                                                                                                     3
Economic Climate
 • The poverty rate in Burke County dropped slightly from 19.9% in 2016 to 19.3% in 2017
 • The largest percentage of those in poverty at 41.3% are under the age of 5
 • Compared to the peer counties, Burke ranks second to highest for annual poverty rate
 • Burke County’s median household income is $40,854
 • Burke County’s per capita income is $6,238 less than the state average

Employment
 • Burke County’s unemployment rate for 2017 was 4.9% which is lower than the average of
   5.7% in 2015
 • When compared to peer counties, Burke County has the second lowest unemployment rate
 • Burke County, like NC, has experienced a decrease in the labor force
 • Case Farms and Valdese Weavers are the major manufacturing employers and Burke County
   Public Schools and Carolinas Healthcare System Blue Ridge are the top non-manufacturing
   employers within Burke County

 Education
 • Burke County has a diverse school population with attendance in public, charter, private and
   home school settings
 • Burke County exceeds the state graduation rate of 86.5% with 89.7% of Burke County
   students receiving high school diplomas
 • Burke County’s percentage of students receiving free and reduced lunch is 53.7% compared
   to 59.35% in the 2016 assessment

 Social Determinants of Health

 Housing
 • Most housing structures in Burke County were built between 1939 and 2010
 • Median value of an owner-occupied home is $115,400
 • The median gross rent in Burke County is $635 per month and has stayed relatively the same
   since the 2016 assessment
 • A diverse community collaboration has been appointed to assess and address the lack of
   housing and lack of affordable housing in Burke County

Transportation
 • After successful acquisition of funding in 2018, Greenway Public Transportation started 4
    flex routes for a two-year trial period in Burke County
 • Two routes cover Morganton city proper and two routes have a service area from City of
    Morganton to the eastern end of Burke County
 • On-call van service and para-transit van service are still available to Burke County riders as
    needed

                                                                                                    4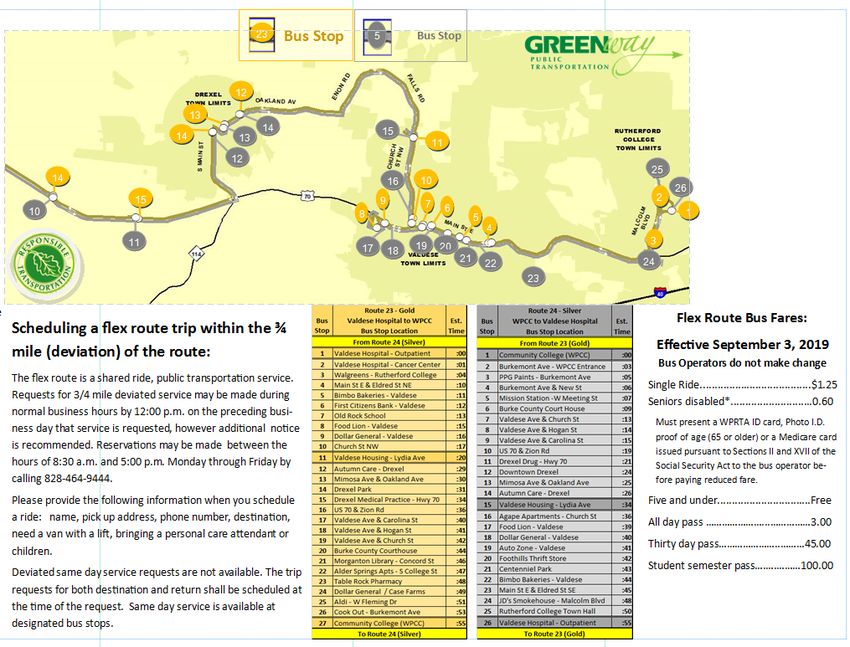
Morbidity/Mortality

•   Residents born in Burke County between 2015-2017 will have an estimated life expectancy of
    76.4 years
•   The top five leading causes of death for Burke County changed slightly from the 2016
    assessment. The top five leading causes of death in 2017 were 1) Diseases of the heart, 2)
    Cancer, 3) Chronic lower respiratory diseases, 4) All other unintentional injuries and 5)
    Alzheimer’s disease
•   Most chronic conditions facing the community are costly and largely preventable with some
    positive lifestyle behavior changes

Areas of Success

•   Both individuals and organizations in Burke County portray a strong sense of community
    engagement. The desire is evident in the pursuit to collectively address concerns that impact
    the health of residents and ensure Burke County is a healthy place for all populations.
•   Since the 2016 CHNA, Burke County received several large grants to address the substance
    misuse epidemic within Burke County:
       1. Burke Recovery/Burke Substance Abuse Network received the Drug Free Communities
           grant from the Substance Abuse Mental Health Services Administration to facilitate
           multiple prevention efforts around underage drinking and misuse of prescription
           medications as well as other associated substances within Burke County.
       2. Burke County received a federal Department of Justice grant for Burke County
           Recovery Court (Adult Drug Court). Recovery Court serves high risk/high need adult
           non-violent offenders voluntarily interested in participating in treatment/recovery
           services.
       3. Through the Burke Substance Abuse Network, Burke County received a grant from the
           Kate B. Reynolds Charitable Trust to begin and complete a 3-year comprehensive
           community strategic gap/needs/asset analysis of the drug use/misuse challenge within
           Burke County.
       4. Burke County recently received another federal Department of Justice grant for the
           HARBOUR-LEAD project. LEAD is a pre-arrest community based and law
           enforcement led diversion program with the goals of improving public safety and public
           order. This program diverts voluntary offenders into community based, intensive case
           management and treatment receiving a wide array of support services to reduce
           recidivism. HARBOUR (Helping Achieve Recovery through Burke Opioid Use
           Reduction) program goals include: (1) reduce overdose incidents and deaths; (2) give
           low-level offenders the opportunity to access treatment with long-term recovery support
           instead of criminal justice system involvement, thereby reducing recidivism rates and
           long-term costs to the taxpayers; (3) provide treatment and long-term recovery support
           along with maximizing the ability of those in recovery to reintegrate into the community
           (aka. Re-entry).
•   Burke County will open a new state-of-the-art 264 bed facility (Burke County Jail) to house
    all the Burke County inmates locally and reduce transporting of inmates to other jails and
    discontinue the need for Burke County to rent bed space from surrounding jails.

                                                                                                 5
•   A housing leadership team has been assembled to determine the extent of the
     housing/unaffordable housing shortage within the county to be able to provide more
     permanent and rental properties for Burke County residents and those looking to relocate to
     this area

 Areas of Concern

 •   Homelessness continues to be an important issue in Burke County. As the number of
     individuals that are considered homeless continues to increase, the demand for adequate
     resources for this population will be difficult to sustain. Accuracy of information is difficult
     since agencies gathering this data use various assessment instruments and cannot yield
     consistent county wide data.
 •    Substance misuse remains to be a great concern within Burke County. Burke County is
     seeing an increase in the use of meth and other drugs since the accessibility to opioids has
     been reduced so additional treatment and recovery support services remain necessary to
     reduce the demand from those in addiction.
 •   Lack of housing and lack of affordable housing remains to be an important issue within Burke
     County. Further studies and long-range planning continue to be developed so Burke County
     can attract future business for positive growth.
 •   Medicaid Transformation is a concern for all those who provide services for the Medicaid
     population. This challenge will be watched carefully as the new delivery of services begin to
     decrease the atmosphere of competitiveness among providers especially those in behavioral
     health.

 Conclusion

Heart disease/stroke, substance use disorder and COPD touch every member of the community in
many ways and contribute to years of productive lives lost through physical impairment, financial
instability, emotional devastation, disability and even death. When caring communities pool
resources and work together to provide prevention education, access to care, treatment and
recovery support, and adequate resources, they empower individuals/families to take responsibility
for their health and well-being.

                                                                                                   6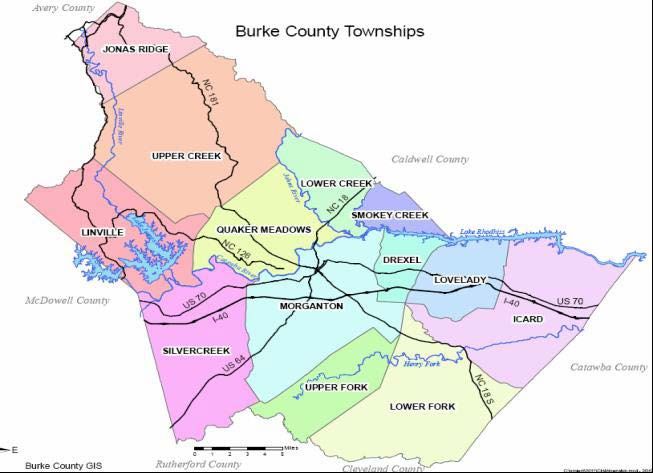
Background and Introduction
The Burke Wellness Initiative is the driving force for the Community Health Needs Assessment
(CHNA) process. The Burke Wellness Initiative is led by the Burke County Health Department
and Carolinas HealthCare System Blue Ridge. The Burke Wellness Initiative maximizes
community resources and input to develop the CHNA using a formal community engagement
process. The committee utilizes the Mobilizing for Action through Planning and Partnerships
(MAPP) framework for community engagement. There is a total of approximately 58 members
representing 34 agencies and the community at large (refer to Appendix A for a full list of
members and agencies).
The purpose and vision of the Burke Wellness Initiative is to ensure that Burke County embraces,
educates and provides the opportunity to empower persons of all ages to make informed choices
to live healthier lives. The values include, access, empowerment, engagement, capacity,
education and continuity (communication). The Burke Wellness Initiative defines “wellness” as
encompassing physical, emotional, mental and spiritual health and well-being. The Burke
Wellness Initiative is responsible for the planning, marketing, implementation and evaluation of
CHNA process.
MAPP is a community-wide strategic planning process for improving public health, as well as an
action-oriented mechanism to help communities prioritize public health issues, identify resources
for addressing them, and act accordingly. The MAPP framework consists of six phases: (1)
Organizing for Success and Partnership Development, (2) Visioning, (3) Four MAPP
Assessments, (4) Identifying Strategic Issues, (5) Formulate Goals and Strategies, and (6) The
Action Cycle.

Data Collection
The CHNA reveals the health and quality of life in Burke County while identifying the strengths,
challenges and resources within the community. The CHNA process gathers, analyzes and
evaluates health data from primary and secondary sources. As part of the primary data collection,
a CHNA survey was distributed and focus groups were hosted to collect county residents’
opinions regarding health and social issues that impact the health of those living in Burke
County. Secondary data was gathered from state and local statistics as cited in Appendix F:
References.
The Burke Wellness Initiative collected primary data through the following methods:
   • Community Health Needs Assessment Survey (Survey tool and results cited in
   Appendix B & C)
          o 1,049 Burke County residents completed survey responses
          o Burke Wellness Initiative members distributed paper copies and online links to
             CHNA survey in Survey Monkey to the following community areas and
             organizations, including but not limited to:
                ▪ Burke County Chamber of Commerce
                ▪ Burke County Government Employees

                                                                                                    7
▪ Burke County Public Libraries
▪ Burke County Public School employees
▪ Burke County United Way-Partner Agency Network
▪ Burke Literacy Council
▪ Carolinas HealthCare System Blue Ridge employees and patients
▪ Community Wide Health Screening- Lady Fair
▪ Morganton-Burke Senior Center
▪ Western Piedmont Community College
Good Samaritan Clinic Board
Builders Association
Burke Mission Station
• Focus Groups
o Focus groups gathered additional information from citizens regarding their
health concerns, behaviors and potential solutions to address the identified health
concerns.
o Participants were invited through word of mouth, personal and public
invitation and through other established groups.
o Conducted 7 focus groups with 81participants including:
(Focus group results cited in Appendix D)
▪ Burke Substance Abuse Network members
▪ Burke County Circles Group
▪ Cultural Diversity Committee – Carolinas Healthcare System Blue Ridge
▪ Opportunity Threads – Spanish Speaking owned private business
▪ Good Samaritan Clinic staff
▪ CHS Cancer Support Group
▪ Burke Senior Center
Peer Counties
Peer counties are determined by HealthStats, North Carolina’s interactive health statistics
website. HealthStats provides numerical statistical data on the health status of North
Carolinians and the state of the health care system in North Carolina. Peer counties are
determined based on:
1. Population size
2. Number of individuals living below the poverty level
3. Population under 18 years of age
4. Population 65 years of age and older
5. Population density
Burke County’s peer counties include Caldwell, Lee, Rockingham, Surry and Wilkes.
8
Populations at Risk

     •   Uninsured/Underinsured
Access to affordable health care is a national concern affecting all; including the residents of
Burke County. Even after the adoption of the Affordable Care Act, residents who
were unable to qualify for governmental assistance (ex. Medicaid, Medicare) and who were
also unable to afford the healthcare options offered through the HealthCare Marketplace fell
into the "Medicaid Gap." After North Carolina voted not to expand the "Gap," these residents
were left without an avenue through which to receive basic healthcare. These residents who
live without health insurance seek health care at hospital emergency departments; the most
expensive venue for the treatment of non-emergent conditions; local free clinics or opt not to
seek any health care assistance.

Burke Health Network is a collaboration of safety net providers within Burke County tasked with
coordinating resources for those uninsured/underinsured residents with securing medical,
behavioral health and whole person care and increase the opportunity for improved health and
quality of life. Burke Health Network assists uninsured residents between the ages of 18-64 and
fall under the 200% federal poverty level status gain
access to a medical home.

In 2018, Burke Health Network screened 1,413 residents for services with the following
breakdown:

 •   Of those, 993 were enrolled in the network and placed in a medical home with
     coordinating services
 •   1,108 of the residents were screened for assistance with the social determinants of health
     (housing, food, transportation, etc.)
 •   200 clients were enrolled in the NC Medication Assistance program and were able to
     access much needed medication
 •   480 clients were bridged for one-time medication assistance
 •   1,081 clients completed a comprehensive health assessment
 •   499 referrals were made for labs, diagnostic imaging, eyeglasses, specialty care, etc.
 •   The leading diagnosis was hypertension (high blood pressure)

     • Substance Misuse Population
Burke County, NC is ranked in the top 5% of vulnerability for the rapid dissemination of
HIV or HCV infections among persons who inject drugs - there is no doubt when reviewing
the needs of the county as well as the rising use of opioids that the residents of the
community are in need of prevention and intervention. Before the addition of the STOP
Act, the local hospital system, Carolinas HealthCare System - Blue Ridge implemented an
internal policy to stem the flow of opioid prescriptions and through the prescription

                                                                                                   9
reduction policy made an impact on the number of pills distributed in the community.

However, the lowered rate of opioid prescribing has not impacted “supply and demand,” as
individuals with the disease of addiction, or those using recreationally, still maintain the
“demand” for a substance and therefore alter the “supply.” As a result, meth and heroin use
is on the rise.
According to Carolinas HealthCare System - Blue Ridge Emergency Department, 4.55% of
all Emergency Department visits are primarily due to substance use. Of those visits, over
one-half (2.66% of the total visits) are for meth use, nearly one-fifth (0.83% of the total
visits) are for opioid use and the remainder is a combination of cocaine, marijuana,
benzodiazepines and other drugs. Since November 2012, the Burke County Sheriff’s
Office has collected and disposed of over 3,147 pounds of prescription medication using
two of the county’s seven drop boxes and multiple take-back events; this is equivalent to
2,618,295 pills made inaccessible for misuse in only seven years.

The cost of this epidemic is measurable in multiple ways, including loss of life, loss of
children due to involvement of foster care, and loss of economic revenue. According to the
NC Injury and Violence Prevention Branch, Burke County’s unintentional drug overdose
rate in 2016 was 27.9 per 100,000 residents, which was 229% higher than the state rate of
12.2 and 174% higher than the regional rate of 16. The financial impact for Burke County,
as calculated by the NC State Center for Health Statistics in 2016 was
$33,663,578; $150,426 incurred through medical bills and the remaining $33,513,152 due
to the loss of work.

The number of children in foster care due to substance use/misuse has remained at
maximum capacity due to over 90% of the children being placed outside of the home,
whether in licensed foster care homes or with kinship guardians, as a result of parental
misuse of substances.

The chart information below reported by Burke County Department of Social Services
indicates the numbers of children who entered care due to parental substance misuse as well
as the number who entered care for reasons other than substance misuse for the past several
years.
       Year           Average for Year in    Entry due to substance   Entry not due to
                      Foster Care            misuse                   substance misuse
       2016           197                    98                       13
       2017           241                    98                       13
       2018           232                    78                       12
       2019 YTD       237                    66                       8

                                                                                               10
• Homelessness
There is more than one “official” definition of “homelessness”. Health centers funded by
the US Department of Health and Human Services (DHHS) use the following definition: A
homeless individual is defined as an individual who lacks housing (without regard to
whether the individual is a member of a family); including an individual whose primary
residence during the night is a supervised public or private facility (e.g. shelters) that
provides temporary living accommodations; and any individual who is a resident in
transitional housing. A homeless person is an individual without permanent housing who
may live on the streets; stay in a shelter, mission, single room occupancy facilities,
abandoned building or vehicle; or in another unstable or non-permanent situation.
An individual may be homeless if that person is “doubled up,” a term that refers to a
situation where individuals are unable to maintain their housing situation and are forced to
stay with a series of friends and/or extended family members. In addition, previously
homeless individuals who are to be released from a prison or a hospital may be considered
homeless if they do not have a stable housing situation to which they can return. A
recognition of the instability of an individual’s living arrangement is critical to the
definition of homelessness.
The latest annual Point in Time Count of those individuals experiencing homelessness in
Burke County was completed in January 2019. It is noted that Burke County falls within
Region 3 of the Point in Time count. Although Region 3 data is broken down to include
detailed demographics on gender, age, race, ethnicity and veteran status, any additional
data is unavailable. Burke County’s data is as follows:
• Unsheltered Homeless = 29 People/28 Households
• Emergency Shelter and Transitional Housing = 40 People/32 Households
Morganton Department of Public Safety Captain Jason Whisnant and his team work on
community engagement department within the Public Safety Office. Through this vital
role, these officers have an opportunity to build a relationship with this population and
gather this important information that can be used to determine community needs, gaps,
resources, etc. Morganton Public Safety conducted their own homeless count in July 2019.
The data below is the count from this survey. Captain Whisnant indicates that the following
data is a minimum estimate of the existing problem and notes there are new camps/people
coming in weekly. Survey information was voluntary; meaning, they were not required to
provide information to the team. There were eight individuals that did not want to disclose
any information.
11Place/State of Number of
• Active camps-22 Origin Individuals
• Counted people-28 Burke County 8
• Gender: Male-20 / Female-8 Kentucky 5
• Length of time in Morganton: Statesville 1
o Life = 4 Asheville 1
o 20+ years = 4 South Carolina 1
o 10 years = 1 Florida 1
o 5 to 9 years = 3 Tennessee 1
o 1 to 4 years = 3 Eastern NC 3
o 6 months to 1 year = 2 Michigan 1
o less than 6 months = 11 No response 6
These surveyed individuals accessed the following resources within the community:
Burke United Christian Ministries (BUCM)– 24; The Outreach Center – 3; Summit
Church – 1; and A Caring Alternative (Mental Health/Substance Use Services) – 4.
When asked if they wanted services, there were 26 responses to “No” and two did not
have a response. Below were the responses about what brought them to Morganton:
• Family or friends-20
• Services-2
• Stayed after Carnival Left-3
• Work-2
• no response- 1
Burke County Public Schools provided a brief snapshot of homeless students identified
during the last academic year. The school system abides by the McKinney-Vento definition of
homelessness which “means individuals who lack a fixed, regular, and adequate nighttime
residence”.
• 2018-19 = 72 students
• 115 suicide risk screenings were completed by Counselors/Social Workers
• 101 students served in the Burke Alternative to suspension program
• 76 truancy charges filed
Burke United Christian Ministries which operates within the definition of homeless as,
“not having a stable roof over their head”; provided the following information for their
contact with the homeless population:
• Number served: In 2018, served 561 individuals who were homeless at some time
during the year. The agency provided $10,145.50 worth of assistance 775 times in
the form of tents, sleeping bags, tarps, back packs, blankets, heaters, etc.
• Resources and Referrals Used: The House of Refuge, The Meeting Place, DSS, A
Caring Alternative, Strategic Interventions, Partners Behavioral Health, Burke
Health Network, Burke Integrated Health, Christ Centered Recovery, Vessels of
Mercy, Burke Recovery, Options, etc.
• Identified Gaps/Needs in Services/Resources - Housing is, by far the scarcest
12resource. There is very limited transitional housing and almost nothing for
homeless families. Additionally, daycare and access to mental health services are
also issues.
• Older Adults 65(+)
Healthy People 2020 sees unprecedented growth in the number of older adults. In
2014, 14.5% (46.3 million) of the US population was aged 65 or older and
is projected to reach 23.5% (98 million) by 2060. Aging adults experience a
higher risk of chronic disease. Burke County continues to see an increase in
the older adult population and the challenges it poses. Within this
assessment is a detailed section on the older population.
13Community Profile
Geography
Burke County is in the western part of North Carolina located in the foothills of the Blue Ridge
Mountains. Burke County is bordered to the west by McDowell County and to the south by
Rutherford and Cleveland counties. Its border to the north is shared by Caldwell and Avery
counties while Catawba County lies due east.
Burke County covers a land mass of approximately 514 square miles with an elevation that ranges
from 900 to over 4,300 feet above sea level. Burke County consists of 13 townships and seven
municipalities: Morganton being the largest as well as the county seat.
The Catawba River runs through the county and feeds Lake James, which has become one of the
major attractions of Burke County and support 1.5 million recreational users a year. Lake James
is one of the most pristine lakes remaining in the Southeast and is in the northwestern portion of
Burke County. To preserve Burke County’s environmental integrity the Lake James and South
Mountain State Parks were established nearly 30 years ago. Other attractions include the wild,
rugged and scenic wilderness of Linville Gorge, the age-old mystery of the Brown Mountain
Lights, and panoramic vistas from the top of Table Rock, Shortoff Mountain, and the Blue Ridge
Parkway.
14Burke County is home to beautiful outdoor trail and park opportunities for residents
and those visiting the area. Burke County has approximately 13 trails encompassing
3,055 acres and 15 miles of biking trails located at Lake James. There is a new
beautifully constructed Fonta Flora trail covering 18 miles. South Mountain State
Park offers 50 plus trails with approximately 8,746 acres of forest land. Linville
Gorge has roughly 20 trails with a total of 48,407 acres including Brown Mountain
Off Road Trail encompassing 15 trails. Closer to downtown Morganton, residents
and visitors can enjoy 5 miles of Greenway Trail with 204 acres for biking and
walking. Burke County also offers additional outdoor opportunities within four
county parks offering walking, biking and park amenities. The parks cited are:
Reep Park approximately 98 acres with 2 miles of natural surface trail; Simpson
Park approximately 22 acres with 1 mile of natural and paved surface trail; Spring
Park approximately 32 acres with 1 mile of paved surface trail and Parker Road Park
approximately 15 acres with 1 mile of natural surface trail.
History
In 1777, the NC General Assembly passed an act dividing Rowan County and creating a new
county named in honor of Thomas Burke. Mr. Burke was a representative in the Continental
Congress until he became the third governor of the state. The new county of Burke comprised
such a large territory that it later became the largest part of the 16 counties including Buncombe,
Catawba, Mitchell, Madison, Yancey, Caldwell, McDowell and Alexander. In 1834, Burke
County was reduced to its present size of 514 square miles.
Burke County’s first courthouse was built in 1785, about eight years after the county was
formed. A second courthouse was constructed in 1791 and served as the county Courthouse until
1833 when a two-story building was authorized by the General Assembly. Until vacated for the
new courthouse in 1976, the Old Burke County Courthouse was the oldest public structure in
Western North Carolina still being used for its originally designated purpose.
To date, the largest landowners in Burke County are the US Government, Crescent
Resources (Duke Energy Co.), and the State of North Carolina. Burke County also
has the third largest concentration of state employees in North Carolina.
Departments include: Department of Transportation, Department of Corrections, J.
Iverson Riddle Developmental Center, North Carolina School for the Deaf and
Broughton Hospital.
15Demographics
Burke County is home to an estimated total population of 88,898 1which is a minute increase
from 88,842 reported in the 2016 Community Health Needs Assessment. According to the NC
Department of Commerce: October 2019 profile, Burke County is approximately 57% urban
encompassing 50,672 residents while 38,226 residents live in the rural parts of the county which
cover the remaining 43%.2
Graph 1: 2017 Peer County Population
Estimates
89,898 91,566
100,000 81,805
72,315 68,525
59,805
50,000
2017
0
Burke Caldwell Lee Rockingham Surry Wilkes
Graph 1 depicts the population size comparisons for Burke County’s recognized
peer counties. Burke County has the second highest estimated population base
when compared to the peer counties.
16Graph 2: Burke County Age Distribution
65+ YEARS
45-64 YEARS
20-44 YEARS
0-19 YEARS
0 5,000 10,000 15,000 20,000 25,000 30,000
0-19 Years 20-44 Years 45-64 Years 65+ Years
2017 19,998 25,963 26,261 16,676
2016 20,221 26,190 26,279 16,214
2017 2016
Graph 2 depicts the US Census age estimates for Burke County. Estimates from 2016 to 2017
decreased slightly in each age category except the 65 and older group which increased slightly.
American Fact Finder also noted that the 85+ age group has steadily increased over the last
couple of years which is indicative of the trend for Burke County.3 Since the trend for the
older population is projected to continue to increase, aging factors such as accessibility,
mobility and disability will become issues which Burke County will need to research and
develop plans to address in the future.
Graph 3: Peer County Age Comparison
35
30
25
20
15
10
5
0
0-19 20-44 45-64 65+
Burke 22 29 30 19
Caldwell 23 29 30 18
Lee 27 31 26 15
Rockingham 23 28 30 19
Surry 24 28 28 19
Wilkes 23 28 29 20
17Graph 3 shows the age comparison for Burke’s peer counties. This comparison illustrates that
Wilkes County has the highest percentage of 65 and older adults with Lee County having the
lowest population base and the higher percentage of 0-44 age groups.
In 2017, the median age stayed close to the same as the last assessment at 43.6 with a gender
distribution of 43,908 males (49.4%) and 44,990 females (50.6%). Children under the age of 5
has stayed the same at 4.8%.4 The age distribution for Burke County hasn’t changed since the
2016 Needs Assessment.
Graph 4: Distribution of Race
0.1
3.5 1.6
3.6
0.5
6
84.7
White African American
American Indian/Alaska Native Asian
Native Hawaiian/Other Pacific Islander Some other Race
Two or More Races
Graph 4 is Burke County’s most recent racial distribution. The racial makeup has not changed
since the 2016 assessment. 92% of residents speaks English with 8% speaking another language.
According to the US Census Bureau American Fact Finder, an estimated 5,223 residents or 5.9%
of the population within Burke County is of Latino origin.5
And as of December 2019, Burke County had 54,500 registered voters with a distribution as
follows: 15,507 Democrats, 20,243 Republicans, 18,419 Unaffiliated, 291 Libertarian, 24 Green
and 16 Constitution.
Social Determinants of Health
Poverty
An imperative component of the assessment of population health is poverty; a condition defined
by an inability to have one’s basic needs (food, shelter, clothing) met. The American
Psychological Association sites poverty as a major leading cause for “substandard housing,
homelessness, inadequate nutrition and food insecurity, inadequate childcare, lack of access to
health care [and] unsafe neighborhoods.” Additionally, children are specifically affected through
18“poor academic achievement, school dropout, abuse and neglect, behavioral and socioeconomic
problems, physical health problems and developmental delays.” As it is inherently tied to the
other identified health issues, it is necessary to consider poverty as not only a separate concern,
but an origin for the trauma that leads to other concerns like substance use/misuse and mental
health.
The poverty rate is the percent of the population (both individuals and families) whose monetary
income (which includes job earnings, unemployment compensation, social security income,
public assistance, pension/retirement, royalties, child support, etc.) is below the threshold
established by the Census Bureau. In 2015 and 2016, the estimated poverty rate was 19.9% and
dropped slightly to 19.3% in 2017.6 Those in poverty under the age of 18 comprise 29.3%,
with the largest percentage in poverty being under the age of 5 at 41.3%.7 Below is the
breakdown of those below the poverty level by age group and education attainment level for
those over the age of 25:
Those age 25 and over:
Under the age of 5 41.3% Less than a high school graduate 30.7%
18-34 years of age 25.6% High school graduates 14.0%
35-64 years of age 16.1% Some college/Associates degree 14.3%
65+ years of age 9.8% Bachelor’s degree or higher 4.3%
Graph 5: Peer & State Comparison of Annual Poverty
Rate
100
90
80
70
60
50
40
30
20
10
0
Burke Caldwell Lee Rockingham Surry Wilkes NC
2014 20.7 20.5 18.7 18.8 19.8 24.3 17.6
2015 19.9 19.6 18.1 18.7 19.7 23.3 17.4
2016 19.9 17.6 18.3 19.4 17.9 21.1 16.8
2017 19.3 16.4 17.5 18.5 17.6 20.9 16.1
2017 2016 2015 2014
Graph 5 depicts the comparison of the annual poverty rate between Burke County, the peer
counties and the state since 2014.8 All the counties have consistently stayed above the state
rate. Burke County continues to experience a slight decrease each year in the poverty rate.
Compared to its peers, Burke County has consistently ranked second to highest for rate of
poverty.
19The Outreach Center is a community based nonprofit relief organization serving Burke County
residents through hunger relief, job training, education, and arts programs. Their mission is to
empower children and their families to break the cycle of generational poverty. In 2018, the
Outreach Center provided the following services:
• 10,965 assists with groceries during the mass food distributions translating to 1.5 million
dollars’ worth of food to individuals within the community
• The food distribution fed 4,157 individuals (1,472 children under 18; 2,213 adults and 452
seniors age 60 and older)
• 1,472 children received life-sustaining food and clothing
• 382 children received diapers
• 330 individuals received education and workforce development training
• 35 children received free art and music lessons
• 10,789 volunteer hours were provided and were valued at $261,000
• 845 pets received food
• 516 senior food boxes were distributed to the elderly
The Good Samaritan Clinic is an interdenominational faith-based ministry providing medical
care, dental care, mental health counseling, farmworker outreach, confidential HIV testing and
counseling, ancillary services and prescription medications to Burke County residents who are
without private insurance, government assistance, or the financial resources to afford such care.
Since opening its doors in 1996, Good Samaritan Clinic has provided low-cost healthcare to more
than 10,000 residents valued at more than $90 million. Through volunteer commitment and strong
community partnerships, the clinic provides more than $5 million in free medical care and
prescriptions annually. Beginning April 2019, the Good Samaritan Clinic received funding and
began to expand dental services offered to those in need. Below is the initial dental stats:
4,040 – Individual procedures April – December 2019
754 – Encounters July – December 2019
480 – Unduplicated patients 2019
Dental clinic is open 2 days per week where the dentist sees 13 patients per day, hygienist sees 6
to 7 patients per day and the clinic sees approximately 2 to 4 new patients per day to help meet
the need.
20Graph 6: Peer County Per Capita Income
Comparison
30,000 28,123
23,613
25,000 21,885 21,991 22,521 22,533 21,798
20,000
15,000
10,000
5,000
0
Burke Caldwell Lee Rockingham Surry Wilkes NC
Per capita income or average income measures the average income earned per person in a given
area (city, county, region, etc.) in a specified year. It is calculated by dividing the area’s total
income by its total population. Graph 6 shows that Burke County is second to last in per capita
income when compared to its peer counties and $6,238 less than the state average.9
Graph 7: Peer County Median Household
Comparison
60,000
49,272 50,320
50,000
40,854 40,735 41,700
39,071
40,000 37,173
30,000
20,000
10,000
0
Burke Caldwell Lee Rockingham Surry Wilkes NC
Household income is the average income of all people living in a housing unit whether related or
not. Median household income is the point where half the population makes more, and half
makes less. Graph 7 shows the comparison of the median household income between Burke and
21peer counties. The comparison shows that Burke County ranks third from the bottom. While it
is higher than the previous assessment at $37,086, there is still room for improvement to a more
competitive household income. The median household income in Burke County of $40,854 is
$9,466 less than the NC average.10
The Burke County Department of Social Services reports that the average number of eligible
served SNAP/EBT participants through the NCFAST report was as follows:
2016 – 13,107
2017 – 12,192
2018 – 12,467
Employment
NC Works estimates that Burke County’s labor force has decreased from 41,419 in July 2019 to
40,910 in August 2019 with July 2019 having the highest labor force since January 2016 when it
was reported at 39,440. The state of NC has otherwise seen a recent decrease in the labor
force.11
US Census, American Fact Finder estimates that 67.3% of Burke County residents work within
the county, 32% work outside of Burke County and .7 work outside NC.12
According to the Burke Development Incorporated, the following companies are the major
manufacturing employers in Burke County for 2018.13
Number
Employer Industry
Employed
Case Farms Food Processing 1000
Valdese Weavers Woven Fabric 750
Leviton Electrical 625
Continental Automotive Anti-Lock Brakes 525
Seiren NA Automotive 275
Baker Furniture Furniture 250
Molded Fiberglass Truck & Bus Bodies 220
Bimbo Bakeries Baked Goods 215
Gildan Textiles 187
22Kellex Seating Furniture 178
Chaddock Furniture Furniture 175
EJ Victor Furniture 165
Gerresheimer Glass Glass & Glass Product Mfg. 150
SGL Carbon Graphite Products 125
Source: Burke Development Incorporated
The following companies are the major non-manufacturing employers in Burke County for 2018.
Employer Industry Number Employed
Burke County Public Schools Public Education 1,500
Carolinas HealthCare – Blue Ridge Health Care 1,400
Broughton Hospital Mental Health Care 1,225
J. Iverson Riddle Developmental Mental Health Care & 1,000
Ctr. Research Ctr.
Burke County County Government 525
Western Piedmont Community College System 415
College
City of Morganton City Government 270
Source: Burke Development Incorporated
According to NC Works Online: Labor and Economic Analysis Division, occupations with the
highest projected growth from 2017-2026 are as follows:
• Food preparation and serving workers including fast food
• Janitors and cleaners
• Heavy tractor-trailer truck drivers
• Nursing assistants
• Laborers and freight, stock and materials movers
23The same analysis division also shows the top 10 positions with highest median (annual) wages
in Burke County for 2018 were:
• Sales Managers $144,548
• Chief Executives $130,014
• Pharmacists $129,587
• Architectural and Engineering Managers $117,546
• Physicians Assistants $104,744
• General and Operations Managers $102,079
• Medical and Health Services Managers $98,850
• Financial Managers $94,121
• Industrial Production Managers $90,654
• Administrative Service Managers $88,142
Unemployment
Graph 8: Peer County Comparison of Unemployment
Rate
Wilkes
4.6
Surry
4.2
Rockingham
4.9
Lee
5
Caldwell
4.6
Burke
4.3
3.8 4 4.2 4.4 4.6 4.8 5
Graph 8 depicts the unemployment rates of peer counties compared to Burke County. In Burke
County since 2016 the unemployment rate has been as low as 3.1% and as high as 4.9% in
2017.14 Currently, Burke County’s unemployment rate is the same as the State’s rate. When
compared to peer counties, Burke has the second lowest unemployment rate.
Education
Burke County has a diverse school population with students attending public, charter, private and
home schools within the community. Burke County Public Schools has an enrollment of 12,668
for the 2019-2020 school year. Over the last 4 school years, Burke County Public Schools has
24seen a gradual increase in student enrollment except for a sharp decrease in 2018-2019 and a
rebound for school year 2019-2020. Burke County’s most current high school graduation rate
for 2018-2019 is 89.7% which is higher than the state rate of 86.5%. Graduation rates in Burke
County have fluctuated very little since the last assessment. In 2016, Burke County Public
Schools was recognized for having the highest graduation rate in the state for medium size
school district. Below Graph 9 depicts the graduation rates for Burke compared to peer
counties.15
In Burke County, 100% of schools receive some percentage of free and reduced lunch
compensation through the Federal Eligibility Program. This year, the public schools have seen a
3.1% increase in lunch participation and a 23% increase in breakfast participation. Burke
County’s percentage of students partaking in free and reduced lunch program is 53.7% compared
to 59.35% in the 2016 needs assessment.
Burke County has a large home-schooled community which continues to increase. In 2016,
Burke County had 1,043 homeschooled students. According to the NC Home School Statistical
Summary report, an estimated 1,467 home schoolers were enrolled for school year 2017-2018
and 1,540 for 2018-2019 school year.16
Burke County has 4 private schools, Morganton Day School, Silver Creek Adventist School,
Reflections of Christ Christian Academy and Christ Classical Academy with a current combined
enrollment of approximately 170 students. Burke County also has one charter school, New
Dimensions, where approximately 340 kindergarten through 8th grade students are enrolled.
Burke County is also home to Western Piedmont Community College with an approximate
enrollment of 4,000-degree program students and more than 10,000 enrolled in continuing
education courses. Several universities operate satellite programs on the Western Piedmont off
campus instructional site.
Graph 9: Peer County and State Comparison High
School Graduation Rate
95
90
85
80
75
70
Burke Caldwell Lee Rockingham Surry Wilkes NC
2015 90.1 90.6 89.1 81.4 89.6 87.6 85.6
2016 91.1 90.8 89.2 79.9 90.1 87.6 85.9
2017 86.4 89.5 90.1 85.4 90.6 88.9 86.5
2018 88.4 88.5 89.3 85.7 91.7 87.9 86.3
2019 89.7 88 87.8 86.5 93 88.2 86.5
2015 2016 2017 2018 2019
25Educational Attainment:
Ages 25 (+) 65(+)
Less than a HS grad 19.5% 22.5%
HS grad/GED 30.2% 33.4%
Some college/Assoc degree 33.6% 26.4%
Bachelor’s degree or higher 16.7% 17.6%
The 65 (+) group has a higher achievement percentage at each end of the attainment spectrum
except for some college/associate degree level.
Housing
Burke County has a total number of 40,989 housing units; of those, 34,568 are occupied and
6,421 are vacant.17 Most housing structures in Burke County were built between 1939 and 2010.
The median value of an owner-occupied house in Burke County is $115,400.18 In Burke County,
the number of owner-occupied housing units increased slightly from 22,914 in 2010-2014 to
24,733 from 2013 – 2017.19
Conversely, the number of renter-occupied housing units was 10,300 from 2010-2014 and
dropped slightly to 9,835 from 2013 – 2017.20 The median gross rent is $635 per month
with 69.7% of renters paying between $500-$999.21 The median rent has stayed relatively
the same since the last CHNA in 2016.
Available, affordable and adequate housing (rental/ownership) is often a barrier to the health and
well-being of the citizens of Burke County. The security that comes from an available,
affordable and adequate home or lack thereof, plays an intricate role in the physical, emotional
and mental health of an individual. Burke County is facing the challenge of providing housing
for its current residents and those forecasted to relocate to Burke County by 2021. There are
several agencies working on the development of new housing
(rental/ownership/subsidized/affordable/market value). In 2017, Burke County assembled a
housing committee who in turn commissioned a housing needs assessment. The completed
report evaluated demographics, economic growth and housing supply. This report will be used
to develop a long-range plan to address the housing insufficiency. Renovation or sales of
identified properties that have been abandoned, are substandard or are condemned will also be
addressed.
Education and assistance in foreclosure and repair assistance has been offered for several years.
Many policies at all levels hinder the success of agencies that are working to fill the gap of
providing affordable and adequate housing at all income levels. These policies need to be
reviewed in relationship to the housing challenges and addressed accordingly. The need is great
to provide housing for the natural growth of the county, however, there are several projects that
will be bringing more people to the area therefore housing needs will soon exponentially grow.
26Housing issues cause stress which can lead to more serious illnesses, including physical illnesses
due to living conditions.
Research has shown a clear link between financial health, which includes the ability to afford
house, and physical health. People with strong financial health experience less stress, access
regular preventive healthcare, make healthier choices and take prescribed medication. People
with strong physical health can work longer and are better equipped to deal with financial issues.
Access to safe, secure and good quality housing is an important determinant of good health and
assists communities with the following: 1) frees family resources which in turn can be used for
nutritious food and health care expenditures; 2) provides greater residential stability and reduces
stress and related adverse health outcomes; 3) fosters greater self-esteem and a sense of security
over their physical environment; 4) well-constructed/well-maintained housing can limit exposure
to allergens, neurotoxins and other dangers; 5) neighborhood improvements can create healthier
opportunities such as walkable communities, retail establishments, access to fresh produce, etc.
Transportation
Prior to 2018, the Western Piedmont Regional Transportation Authority (WPRTA), commonly
known as Greenway Public Transportation, operated rapid demand van and paratransit (ADA-
compliant) services in Burke County with no fixed or regular route. An individual had to
schedule a request by phone for individualized van transit service at least three (3) days in
advance with a Greenway reservationist.
In 2018, a community coalition of businesses, nonprofits, and governmental agencies partnered
to discuss the need for regular transportation in Burke County. Under the guidance of the
Western Piedmont Council of Governments, transportation planners and the service operator,
WPRTA/Greenway prepared a narrative of need to convince third-party, external grantees to
fund a fixed route in Burke County.
Two of the larger obtained grants were funded by the Appalachian Regional Commission (ARC)
and the Kate B. Reynolds Charitable Trust. Grant narratives expressed transportation need for
employment and medical appointments, respectively. For example, the ARC grant application
included letters of support from area businesses and employers to show that there was support
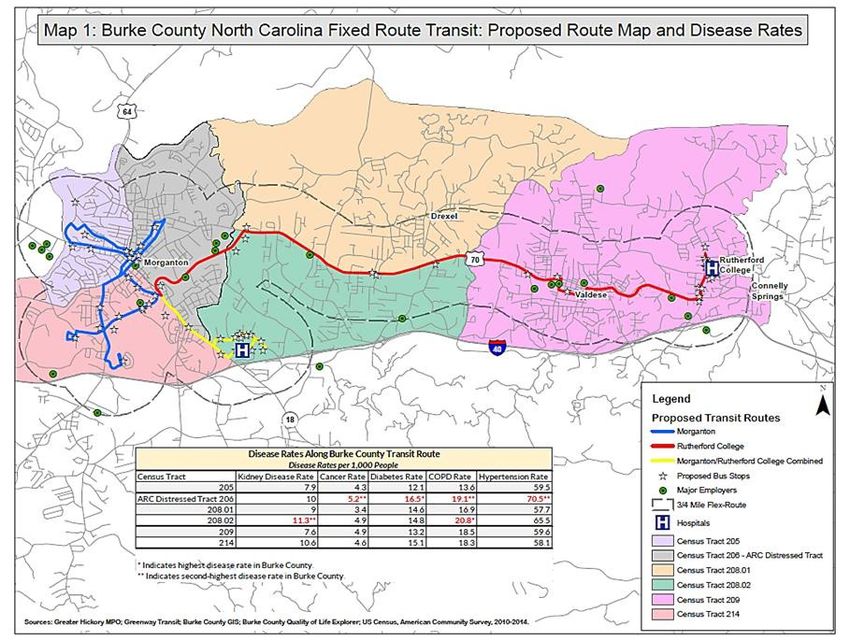
for regular transit for working people in the county. There was also data for disease rates in
Burke County to show the need for medical transportation (**see graphic/map below).
27You can also read