Business case: 2013 addendum - NZ Transport Agency October 2013 - Waka Kotahi NZ Transport ...
←
→
Page content transcription
If your browser does not render page correctly, please read the page content below
Business case:
2013 addendum

© NZ Transport Agency
October 2013

Copyright information
This publication is copyright © NZ Transport Agency.
Material in it may be reproduced for personal or in-house use
without formal permission or charge, provided suitable
acknowledgement is made to this publication and the
Transport Agency as the source. Requests and enquiries
about the reproduction of material in this publication for any
other purpose should be made to:
NZ Transport Agency
Private Bag 6995
Wellington 6141
The permission to reproduce material in this publication does
not extend to any material for which the copyright is
identified as being held by a third party. Authorisation to
reproduce material belonging to a third party must be
obtained from the copyright holder(s) concerned.

Disclaimer
The Transport Agency has endeavoured to ensure material in
this document is technically accurate and reflects legal
requirements. However, the document does not override
governing legislation. The Transport Agency does not accept
liability for any consequences arising from the use of this
document. If the user of this document is unsure whether the
material is correct, they should refer directly to the relevant
legislation and contact the Transport Agency.

More information …
If you have further queries, call our contact centre on
0800 699 000 or write to us:
NZ Transport Agency
Private Bag 6995
Wellington 6141
This document is available on the Transport Agency’s
website at www.nzta.govt.nz.

Page i

Approval
Prepared by:                    Reviewed by                      Endorsed by                        Approved by

Sam Wilkie                       Tony Brennand                    Selwyn Blackmore                  Rod James
Project Manager, Wellington      Principal Transport Outcome      Principal Project Manager, RoNS   Highway Manager – Wellington
RoNS Development Team            Planner                          Development

                                 Craig Nicholson
                                 Project Management Services
                                 Manager

Date 21 October 2013            Date 21 October 2013             Date 21 October 2013               Date 21 October 2013

Revision number:                           Implementation date                          Summary of revision

1.0                                        October 2013                                 Final

NZ Transport Agency Wellington Northern Corridor: Business case: 2013 addendum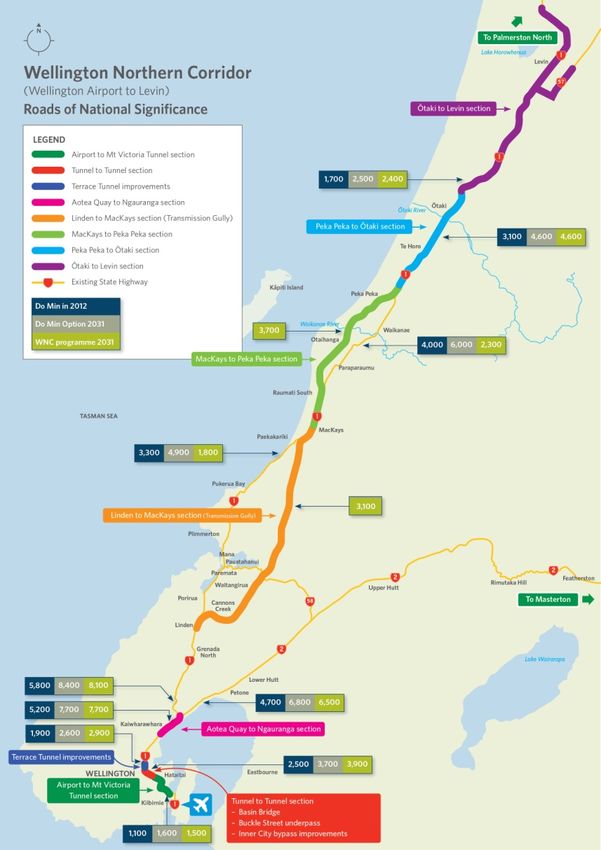
Page ii

NZ Transport Agency Wellington Northern Corridor: Business case: 2013 addendum
Page iii
Contents
Approval ................................................................................................................................................................................ i
Glossary ................................................................................................................................................................................ 1
Summary .............................................................................................................................................................................. 5
Key programme progress .................................................................................................................................................................... 5
Highlights of the 2009 Business Case ............................................................................................................................................. 6
Key highlights of the 2013 Business Case Addendum ................................................................................................................ 7
1 Background.............................................................................................................................................................. 9
1.1 Purpose ........................................................................................................................................................................................ 9
1.2 Key highlights of the 2009 Business Case ........................................................................................................................ 9
1.3 Key progress made on the WNC Programme ................................................................................................................ 10
1.4 WNC Programme progress .................................................................................................................................................. 11
2 Methodology for development of the 2013 Business Case Addendum .................................................... 12
2.1 Methodology overview ..........................................................................................................................................................12
2.2 Opus Report and REMAT ......................................................................................................................................................12
2.3 Richard Paling Report .............................................................................................................................................................13
2.3.1 Approach to calculating agglomeration benefits ..................................................................................................13
2.4 Key assumptions ......................................................................................................................................................................13
2.5 What is out of scope ...............................................................................................................................................................15
3 Strategic context ................................................................................................................................................... 16
3.1 National context ...................................................................................................................................................................... 16
3.1.1 Connecting New Zealand ............................................................................................................................................ 16
3.1.2 Government Policy Statement on Land Transport Funding 2012-15 .............................................................. 16
3.1.3 Safer Journeys .................................................................................................................................................................17
3.1.4 Statement of Intent 2013-16 ........................................................................................................................................17
3.1.5 National Land Transport Programme 2012-15 ...................................................................................................... 18
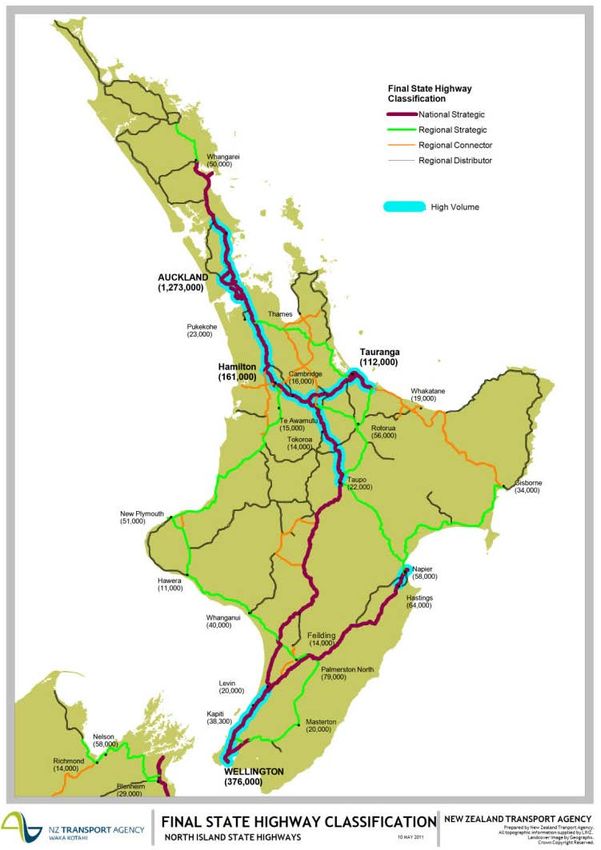
3.1.6 State highway classification system ........................................................................................................................ 19
3.1.7 National War Memorial Park (Pukeahu) Empowering Act 2012.................................................................... 20
3.1.8 Land Transport Management Amendment Act 2013 ..........................................................................................21
3.1.9 Resource Management Act .........................................................................................................................................21
3.1.10 Public Works Act 2013 .................................................................................................................................................21
3.2 Regional context ......................................................................................................................................................................21
NZ Transport Agency Wellington Northern Corridor: Business case: 2013 addendum
Page iv

      3.2.1       Overview ........................................................................................................................................................................... 21

      3.2.2       Wellington Region......................................................................................................................................................... 23

      3.2.3       District plans................................................................................................................................................................... 28

      3.2.4       Wellington International Airport .............................................................................................................................. 29

      3.2.5       CentrePort ....................................................................................................................................................................... 29

      3.2.6       Clifford Bay Ferry Terminal ........................................................................................................................................30

      3.2.7       Manawatu-Wanganui Region....................................................................................................................................30

3.3       What’s unchanged since 2009? ........................................................................................................................................30

4         Corridor assessment ............................................................................................................................................ 31

4.1       Objectives .................................................................................................................................................................................. 31

4.2       Project Identification .............................................................................................................................................................. 31

      4.2.1       WNC Network Plan ....................................................................................................................................................... 31

      4.2.2       Ngauranga Triangle Strategy Study 2010 ............................................................................................................... 31

      4.2.3       Regional Land Transport Programme 2012-15 ...................................................................................................... 31

4.3       Programme element definition ........................................................................................................................................... 33

      4.3.1       Airport to Mount Victoria Tunnel ............................................................................................................................ 33
      4.3.2       Tunnel to Tunnel ........................................................................................................................................................... 34

      4.3.3       Terrace Tunnel ............................................................................................................................................................... 35

      4.3.4       Aotea Quay to Ngauranga .......................................................................................................................................... 35
      4.3.5       Ngauranga to Linden (Petone to Grenada Link Road) ........................................................................................ 36

      4.3.6       Linden to MacKays Crossing (Transmission Gully) ............................................................................................ 36

      4.3.7       MacKays Crossing to Peka Peka ............................................................................................................................... 37
      4.3.8       Peka Peka to Ōtaki ........................................................................................................................................................ 37

      4.3.9       Ōtaki to Levin ................................................................................................................................................................. 37

5         Network assessment ........................................................................................................................................... 39
5.1       Introduction ............................................................................................................................................................................. 39

      5.1.1       Roading connections .................................................................................................................................................... 39

      5.1.2       Public transport.............................................................................................................................................................. 39
      5.1.3       AADT growth ................................................................................................................................................................. 39

      5.1.4       Freight road and rail ..................................................................................................................................................... 40

5.2       Wider economic impacts ......................................................................................................................................................41
      5.2.1       Introduction .....................................................................................................................................................................41

      5.2.2       Agglomeration benefits ............................................................................................................................................... 42

      5.2.3       Imperfect competition benefits ................................................................................................................................. 42

NZ Transport Agency Wellington Northern Corridor: Business case: 2013 addendum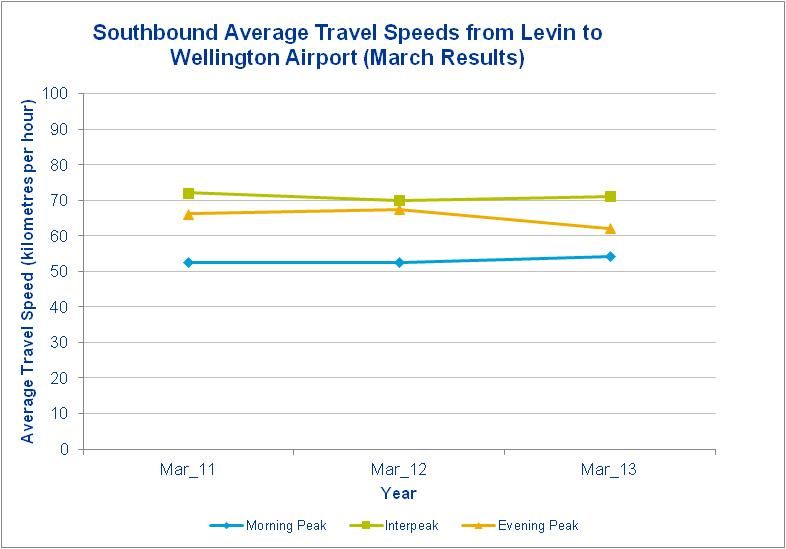
Page v

      5.2.4     Labour supply benefits ................................................................................................................................................ 42

      5.2.5     Labour demand benefits ............................................................................................................................................. 42

      5.2.6     Patterns of regional development and employment growth............................................................................ 42

      5.2.7     Freight issues ................................................................................................................................................................. 42

5.3      Improved connections to areas of economic growth potential ................................................................................ 43

5.4      Increasing access to markets ............................................................................................................................................. 43

      5.4.1     Agriculture ...................................................................................................................................................................... 43

      5.4.2     Retail and manufacturing ........................................................................................................................................... 44

      5.4.3     Tourism ........................................................................................................................................................................... 44

5.5      Improvements to journey time reliability........................................................................................................................ 46

      5.5.1     Airport to Mount Victoria Tunnel ............................................................................................................................ 46

      5.5.2     Tunnel to Tunnel ........................................................................................................................................................... 47

      5.5.3     Terrace Tunnel .............................................................................................................................................................. 47

      5.5.4     Aotea Quay to Ngauranga ......................................................................................................................................... 47

      5.5.5     Transmission Gully....................................................................................................................................................... 47

      5.5.6     MacKays to Peka Peka ................................................................................................................................................ 47
      5.5.7     Peka Peka to Ōtaki........................................................................................................................................................ 48

      5.5.8     Ōtaki to Levin ................................................................................................................................................................. 48

5.6      Easing of severe congestion ............................................................................................................................................... 48
5.7      Improving transport efficiency........................................................................................................................................... 50

5.8      Alternatives and options ..................................................................................................................................................... 50

5.9      Quantifying the wider economic impacts ....................................................................................................................... 50
      5.9.1     Introduction .................................................................................................................................................................... 50

      5.9.2     Agglomeration impacts .............................................................................................................................................. 50

      5.9.3     Imperfect competition...................................................................................................................................................51
      5.9.4     Labour supply ..................................................................................................................................................................51

      5.9.5     Labour demand ...............................................................................................................................................................51

      5.9.6     Construction jobs ..........................................................................................................................................................52
      5.9.7     Overall assessment .......................................................................................................................................................52

5.10     Economic assessment ...........................................................................................................................................................52

      5.10.1         Introduction ...............................................................................................................................................................52
      5.10.2         Transportation modelling ......................................................................................................................................53

      5.10.3         Travel time .................................................................................................................................................................53

      5.10.4         Level of service .........................................................................................................................................................55
      5.10.5         Vehicle operating costs ..........................................................................................................................................56

NZ Transport Agency Wellington Northern Corridor: Business case: 2013 addendum
Page vi

      5.10.6           Improvements in road safety ............................................................................................................................... 56

      5.10.7           Safety analysis .......................................................................................................................................................... 57

      5.10.8           Programme benefit cost ratio .............................................................................................................................. 58

      5.10.9           Adjusted Programme BCR to include Wider Economic Impacts ............................................................... 59

      5.10.10          Sensitivity tests ........................................................................................................................................................ 59

5.11      Network assessment summary...........................................................................................................................................61

6         Funding .................................................................................................................................................................. 62

6.1       Previous applications ............................................................................................................................................................ 62

6.2       Programme spend .................................................................................................................................................................. 63

6.3       Construction approvals ........................................................................................................................................................ 63

6.4       Expected construction cashflow ........................................................................................................................................64

6.5       Funding assessment profile .................................................................................................................................................64

7         Programme ............................................................................................................................................................ 66

8         Risk.......................................................................................................................................................................... 68

8.1       Risk analysis process .............................................................................................................................................................68

8.2       Risk quantification ..................................................................................................................................................................68
8.3       Key project risks .....................................................................................................................................................................68

9         Procurement ......................................................................................................................................................... 70

10        Case management ............................................................................................................................................... 72

11        Conclusion ............................................................................................................................................................. 73
Appendix A                          Opus report: RoNS business case economic update 2013
Appendix B                          Richard Paling report: Assessment of wider economic impacts for the Wellington
                                    Northern Corridor RoNS
Appendix C                          Travel time savings for all times north and south
Appendix D                          Congestion indices for AM inbound and PM outbound
Appendix E                          Method for calculating crash reductions

NZ Transport Agency Wellington Northern Corridor: Business case: 2013 addendum
Page 1
Glossary
2009 business case NZ Transport Agency’s Wellington Northern Corridor RoNS – detailed business case (2009),
which was approved by the Board on 10 November 2009. This business case was used to
secure funding for the investigation, design and property purchase for those sections of the
programme that had yet to receive such approvals.
th
95 percentile cost This is one of the range of values that accompany a probability distribution that reflect the
th
uncertainty in the cost of a project. The 95 percentile represents the value for which 95%
of the distribution falls below, or put another way, if the project were completed 20 times,
one would expect the out-turn cost to come within this value on 19 of the 20 occasions.
Addendum Refers to this document.
AADT Annual average daily traffic.
Agglomeration benefits Agglomeration benefits are a form of WEI, but are treated as a CEB. They occur when
businesses gain advantages from being able to interact more effectively with reduced
transport costs so achieving higher levels of productivity.
Airport to Mount Victoria Improvements to the section of SH1 between the Wellington Airport and Mount Victoria
Tunnel Tunnel, including a duplicated Mount Victoria Tunnel.
Aotea Quay to Ngauranga Improvements to the section of SH1 between Aotea Quay off/on-ramp and Ngauranga
Gorge.
BCR Benefit cost ratio.
CEB Conventional economic benefit. Appendix A10.2 of the EEM states this with regard to the
difference between CEBs and WEIs: ‘The economic evaluation framework for transport
activities in New Zealand has historically been based on evaluating the direct benefits to
transport users and private transport operators (transport user surplus). Reorganisation of
industry and households to take advantage of changes in accessibility created by improved
transport infrastructure and services and the benefits thereof have been regarded as a
lagged effect of secondary importance and difficult to quantify. Agglomeration benefits are
part of these reorganisation effects.’
CEBs include travel time savings, vehicle operating cost savings, crash reduction savings.
ECI Early contractor involvement (a professional service/constructor delivery model).
EEM The NZ Transport Agency's Economic Evaluation Manual (EEM) is the industry's standard
for the economic evaluation of transport activities and is used by approved organisations for
economic evaluation and the preparation of funding applications to the Transport Agency.
The EEM sets out procedures and values to be used for the calculation of benefits such as
savings in travel time, increased trip reliability, changes in vehicle operating costs, reduced
accident costs, as well as benefits from increased transport user comfort, reduced driver
frustration and impacts on the environment and non-transport users. Last published 1
January 2010, however the Transport Agency issues general circulars that have updated
EEM policy and procedures.
Expected cost estimate This is one of the range of values that accompany a probability distribution that reflect the
uncertainty in the cost of a project. The expected estimate is the mean value that on
average is not likely to be exceeded.
GDP Gross domestic product.
NZ Transport Agency Wellington Northern Corridor: Business case: 2013 addendumPage 2
GPS Government Policy Statement on Land Transport Funding 2012/13–2021/22.
GWRC Greater Wellington Regional Council.
HCC Hutt City Council.
HCV Heavy commercial vehicle.
HNO Highways and Network Operations Group of the Transport Agency.
HNO VAC HNO Value Assurance Committee. The Group Manager HNO’s senior management advisory
group.
Imperfect competition CEBs assume that a $10 saving in business travel time results in extra output worth $10.
However markets rarely work like this (ie they are imperfect) and businesses have some
control over price, rather than just the market setting price. Research has demonstrated
there is imperfect competition in several sectors in the New Zealand marketplace, and this
research provides methods to assess benefits associated with imperfect competition.
KCDC Kapiti Coast District Council.
Labour demand benefits Labour demand benefits arise when new businesses establish employment centres as a
result of better accessibility. The benefits are those recognised by the government – the tax
component of their income. The wage rates used in this analysis account for the potentially
lower productivity associated with new entrants.
Labour supply benefits Labour supply benefits arise when the cost of commuting declines to a point where
additional workers will be attracted into the work force. The benefits are those recognised
by the government – the tax component of their income. The wage rates used in this
analysis account for the potentially lower productivity associated with new entrants,
however it is noted that currently, the demand for labour may be more of a constraint than
the cost of commuting.
MacKays to Peka Peka Improvements to the section of SH1 between MacKays to Peka Peka including a new
expressway west of the existing SH1.
NFDS National Freight Demands Study.
NIMT North Island Main Trunk railway.
NLTP AG National Land Transport Programme Advisory Group. The Group Manager P&I’s senior
management advisory group.
NPV Net Present Value. This is the value used for economic evaluation as it accounts for the
difference between values ie it ‘nets out’ a value, and demonstrates the extra cost or benefit
associated with some action, in this case a road improvement. For example the expected
estimate for Transmission Gully is $881.7m, and the NPV cost is $536.6m. The NPV cost
includes for the cost associated with the do minimum option, the residual value of the asset
at the end of the evaluation period, and also for the time when the construction will be paid
for (it is a forecast six year period between 2014 – 2020 under the Design and Construct
delivery model assumed for the purposes of this Addendum).
NWM Park National War Memorial Park.
Ōtaki to Levin Improvements to the section of SH1 between north of Ōtaki and north of Levin including
improved structures and other safety improvements.
Opus Report Opus International Consultants Wellington Northern Corridor RoNS Business Case Economic
Update 2013 Report (August 2013). The report that describes the benefits and costs of the
NZ Transport Agency Wellington Northern Corridor: Business case: 2013 addendumPage 3
programme. The Opus Report is contained in Appendix A.
Peka Peka to Ōtaki Improvements to the section of SH1 between Peka Peka to Ōtaki including a new
expressway close to the existing SH1 alignment and east of Ōtaki.
Petone to Grenada Link Road Improvements to the section of SH1 between Ngauranga and Linden and the section of SH2
between Petone and Ngauranga with a new link road between Petone and Grenada (near
Linden).
P&I Planning and Investment Group of the Transport Agency.
PFR Project Feasibility Report. PFRs are primarily used to identify and investigate the viability of
a proposed network improvement. If viable the next phase in project development is
investigation and reporting.
PPP Public Private Partnership.
PV Present Value. The present value is a future amount of money that has been discounted to
reflect its current value, as if it existed today. It is always less than or equal to the future
value because money has interest-earning potential. It is different to NPV as it is not netted
against another value.
REMAT RoNS Economic Modelling Assessment Tool. The REMAT is a platform where individual
RoNS project economics can be loaded to enable reporting for the WNC programme. It
allows programme timings, costs, benefits and discount rates to be adjusted so as to
undertake sensitivity tests.
RLTP Regional Land Transport Programme.
RPTP Regional Public Transport Plan.
Richard Paling Report Richard Paling Consulting’s Assessment of Wider Economic Benefits for the Wellington
Northern Corridor RoNS Report (August 2013). The report that describes the WEIs of the
programme. The Richard Paling Report is contained in Appendix B.
RoNS Roads of National Significance.
SAR Scheme Assessment Report. The report that summarises the findings of investigation for a
preferred alignment.
SCP Strategy, Communications and Performance Group of the Transport Agency.
SH1 State Highway 1.
SH2 State Highway 2.
SLT Senior Leadership Team of the Transport Agency.
Sunk costs Sunk costs are costs irrevocably committed which have no salvage or realisable value, and
are not included in the evaluation, eg investigation, research and design costs already
incurred. Where expenditure on an activity has already been incurred, it shall still be
included in the evaluation if the item has a market value and this value can still be realised,
eg land. Refer to section 2.5 of the EEM.
Terrace Tunnel Improvements Improvements to the section of SH1 between Willis Street and Aotea Quay.
Transmission Gully Improvements to the section of SH1 between Linden and MacKays including a new
expressway east of the existing SH1.
NZ Transport Agency Wellington Northern Corridor: Business case: 2013 addendumPage 4
Transport Agency NZ Transport Agency (NZTA).
Tunnel to Tunnel Improvements to the section of SH1 between the Mount Victoria Tunnel and Terrace Tunnel
including improvements to the Inner City Bypass, Memorial Park improvement including the
Buckle Street Underpass, and the Basin Reserve Bridge.
WBUDMT Wellington Business Unit Decision Making Team of the Transport Agency’s HNO Group
consisting of senior managers of the Wellington regional team of HNO.
WCC Wellington City Council.
WEB Wider Economic Benefit as described under WEI.
WEI Wider Economic Impacts were previously referred to as WEBs in the 2009 Business Case.
For the purposes of this report, agglomeration benefits are identified separately, but are
CEBs as per the EEM.
In addition, and as per the EEM, this Addendum includes the following “other” WEIs as per
the EEM for sensitivity testing purposes:
• labour supply benefits,
• labour demand benefits, and
• imperfect competition.
WNC programme package The activities that ensure the Wellington Northern Corridor RoNS programme is effective. At
this point this includes the Petone to Grenada Link Road. These activities are contained
within the WNC Network Plan.
WNC programme The SH activities that make up the Wellington Northern Corridor RoNS programme,
excluding the Petone to Grenada Link Road.
WRLTS Wellington Regional Land Transport Strategy 2010-40.
WRPS Wellington Regional Policy Statement.
WRPT Plan Wellington Regional Public Transport Plan.
WTSM Wellington Transport Strategic Model.
NZ Transport Agency Wellington Northern Corridor: Business case: 2013 addendumPage 5
Summary
The purpose of this Addendum is to provide a progress update on the Wellington Northern Corridor Detailed
Business Case (2009 Business Case), which was approved by the NZ Transport Agency’s (Transport Agency)
Board on 26 November 2009.
A detailed business case was developed in 2009 to support the (Transport Agency’s) Highway and Network
Operations Group funding request for $386.2m for the investigation, design and property purchase phases of the
Wellington Northern Corridor RoNS programme.
Significant progress has been made on the rollout of the Wellington Northern Corridor programme since the
2009 Business Case was approved. This progress, and further information on the likely outcomes resulting from
the programme’s implementation, is detailed in this document.
The key findings of this Addendum will be used to inform and/or support future construction funding requests in
the current National Land Transport Programme 2012-15.
Key programme progress
The key progress made on the WNC programme since 2009 includes:
• Construction funding approved and construction commenced for the MacKays to Peka Peka section, the
Tunnel to Tunnel section and the first stage of the Aotea Quay to Ngauranga section. Construction funding
also approved for the Transmission Gully section and the procurement of a public private partnership
consortium for Transmission Gully is currently underway,
• Scheme assessments for six of the eight sections completed, which improves HNO’s understanding of the
likely costs and benefits for each completed section,
• RMA approvals for the Transmission Gully and MacKays to Peka Peka sections obtained, which further
improves confidence of the likely costs for these combined sections that together account for approximately
half of the expected costs for the programme,
1
• Development of the WNC Network Plan which includes the wider package of improvements needed to make
the Wellington Northern Corridor effective. One of these improvements is the Petone to Grenada Link Road,
the preferred option for the section of SH1 between Ngauranga and Linden. A decision as to whether the
Petone to Grenada Link Road will be a state highway or a local road has yet to be made, and
• Detailed project feasibility reports completed for each project within the Ōtaki to Levin section, which
increases HNO’s confidence in the costs and benefits of this section.
Since 2009 there have been some notable changes to the strategic national/regional/local transport
policy/planning context that recognises the WNC programme package, including release of the Government’s
Connecting NZ document, a new Wellington Regional Land Transport Strategy 2010 to 2040 (which includes
updates to the Western and Hutt Corridor Plans), a new Manawatu-Wanganui Regional Land Transport Strategy
2010 to 2040, and a new Wellington Regional Policy Statement becoming operative. Wellington Airport
updated its Master Plan in 2010 (forecasting a doubling of passenger numbers by 2030). The Wellington
Regional Hospital and CentrePort (Ports of Wellington) are also forecasting an increase to their operations,
which will increase pressure on the transport network, including the existing SH1.
Given the progress noted above and other associated changes, the Transport Agency felt it was appropriate to
update the 2009 Business Case.
1
The WNC Network Plan is not a published document. It is a document that evolves as details of the various sections of the WNC are confirmed.
NZ Transport Agency Wellington Northern Corridor: Business case: 2013 addendumPage 6
Highlights of the 2009 Business Case
A brief recap of the key highlights of the 2009 Business Case is as follows:
• An estimated overall WNC programme cost of $2.1 to $2.4b, or $2.4 to $2.7b in 2012 dollars,
• The standard conventional BCR was 1.1 (which included agglomeration benefits). The BCR for the WNC
programme package (ie WNC programme plus the Petone to Grenada Link Road) was 1.2,
• Various BCR sensitivity tests (eg 4% and 6% discount rates over a 30-year evaluation period, WEBs (now
WEIs), high growth scenario, capping benefits at 2026, cost increase for the Ōtaki to Levin section and longer
programme rollout) resulted in the programme BCR ranging from 1.0 to 1.8,
• Agglomeration benefits would realise $195m PV, or $240m PV in 2012 dollars,
• “other” WEIs (based on additional employment of 650 new jobs only) would realise $331m PV, or $415m PV
in 2012 dollars. The WNC programme BCR increased to 1.4 with the inclusion of “other” WEIs,
• Total economic benefits (including other WEIs) is expected to be $1.95b PV (over a 30-year evaluation
period),
• Identification of key regional strategies and plans supporting the strategic context for the WNC programme,
such as the regional land transport strategy,
• The Ōtaki to Levin section was envisaged as a four-lane expressway,
• The benefits for the Terrace Tunnel section of the programme also included the transport disbenefits from
reducing the number of traffic lanes along the Wellington waterfront in order to support Wellington City’s
plans to improve the amenity of the waterfront,
• Investigation funding applications already approved for Basin Reserve Improvements and Transmission Gully,
and
• Achieving journey time savings between Wellington Airport and Levin of 34 minutes (southbound) during
the AM peak and 30 minutes (northbound) in the PM peak.
Key assumptions underpinning the 2009 Business Case programme costs and BCRs included: a primary 8%
2
discount rate, a 30-year evaluation period for assessing benefits ; the key model years were 2016 and 2026;
time zero was 1 July 2009; all costs and benefits were discounted back to 2009 dollars; use of fixed vehicle trip
3
matrix modelling ; and start and completion dates for each section were based on the “P7 indicative
programme”.
In addition, agglomeration benefits were based on the “Wellington urban” sections of the WNC programme only,
and the “other” WEIs were limited to just additional labour demand effects (ie the benefits from each new “GDP
per worker” generated by the programme).
4
The funding assessment profile for the WNC programme was identified as a “High” for strategic fit, “High” for
effectiveness and “Low” for efficiency.
2
The evaluation period ended when the last staged project completed its 30 year analysis period.
3
Fixed trip matrix modelling does not allow for induced trips and therefore understates the benefits.
4
The funding assessment profile is the basis for comparison and prioritisation with other activities nationally. In general, activities with higher rating funding
assessment profiles will be considered ahead of those with lower profiles for inclusion in the NLTP and for Transport Agency investment.
NZ Transport Agency Wellington Northern Corridor: Business case: 2013 addendumPage 7
Key highlights of the 2013 Business Case Addendum
The key findings of the 2013 Business Case Addendum are as follows:
• The overall expected WNC programme cost is $2.6b in 2012 dollars (excluding sunk costs). Previously, the
expected programme cost was $2.4 to $2.7b in 2012 dollars,
5
• The BCR without WEIs for the WNC programme is 1.6 ,
• Various sensitivity tests (ie including the Petone to Grenada Link Road, allowance for the underestimate of
benefits due to using fixed trip matrices, adding WEIs, high and low cost estimates, 4%, 6%, 8% discount
rates and 30-year, 40-year and 60-year evaluation period, capping benefits, and different assumptions for
regional growth). These BCRs range from 1.1 to 2.8,
• Agglomeration benefits for the WNC programme of $410m PV,
• Agglomeration benefits for the WNC programme package of $740m PV,
• “Other” WEIs (ie imperfect competition and labour supply and demand benefits) are likely to realise $395m
PV. The programme BCR increases to 1.8 with the inclusion of “other” WEIs (this excludes the benefits of the
Petone to Grenada Link Road),
• Total economic benefits expected to be generated by the WNC programme (including “other” WEIs) is
expected to be $3.4b (over a 40-year evaluation period),
• Identification of recently approved regional strategies and plans supporting development WNC programme,
such as the Wellington Regional Land Transport Strategy 2010-40 (including the Western and Hutt Corridor
plans), the Wellington Regional Policy Statement and the Wellington Airport Master Plan 2010-30, and
• Approved construction funding applications for the Tunnel to Tunnel, MacKays to Peka Peka, Transmission
Gully (as a public private partnership) and the first stage of the Aotea Quay to Ngauranga sections.
Key assumptions underpinning the programme costs and BCRs identified in this Addendum include: a primary
discount rate of 6%; a 40-year evaluation period for cost-benefit analysis; the key model years of 2021 and 2031;
time zero was 1 July 2012; all costs and benefits discounted to 2012 dollars; the geographical area for calculating
agglomeration benefits extended to Ōtaki, benefits of “other” WEIs have been calculated for imperfect
competition and labour supply benefits; the benefits for the Terrace Tunnel section excludes the “transport
disbenefits” of reducing the Wellington waterfront’s road capacity for community amenity purposes; and some
section construction start dates have been revised.
By developing this Addendum, further information on the likely outcomes from implementing the WNC
programme package has been identified, including:
• Increased permanent employment of between 865 (based on the increased accessibility provided by the
programme under normal economic conditions) and 3,700 (under stimulated conditions),
• Over 8,000 construction jobs are required to deliver the programme, peaking at 1,000 concurrent jobs in
2018,
• In the first five-year period after the programme is in place, the number of fatal and serious crashes will have
reduced from 142 to 102,
• Journey time savings between Wellington Airport and Levin of 39 minutes (southbound) during the AM peak
and 41 minutes (northbound) in the PM peak, and
• Up to 31km of new walking and cycling facilities will be created once the WNC programme is completed
(more facilities may be identified once the investigations for the Ōtaki to Levin section have been fully
completed).
5
The BCR has been calculated in accordance with the recent changes to the Economic Evaluation Manual (eg 6% discount rate and 40 year evaluation period).
NZ Transport Agency Wellington Northern Corridor: Business case: 2013 addendumPage 8 The funding assessment profile for the WNC programme remains the same as identified in the 2009 Business Case – that is, “High” for strategic fit, “High” for effectiveness and “Low” for efficiency. NZ Transport Agency Wellington Northern Corridor: Business case: 2013 addendum
Page 9

    1        Background
This Chapter sets out the background to this Addendum to the 2009 Business Case and current progress on the
programme.

1.1      Purpose
The purpose of this Addendum is to provide a progress update on the Wellington Northern Corridor programme,
which was approved by the Transport Agency’s Board on 26 November 2009.
A detailed business case was developed in 2009 to support the (Transport Agency’s) Highway and Network
Operations Group’s $386.2m funding request for the investigation, design and property purchase phases for the
WNC programme.
Since the 2009 Business Case was approved, HNO has made significant progress on the rollout of the WNC
programme. This Addendum documents this progress as well as providing further information on the likely
outcomes that will result from the programme’s implementation.
The key findings of this Addendum will be used to inform and/or support future construction funding requests in
the current National Land Transport Programme 2012-15.

1.2      Key highlights of the 2009 Business Case
A brief recap of the key highlights of the 2009 Business Case is as follows:
•   An overall WNC programme cost of $2.1 to $2.4b, or $2.4 to $2.7b in 2012 dollars,
•   The standard conventional BCR was 1.1 (which includes agglomeration benefits). The BCR for the WNC
    programme package (ie WNC programme plus the Petone to Grenada Link Road) was 1.2,
•   Various Benefit Cost Ratio sensitivity tests (eg 4% and 6% discount rates over a 30-year evaluation periods,
    WEBs (now WEIs), high growth scenario, capping benefits at 2026, cost increase for the Ōtaki to Levin
    section and longer programme rollout) resulted in the programme BCR ranging from 1.0 to 1.8,
•   Agglomeration benefits would realise $195m PV, or $240m PV in 2012 dollars,
•   “other” WEIs (based on additional employment of 650 new jobs only) would realise $331m PV, or $415m PV
    in 2012 dollars. The WNC programme BCR increased to 1.4 with the inclusion of “other” WEIs,
•   Total economic benefits (including other WEIs) was expected to be $1.95b (ie over a 30-year evaluation
    period),
•   Identification of key regional strategies and plans supporting the strategic context for the WNC programme,
    such as the regional land transport strategy,
•   The Ōtaki to Levin section was envisaged as a four-lane expressway,
•   The benefits for the Terrace Tunnel section of the programme also included the transport disbenefits from
    reducing the number of traffic lanes along the Wellington waterfront in order to support Wellington City’s
    plans to improve the amenity of the waterfront,
•   Investigation funding applications already approved for Basin Reserve Improvements and Transmission Gully,
    and
•   Achieving journey time savings between the Wellington Airport and Levin of 34 minutes (southbound)
    during the AM peak and 30 minutes (northbound) in the PM peak.

NZ Transport Agency Wellington Northern Corridor: Business case: 2013 addendum
Page 10
Key assumptions underpinning the 2009 Business Case programme costs and BCRs included: a primary 8%
6
discount rate, a 30-year evaluation period for evaluating benefits ; the key model years were 2016 and 2026;
time zero was 1 July 2009; all costs and benefits were discounted to 2009 dollars; use of fixed vehicle trip matrix
7
modelling ; and start and completion dates for each section were based on the “P7 indicative programme”.
In addition, agglomeration benefits were based on the “Wellington urban” sections of the WNC programme only,
and the “other” WEIs were limited to additional labour demand effects (ie the benefits from each new “GDP per
worker” generated by the programme).
8
The funding assessment profile for the WNC programme was identified as a “High” for strategic fit, “High” for
effectiveness and “Low” for efficiency.
1.3 Key progress made on the WNC Programme
The key progress made on the WNC programme since 2009 includes:
• Construction funding approved and construction commenced for the MacKays to Peka Peka section, the
Tunnel to Tunnel section and the first stage of the Aotea Quay to Ngauranga section. Construction funding
also approved for the Transmission Gully section and the procurement of a public private partnership
consortium for Transmission Gully is currently underway,
• Scheme assessments for six of the eight sections completed, which improves HNO’s understanding of the
likely costs and benefits for each completed section,
• RMA approvals for the Transmission Gully and MacKays to Peka Peka sections obtained, which further
improves confidence of the likely costs for these combined sections that together account for approximately
half of the expected costs for the programme,
9
• Development of the WNC Network Plan which includes the wider package of improvements needed to
make the Wellington Northern Corridor effective. One of these improvements is the Petone to Grenada Link
Road, the preferred option for the section of SH1 between Ngauranga and Linden. A decision as to whether
the Petone to Grenada Link Road will be a state highway or a local road has yet to be made, and
• Detailed project feasibility reports completed for each project within the Ōtaki to Levin section, which
increases HNO’s confidence in the costs and benefits of this section.
Since 2009 there have been some notable changes to the strategic national/regional/local transport
policy/planning context that recognises the WNC programme package, including release of the Government’s
Connecting NZ document, a new Wellington Regional Land Transport Strategy 2010 to 2040 (which includes
updates to the Western and Hutt Corridor Plans), a new Manawatu-Wanganui Regional Land Transport Strategy
2010 to 2040, and a new Wellington Regional Policy Statement becoming operative. Wellington Airport also
updated its Master Plan in 2010 (forecasting a doubling of passenger numbers by 2030). The Wellington
Regional Hospital and CentrePort (Ports of Wellington) are also forecasting an increase to their operations,
which will increase pressure on the transport network, including the existing SH1.
6
The evaluation period ended when the last staged project completed its 30 year analysis period.
7
Fixed trip matrix modelling does not allow for induced trips and therefore understates the benefits.
8
The funding assessment profile is the basis for comparison and prioritisation with other activities nationally. In general, activities with higher rating funding
assessment profiles will be considered ahead of those with lower profiles for inclusion in the NLTP and for Transport Agency investment.
9
The WNC Network Plan is not a published document. It is a document that evolves as details of the various sections of the WNC are confirmed.
NZ Transport Agency Wellington Northern Corridor: Business case: 2013 addendumPage 11
1.4 WNC Programme progress
A summary of the progress made towards delivering the various phases of each section within the programme is
shown below.
Table 1-1: Summary of programme progress
Investigation Design Construction
Airport to Mount Victoria Tunnel Underway
Tunnel to Tunnel (eg Basin bridge, Completed Underway Underway
Buckle St underpass, ICB
improvements)
Terrace Tunnel Underway
Aotea Quay to Ngauranga Gorge Completed (parts of) Underway Completed (parts of)
Ngauranga to Linden (Petone to Underway
Grenada Link Road)*
Linden to MacKays Completed Procurement Procurement
underway underway
MacKays to Peka Peka Completed Completed Underway
Peka Peka to North of Ōtaki Underway Procurement
underway
North of Ōtaki to Levin Underway
*Progress on the Ngauranga to Linden section of SH1 refers to the Investigation and Reporting phase for the
Petone to Grenada Link Road, which commenced in March 2013.
NZ Transport Agency Wellington Northern Corridor: Business case: 2013 addendumPage 12
2 Methodology for development of the 2013
Business Case Addendum
This Chapter sets out the methodology employed and the components required to develop this Addendum, and the key
assumptions made during this development.
2.1 Methodology overview
The general approach to preparation of this Addendum has been to provide an update on each section of the
2009 Business Case where relevant and/or required. For ease of reading, and in particular for cross referencing
purposes, it generally follows the format of the 2009 Business Case.
This Addendum development has been overseen by a joint project steering group consisting of key HNO and P&I
officers from both the Wellington Regional and National Offices. The key purpose of this group was to agree on
the key assumptions underpinning programme costs and the BCRs, to provide technical feedback on the
10 11
independent analyses summarised in the Opus Report (Appendix A) and Richard Paling Report (Appendix B)
and to oversee the finalisation of this Addendum.
The Opus and Richard Paling reports are key background documents used in calculating the updated costs and
BCRs for the WNC programme as identified in this Addendum. For consistency purposes, both Opus and
Richard Paling were commissioned in late 2012 to update their 2009 estimates of CEBs and WEIs, which had
12
been identified in the 2009 Business Case. In addition, Opus has also developed REMAT , which is a tool that
has helped to forecast programme costs and benefits.
Beca Consultants and National Office P&I and SCP have undertaken peer reviews of both the Opus and Richard
Paling reports, as was done for the 2009 Business Case.
This Addendum’s key findings were approved by the HNO VAC and NLTP AG on 6 June 2013 and 28 August
2013 respectively.
2.2 Opus Report and REMAT
The purpose of the Opus Report (Appendix A) is to provide economic summaries for each section of the WNC
programme package, update the REMAT with the most updated programme, assess the total economic
efficiency of the WNC programme using REMAT, and undertake sensitivity analysis of the WNC programme.
The report identifies the information sources for the benefits and costs for each section within the programme.
All of the project specific transport models were updated in order to be consistent with Greater Wellington
Regional Council’s Wellington Transport Strategic Model. WTSM was updated in late 2012 with the latest land
use and population data as its previous baseline date was 2006. In addition, a weekend project model has been
developed to more accurately assess the benefits likely to be generated by the Wellington urban sections of the
WNC programme during the weekend.
10
Opus International Consultants, “Wellington Northern Corridor RoNS - RoNS Business Case Economic Update 2013”, August 2013.
11
Richard Paling Consultants, “Assessment of Wider Economic Benefits for the Wellington Northern Corridor RoNS 2013”, August 2013.
12
RoNS Economics Modelling and Assessment Tool.
NZ Transport Agency Wellington Northern Corridor: Business case: 2013 addendumYou can also read