Can Elite Australian Football Player's Game Performance Be Predicted?
←
→
Page content transcription
If your browser does not render page correctly, please read the page content below
International Journal of Computer Science in Sport
                                             Volume 20, Issue 1, 2021
                                Journal homepage: http://iacss.org/index.php?id=30

                                          DOI: 10.2478/ijcss-2021-0004

           Can Elite Australian Football Player’s Game
                   Performance Be Predicted?
          Fahey-Gilmour, J. 1, 2, Heasman, J.2, Rogalski, B.2, Dawson, B.1, Peeling, P.1, 3
  1
      School of Human Sciences (Exercise and Sport Science), University of Western Australia,
                                        Perth, Australia
                          2
                              West Coast Eagles Football Club, Perth, Australia
                      3
                          Western Australian Institute of Sport, Perth, Australia

         Abstract
         In elite Australian football (AF) many studies have investigated individual player
         performance using a variety of outcomes (e.g. team selection, game running, game
         rating etc.), however, none have attempted to predict a player’s performance using
         combinations of pre-game factors. Therefore, our aim was to investigate the ability
         of commonly reported individual player and team characteristics to predict
         individual Australian Football League (AFL) player performance, as measured
         through the official AFL player rating (AFLPR) (Champion Data). A total of 158
         variables were derived for players (n = 64) from one AFL team using data collected
         during the 2014-2019 AFL seasons. Various machine learning models were trained
         (cross-validation) on the 2014-2018 seasons, with the 2019 season used as an
         independent test set. Model performance, assessed using root mean square error
         (RMSE), varied (4.69-5.03 test set RMSE) but was generally poor when compared
         to a singular variable prediction (AFLPR pre-game rating: 4.72 test set RMSE).
         Variation in model performance (range RMSE: 0.14 excusing worst model) was
         low, indicating different approaches produced similar results, however, glmnet
         models were marginally superior (4.69 RMSE test set). This research highlights the
         limited utility of currently collected pre-game variables to predict week-to-week
         game performance more accurately than simple singular variable baseline models.

 KEYWORDS: PLAYER RATING, AUSTRALIAN FOOTBALL LEAGUE, MACHINE
 LEARNING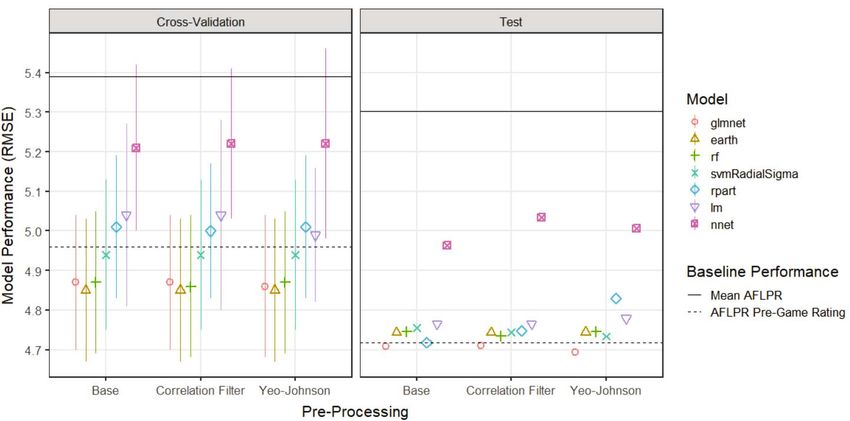
IJCSS – Volume 20/2021/Issue 1                                                       www.iacss.org

Introduction
In elite sport, vast resources are allocated to improving individual player and team performance.
In the Australian Football League (AFL), coaches, analysts, strength and conditioning experts,
sport scientists, psychologists, doctors and physiotherapists are just some of the club staff
commonly used to improve player performance. Consequently, there are varied opinions on what
practices may optimize an individual’s match performance, which has resulted in a multitude of
research initiatives attempting to explore these prospects. Commonly, studies into elite
Australian football (AF) have focused on variables thought to associate with team selection, the
likelihood of being drafted, or match running distances and speeds, rather than actual match
performance (Gastin, Fahrner, Meyer, Robinson, & Cook, 2013). Consequently, there is scope
to expand our knowledge and investigation of individual player match performance factors in
the AFL.
Previous literature has attempted to use individual characteristics and physical preparation data
to assess the relationship with individual player match performance (e.g. game ratings) (Gastin
et al., 2013; Lazarus et al., 2017; Ryan et al., 2018). For example, Gastin et al. (2013) found that
training load in the weekly main training session prior to games had a negligible association (r 2
= 3.2%) with individual game performance, while individual player characteristics (e.g. age,
aerobic capacity) had a stronger association (r2 = 45.3%). Further, Lazarus et al. (2017) showed
that match performance was best when the global training load was near the mean or ~1 standard
deviation (SD) below the individual player’s norm. Lastly, in completing a comprehensive study
of individual performance and pre-game variables using player workload, pre-season
completion, individual well-being and aerobic fitness data, Ryan et al. (2018) concluded that the
monitoring of physical preparation data provide weak associations with individual game
performance measures. Collectively, these studies show mixed evidence as to the association
between physical preparation factors and player characteristics and their relationship with
subsequent game performance at an individual level.
While these studies contribute to our current knowledge of factors relating to individual game
performance, they nevertheless suffer from common limitations that may restrict their ability to
completely represent the factors impacting player performance. These limitations include a low
sample size (e.g. one season) (Ryan et al., 2018), different methods of player performance
quantification (e.g. coach rating, confidential derived formula, various objective ratings),
reliance on linear models, confining research to association based approaches where
generalizability is not assessed on held-out data, and lastly, not combining individual factors
with team level variables (e.g. opposition quality, fixture [days turn around, home/away]) which
are likely to impact individual performance. Therefore, our aims were to build upon the existing
literature by using a multifactorial approach, in a prediction framework, where multiple seasons
of consistently collected individual player characteristics, individual training monitoring data,
and team level factors, are used to predict individual player game performance.

                                                                                               56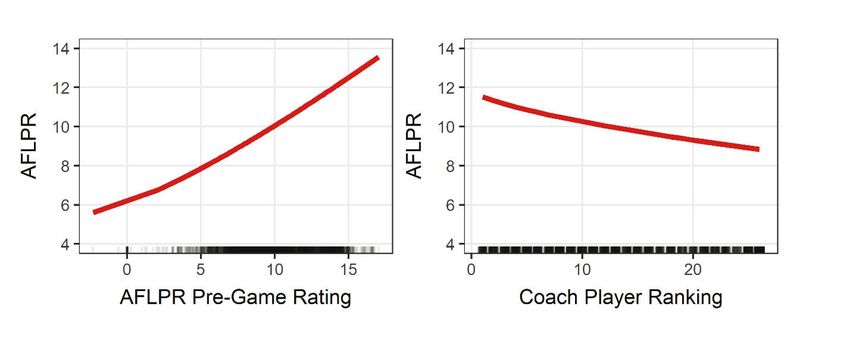
IJCSS – Volume 20/2021/Issue 1                                                    www.iacss.org

Methods

Participants
Elite AF players (n = 64) from one club who were listed at any point during 2014-2019 were
included in our analysis, with player performance observations restricted to competitive AFL
games. Ethical approval for this study was obtained from the Human Research Ethics Committee
of The University of Western Australia.

Performance quantification
The official AFL player rating (AFLPR) produced by Champion Data (Champion Data Pty Ltd.,
Melbourne, Australia) was used as the sole game performance rating measure. This metric has
previously been used in elite Australian football research (Fahey-Gilmour, Dawson, Peeling,
Heasman, & Rogalski, 2019; McIntosh, Kovalchik, & Robertson, 2019; Ryan et al., 2018) while
also being established as valid and reliable (Robertson, Gupta, & McIntosh, 2016). The AFLPR
is objectively calculated on the basis of changes in ‘field equity’ (Jackson, 2016; McIntosh et
al., 2019). Field equity accounts for the contribution of a player’s involvement in the play with
reference to a series of contextual factors (e.g. location on the ground, pressure under/applied)
and whether the player's action then results in an increase or decrease in the team’s expected
chance of scoring (Jackson, 2016). This measure provides greater context to game involvements,
potentially providing a better indication of a player’s influence on the game than alternative
statistical indicators (McIntosh et al., 2019). For a full description and detailed method of
AFLPR calculation please see Jackson (2016).

Predictor variables
In total 158 different predictor variables (including derivatives) were included in this study. A
complete list of these variables is presented in a series of tables (Table 1).

Player and team derived game specific variables
Various measures were created using the AFLPR performance measure described here. Further,
metrics pertaining to cohesion, experience, continuity and availability are also included. These
measures are outlined in Table 1a.

Anthropometry and physical capacities
Player anthropometric characteristics (height, mass, sum of 7 skinfolds) were measured each
season by the clubs accredited sports nutritionist. Players aerobic and strength capacities were
only tested in the pre-season phase, which is appropriate on the basis of prior associations
between this training period and in-season performance in elite AF players (Gastin et al., 2013;
Mooney et al., 2011; Stares, Dawson, Heasman, & Rogalski, 2015). All anthropometry and
physical capacity variables are outlined in Table 1b.

                                                                                            57
IJCSS – Volume 20/2021/Issue 1                                                                         www.iacss.org

Table 1a: Player and team game derived variable description
Variable type: C = Categorical, N = Numeric; AFL = Australian Football League; AFLPR = Official AFL player rating; Elo
= Name of rating system.
          Overall                              Variable
                            Sub Category                   Description
       Category(s)                             Type
                 Game                                      General Defender, Key Defender, Midfielder, Ruck,
 Position                   -                  C
                 Day                                       General Forward, Key Forward.
 Game Time       -          -                  N           Cumulative season average player game time.
                            Last Four Rounds N             Rolling average of last four rounds AFLPR.
 Player          Form
                            Season             N           Cumulative season average AFLPR.
 Game
                 Previous                                  Previous seasons AFLPR average. Players that did not play
 Performance                -                  N
                 Season                                    a game are rated as 0.
                                                           Player pre-game rating based on average AFLPR
                            AFLPR Pre-
                                               N           performance over the last 40 games or two years (whichever
                 Player     Game Rating
                                                           comes first), not including the forthcoming game.
                 Rating
                                                           Average of players pre-game player rating that are in the
                 (AFLPR AFLPR
                                                           same line group. Also expressed as a differential with the
                 Derived) Positional Pre-      N
                                                           opposition with respect to lines; Forwards-Backs,
                            Game Rating
                                                           Midfielders-Midfielders, Backs-Forwards.
                                                           Internal rating of players from 1-25 (#1 = most important).
 Quality
                                                           All players outside of the 25 were considered as the 26th.
                 Player
                            Coaches Ranking N              Ratings were determined prior to in-season games by the
                 Ranking
                                                           club match committee (e.g. coaches) and updated at the
                                                           mid-point of the season.
                                                           Ladder rank of team prior to the game (& differential with
                            Ladder Position    N
                                                           opposition).
                                                           Elo rating (& differential with opposition). Calculation
                 Team       Elo Rating         N
                                                           method aligns with Fahey-Gilmour et al. (2019).
                            Player Based                   The team sum of players AFLPR Pre-Game Rating (&
                                               N
                            Rating                         differential with opposition).
                                                           Mean pairwise games that the player shares with all players
                            Team               N
                                                           on the same team.
                 Player                                    Mean pairwise games that the player shares with other
                            Position           N           players in the same positional line (i.e. Forward, Midfield
 Cohesion
                                                           and Backline) on the same team.
                                                           Mean of pairwise games that each player shares with
                 Team       -                  N           another player on the same team (& differential with
                                                           opposition).
                            Total AFL                      Cumulative count of AFL games played in a player’s
                                               N
                            Games                          career.
                                                           Number of games played in the previous year. Expressed in
                            Previous Season
                                               N           two ways; total games played at any level (AFL, second
                 Player     AFL Games
                                                           tier/Under 18 etc.) and just AFL games.
                            Ground AFL                     Cumulative count of career AFL games played at the venue
 Experience                                    N
                            Games                          prior to the game.
                            Year Group         N           Number of years on an AFL list.
                            AFL Games          N           Mean AFL games experience.
                            Ground AFL
                 Team                          N           Mean games experience at the venue played.
                            Games
                            Year Group         N           Mean number of years on AFL list.
 Player
                 Games      -                  N           Number of games played in the last four rounds.
 Continuity
                                                           Number of top 10 and 22 players playing according to
 Availability    Team       Top 10 & 22        N
                                                           AFLPR Pre-Game Rating (& differential with opposition).

                                                                                                                  58
IJCSS – Volume 20/2021/Issue 1 www.iacss.org
Table 1b: Anthropometry and physical capacity variable description
Variable type: C = Categorical, N = Numeric; RM = Repetition Maximum.
Overall Sub Variable
Description
Category(s) Category Type
Height - N Height (cm) measured in pre-season.
Weight - N Weight (kg) measured at the beginning of the round.
Sum of seven skinfolds (mm) as measured by club dietician
Sum N
every two-three weeks.
Anthropometry
Flag (Yes/No) for skinfold reading out of custom skinfold
Range C
range, either above or below, as specified by club dietician.
Skinfolds Change N Percentage change from previous reading.
Rolling
C Flag (Yes/No) for consecutive out of range readings.
Range
Flag (Yes/No) for two consecutive 10% decrements or
Trend C
increments in skinfold reading.
Aerobic
2 Kilometer Pre- Season most recent pre-season 2km time trial result (time in
N
Time Trial Season seconds). Time trial completed on an athletics track.
1RM Bench Season most recent pre-season result in absolute (bench
N
Press press and chin ups: max weight lifted [kg], IMTP: peak
3RM Chin force [N]) and relative terms (absolute measure/body
Strength
Pre- N
Ups weight). Testing protocols were conducted in accordance
Season
Isometric with previous research; 1RM bench press (Stares et al.,
Mid-Thigh N 2015), 3RM chin ups (Young et al., 2005) and IMTP
Pull (IMTP) (Stares et al., 2015).
Injury and illness history
Injuries/illness were classified by the club’s senior physiotherapist, collated, and then uploaded
to the club’s database. Injury/illness severity was classified as low (player given modified
training and did not miss a game); moderate (player missed 1–2 games or 1-2 weeks missed
training); or high (player missed >2 games or >2 weeks missed training). Injuries/illness were
further categorized by type (injury: non-contact/contact/unknown, illness: medical) and body
site (upper body/lower body). A series of variables pertaining to player preparation, season toll
and return to play were subsequently defined. These are outlined in Table 1c.
Player load and intensity monitoring
“External” (e.g. distance) workloads were quantified using global positioning systems (GPS)
units worn by all players. Where possible, players wore the same GPS unit in each session. In
the 2014-2016 seasons, SPI Pro X (GPSports, Canberra, Australia) units sampling at 5 Hz were
used. During the 2017-2019 seasons Catapult OptimEye S5 units were used with a sampling rate
of 10 Hz.
Training and match workload was defined using both previously validated objective GPS
(Waldron, Worsfold, Twist, & Lamb, 2011) and subjective rating of perceived exertion (RPE)
(Impellizzeri, Rampinini, Coutts, Sassi, & Marcora, 2004) measures. Distance was defined as
total distance covered (m), including walking, running and sprinting. ‘Sprint distance’ and ‘Max
speed exposure’ were defined as distance covered (m) above 75% of individual player maximum
speed and yes/no as to whether a player achieved or exceeded 85% of their max speed
(determined from GPS game data). These commonly used GPS metrics (Colby, Dawson,
59IJCSS – Volume 20/2021/Issue 1 www.iacss.org
Heasman, Rogalski, & Gabbett, 2014; Colby et al., 2018; Windt, Gabbett, Ferris, & Khan, 2017)
were chosen to represent aspects of total and high intensity running volumes within AF demands;
other metrics (i.e. additional velocity thresholds, acceleration, deceleration) were not considered
due to varying definitions, validation concerns (Malone, Lovell, Varley, & Coutts, 2017) and
the change of units between seasons.
Table 1c: Injury and illness variable description
Variable type: C = Categorical, N = Numeric; Injury/Illness Categories: Any, Moderate-High Non-Contact,
Moderate-High, Any Lower Body, Non-Contact Lower Body.
Variable
Category Sub Category Description
Type
Injuries/Illness
Number of injuries/illnesses that occurred prior to the in-
prior to the N
season phase: Injury/Illness Categories.
season
Off-Season
C Player had off-season surgery (Yes/No).
Surgery
Off-Season Moderate-High severity injury/illness sustained in the off-
C
Injury/Illness season phase (Yes/No).
Preparation
Yes/No based on interruption to preparation phase (pre-
season/off-season). If player sustained any of the following;
off-season surgery, off-season or pre-season moderate-high
Interrupted
C injury/illness or carried a moderate-high injury/illness into
Preparation
the off-season phase from the previous season (i.e. was
injured in the previous season and did not play again in that
season).
Cumulative count of injuries/illness across the season:
Season Toll - N
Injury/Illness Categories.
RTP rounds based on games played after returning from a
Return to
- C moderate-high severity injury/illness. (RTP1, RTP2, RTP3,
Play (RTP)
RTP4 & No RTP Window).
“Internal” workload was quantified using the “on-legs sRPE” method (Colby et al., 2017;
Impellizzeri et al., 2004; Rogalski, Dawson, Heasman, & Gabbett, 2013). The “on-legs” sessions
were defined as any on-field running session where players wore a GPS unit. Resistance training,
power testing and other off-field activities (e.g. swimming, cross-training) were collected
intermittently and were therefore not included in our analysis.
Workload data were categorized into round blocks (typically Monday to Sunday) throughout
each season. These were adjusted where necessary for players where competition games fell one
day outside of the typical Monday-Sunday block to ensure only one game per player occurred
within a round. Using this structure, workload variables commonly used (e.g. acute load, chronic
load) were derived and stated at the beginning of the round block. In addition to these fixed
variables, dynamic variables pertaining to the prescription of training and overall load
throughout the round (prior to the game) were also included. In each training session, drills were
categorized according to their purpose (e.g. training, conditioning, rehabilitation, warm up);
while all content was used for load monitoring, variables specifically pertaining to only the
training/skill drills were also defined. All load monitoring and intensity measures are outlined
in Table 1d.
60IJCSS – Volume 20/2021/Issue 1 www.iacss.org
Table 1d: Load and intensity monitoring variables description
Variable type: C = Categorical, N = Numeric; ACWR = Acute:Chronic Workload Ratio; Base Load Variables:
Distance, Sprint Distance, Maximum Speed Exposure (85%) and On-Legs Load.
Variable
Category Sub Category Description
Type
Acute Round Load Absolute load in the previous round: Base Load
N
(Start of Round) Variables.
Chronic Round
Average acute load over the last four rounds: Base
Acute, Chronic, Load (Start of N
Load Variables.
ACWR & Round)
Change Round ACWR Acute load divided by Chronic load: Base Load
N
(Start of Round) Variables.
Change (Start of Percent change from acute load two rounds to one
N
Round) round prior: Base Load Variables.
Expected load ceiling set to the 95th percentile of
Acute Round Load player acute round load where player was not injured
N
Ceiling in the current or subsequent week and occurred
Load Ceiling within the last two years in-season.
Exceed Acute
Player exceeded their acute round load ceiling in the
Round Load Ceiling C
previous round: Base Load Variables.
(Start of Round)
Number of minutes played during pre-season games
Game Minutes N
Pre-Season prior to the in-season phase.
Preparation Pre-Season (Post- Volume of load in the post-Christmas phase (approx.
N
Christmas) January-March): Base Load Variables.
Intensity (absolute value/game time) from previous
Absolute Intensity
N rounds game: Game Distance (m/min), Game Sprint
(Start of Round)
Distance (m/min).
Chronic Round Average absolute game intensity over the last four
Game Intensity Intensity (Start of N rounds: Game Distance (m/min), Game Sprint
Round) Distance (m/min).
Intensity Relative to Absolute intensity relative to in-season average:
Average (Start of N Game Distance (m/min), Game Sprint Distance
Round) (m/min).
Sum of player load over the round: Base Load
Absolute Load N
Load Prior To Variables.
Game Load Relative to Absolute load relative to the average player load in
N
Fixture the days break category: Base Load Variables.
Intensity of training drills: Distance (m/min) and
Sprint Distance (m/min). Expressed as an absolute
Absolute Intensity N
value and relative to mean in days break fixture
Last Training category.
Total load of training drills: Distance and Sprint
Absolute Load N Distance. Expressed as absolute value and relative to
mean in days break fixture category.
61IJCSS – Volume 20/2021/Issue 1 www.iacss.org
Wellness and musculoskeletal screening
Subjective player wellness and musculoskeletal screening was collected to supplement player
workload data. Specific to player wellness, customized questionnaires were completed on the
first day of each round and prior to the rounds main training session. Ratings of fatigue, sleep
quality, muscle soreness, stress levels, mood and perceived performance on five-point Likert
scales, ranging from 1 (as bad as possible) to 5 (as good as possible) were recorded. Questions
were brief and in line with previous literature (Colby et al., 2017). All measures are outlined in
Table 1e.
Table 1e: Wellness and injury screening variable description
Variable type: C = Categorical, N = Numeric; Wellness Measures: Fatigue, Mood, Performance, Sleep,
Soreness, Stress and Wellness Score (sum of all wellness components).
Variable
Category Sub Category Description
Type
Wellness screening completed prior to the main training
Pre-Main session of the round: Wellness measures expressed as a z-
Wellness Ratings N&C
Training score and flag (Yes/No) if there is a 1SD change from
player’s cumulative season normal.
Wellness screening completed at the beginning of the round:
Wellness measures expressed as a z-score and flag (Yes/No)
Wellness Ratings N&C
if there is a 1SD change from players cumulative season
normal.
Yes/No responses to the following questions based on the
previous 7 days: ‘Have you experienced old lower limb
pain?’ (i.e., recurring pain from a previous lower limb injury
Start of Wellness in the past 12 months), “Have you completed heavy non-
C
Round Questions football activities? (i.e., moved house, gardening, painting
etc.)”, “Do you have any lower back pain that is new or
worse than last week?” and "Over the last week has your
running or kicking loads increased significantly?".
Sit and reach, ankle stiffness (left to right differential) and
Musculoskeletal adductor squeeze. Protocols in line with Colby et al. (2017).
N
screening Results expressed as a z-score and flag (Yes/No) if there is a
1SD change from players cumulative season normal.
Fixture characteristics
Each team’s fixture is largely known prior to the start of the AFL season, however, at an
individual player level it can be more varied, as players (for example) can miss games due to
injury/illness, not be selected for the senior team and play state league football. Therefore, in
this study, fixture variables, where possible, were referenced to the individual instead of the
team. An overview of fixture-based variables included are outline in Table 1f.
62IJCSS – Volume 20/2021/Issue 1 www.iacss.org
Table 1f: Fixture variable description
Variable type: C = Categorical, N = Numeric; AFL = Australian Football League.
Variable
Category Sub Category Description
Type
If team is coming off an AFL fixture bye. Includes pre-round
Bye C
1, regular and finals byes.
Time Period
Round Type C Regular or Finals game.
Round Number N The round for the season.
Count of days between games (absolute and categorical [IJCSS – Volume 20/2021/Issue 1 www.iacss.org
Models
Model training occurred in R (v3.5.2) with the caret package (Kuhn, 2017), given its ability to
provide an interface for hundreds of different statistical or machine learning (ML) models with
relative simplicity. Different regression approaches were chosen to predict player performance.
Each model (outlined below) is briefly described in Table 2, along with associated tuning
parameters:
x Linear model (lm)
x Linear model with elastic net regularization (glmnet)
x Neural network (nnet)
x Multivariate adaptive regression splines (earth)
x Support vector machine (svmradialsigma)
x Recursive partitioning and regression trees (rpart)
x Random forest (rf)
These models were chosen to provide a balance between: (1) simple and interpretable models
(e.g. lm, rpart) and more complex models that can model strong non-linear trends well (e.g. rf);
and (2), models with in-built feature selection (e.g. glmnet, earth) and those without (e.g.
svmRadialSigma, nnet).
Data pre-processing and exploratory data analysis
Due to the large number of variables collected and synthesized, significant exploratory data
analysis was completed. Graphical and statistical (e.g. Pearson correlation coefficients) modes
of analysis were used to guide removal of highly (r>0.9) collinear predictor variable sets, and to
identify missing data and outliers to aid in modeling attempts and interpretation.
As part of the modeling process, the same base level pre-processing (PP) techniques were
applied to the predictor variables training data sets for all models. Variable PP was specified
using the recipes package in R (Kuhn & Wickham, 2018), all default values were used for each
pre-processing function. Center and scaling (recipes function: step_normalize) were applied
given that some ML methodologies suffer from variable bias (Kuhn & Johnson, 2016). In
addition, near zero (step_zv) and zero variance (step_zv) filters were applied to remove non-
informative predictors (e.g. few unique values, the ratio between the most common value and
second most common is extreme) that have the ability to negatively impact certain models (Kuhn
& Johnson, 2016). Further, of the 2,489 player observations in the training data set, only 1019
had complete data. To avoid conducting analysis on only a subset of the data and losing valuable
information (Beretta & Santaniello, 2016), k-nearest neighbors imputation (step_knnimpute) was
implemented during model building to maximize the data set. In addition to the base level PP
method described here, two separate methods were implemented, 1) base and correlation filter
(step_corr) with a threshold of 0.8 to remove highly collinear variables and 2) base and Yeo-
Johnson (step_YeoJohnson) transformations to assist resolving skewness (Yeo & Johnson,
2000), with the potential for either method to increase the performance of each model.
64IJCSS – Volume 20/2021/Issue 1 www.iacss.org
Figure 1: Modelling Overview
Input Data
2014-2019 Seasons
Training Data Testing Data
(2014-2018 Seasons) (2019 Season)
Player Observations
Randomised into
Different Folds
5-Repeat, 10-fold Cross-
Data Pre-Processing Training-Validation
Validation with Pre-
& Parameter Tuning Process
Processing
Final Model for each
Algorithm
Pre-Processed Test
Final Models
Data
Performance Cross-Validation Training Data
Test Data Predictions
Outcomes (RMSE) Predictions Predictions
Best Model Selected Variable Importance
65IJCSS – Volume 20/2021/Issue 1 www.iacss.org
Table 2: Overview of each model with caret name and package implementation. Tuning parameters for each
model are also listed.
Caret Name Tuning Parameters
Model Description
(Package) (Caret Name)
A linear combination of
independent predictor variables
Linear regression (R
is used to create an equation lm (base) None
Core Team, 2018)
that best fits a continuous
response variable.
Fits a generalized linear model The elasticnet mixing
Generalized linear via penalized maximum parameter, with 0≤α≤
model with elastic likelihood. The regularization 1. Alpha =1 is lasso
net regularization path is computed for the lasso glmnet (glmnet) penalty, alpha = 0
(Friedman, Hastie, & or elasticnet penalty at a grid of ridge penalty (alpha)
Tibshirani, 2010) values for the regularization Regularization
parameter lambda. parameter (lambda)
A single hidden layer neural
network of connected artificial Weight decay (decay)
Neural network
neurons which transmit
(Venables & Ripley, nnet (nnet) Number of hidden
information and learn from
2002) units (size)
error associated with each
prediction.
Fits a series of hinge functions Maximum number of
to determine surrogate features terms in the pruned
Multivariate adaptive
from the original data set in a model (nprune)
regression splines earth (earth)
piecewise fashion. Combines
(Milborrow, 2018) Maximum degree of
these surrogate features in a
simple linear regression. interaction (degree)
Support vector
Creates a non-linear, Inverse kernel width
machine with radial
multidimensional hyperplane (sigma)
basis kernel svmRadialSigma
with a defined epsilon range
(Karatzoglou, Smola, (kernlab) Cost of constraints
that is insensitive to values
Hornik, & Zeileis, violation (C)
within it.
2004)
Partitions data into smaller
Recursive groups that are more
partitioning and homogenous with respect to the
Complexity parameter
regression trees response variable. This is rpart (rpart)
(cp)
(Therneau & created through recursive
Atkinson, 2018) feature elimination and results
in a basic decision tree.
An ensemble technique that Number of variables
Random forest (Liaw generates many decision trees randomly sampled as
rf (randomForest)
& Wiener, 2002) based on a random subset of candidates at each
predictors for each tree. split (mtry)
66IJCSS – Volume 20/2021/Issue 1 www.iacss.org
Model validation and parameter tuning
This study used 5-repeated 10-fold cross-validation. Cross-validation was completed by
randomizing each player-game observation into each of the ten folds. This training approach
was designed to estimate how well the model generalized to unseen data (James, Witten, Hastie,
& Tibshirani, 2013) and to tune model parameters (Kuhn, 2017). For AFLPR, models’ predictive
performance was assessed using root mean squared error (RMSE).
Each model’s tuning parameters (Table 2) were refined during the cross-validation process by
specifying a grid of values on which to train. The parameters providing the best combination for
highest cross-validation performance were chosen, and then used for training each model before
being deployed on the test set.
Performance outcomes, testing models and variable importance
Each trained model was evaluated on the 2019 season to provide a non-biased estimate of model
performance (Kuhn & Johnson, 2016). As another point of comparison, models were compared
against baseline prediction models using the AFLPR pre-game rating (Table 1a) and average
AFLPR for the time period as respective predictions for the forthcoming game.
Lastly, variable importance was derived from each model through the varImp function in caret
(Kuhn, 2017), followed then by the construction of accumulated local effects (ALE) plots for
important predictors using the iml package (Molnar, Bischl, & Casalicchio, 2018). The ALE
plots enable the interpretation of a model’s reliance on a predictor and how predictions can
change over the range of values relative to the average prediction. This allows for some practical
understanding of predictors in ‘black box’ ML techniques (Apley, 2016; Molnar, 2018).
Results
The mean (SD) of AFLPR in the training and test data were 10.01 (5.39) and 9.29 (5.31)
respectively.
Model performance
Figure 2 provides an overall summary of model performance on test and training data across the
different PP protocols. The glmnet model with Yeo-Johnson PP performed best (test RMSE:
4.69), with the glmnet models being the only ones to better the AFLPR pre-game rating baseline.
Additionally, overall model results showed very little variation on the test set RMSE (range
RMSE: 0.14), with the exception of nnet. Full test, cross-validation and training RMSE are
reported in Table 3.
67IJCSS – Volume 20/2021/Issue 1 www.iacss.org
Figure 2: Test and mean (±SD) cross-validation training root mean square error across different pre-processing
and modeling approaches. Various baseline performance measures are included for comparison
(horizontal lines).
Performance relative to baseline
Model performance on the cross-validation and test set consistently outperformed the naïve
(mean AFLPR) baseline; however, rarely was there an improvement on the pre-game rating
baseline. Only three models outperformed the AFLPR pre-game rating baseline on the test-set,
and only a marginal improvement was seen (RMSE < 0.05).
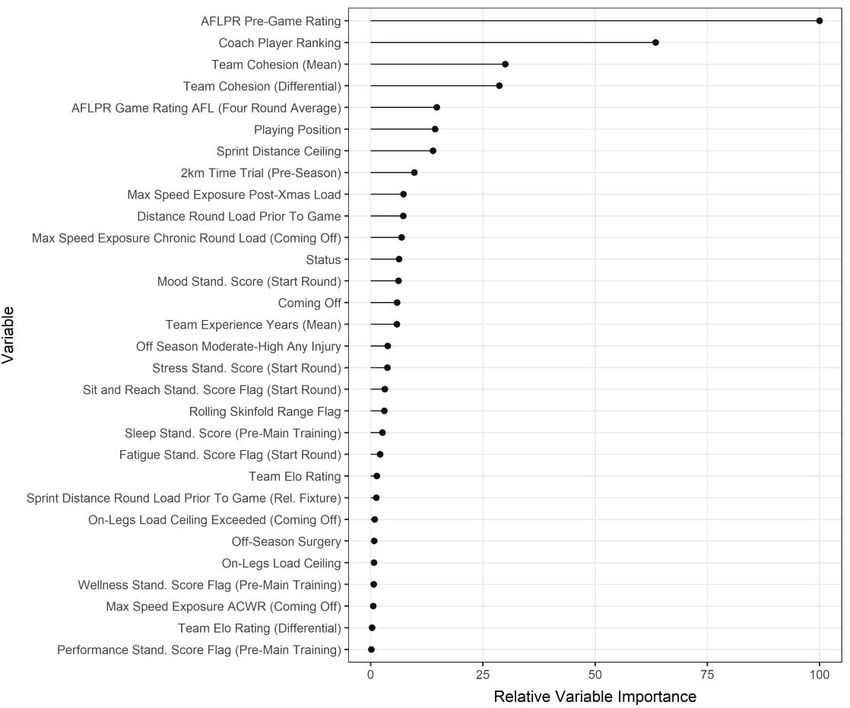
Variable importance
Figure 3 shows the relative importance of predictor variables in the best performing glmnet
model. Overall, 30 of the 158 variables were retained in the model. The highest-ranking
importance variables were the AFLPR pre-game rating and coach player ranking. This was a
similar trend in most models, where these two measures of player quality had a median rank
importance of one and two across the 21 models, respectively.
68IJCSS – Volume 20/2021/Issue 1 www.iacss.org
Table 3: Root mean squared error (RMSE) scores for each model and pre-processing technique across different
data set evaluations.
*= Best performing model, Models: earth = Multivariate Adaptive Regression Splines; lm = Linear Regression;
glmnet = Generalized Linear Model with Elastic Net Regularization; nnet = Neural Network; rf = Random Forrest;
rpart = Recursive Partitioning and Regression Trees; svmRadialSigma = Support Vector Machine with Radial
Basis Kernel, Pre-Processing Protocols: Base = Imputation, removal of near zero and zero variance variables and
centre and scaling; Correlation Filter = Base level pre-processing with correlation filter; Yeo-Johnson = Base level
pre-processing with Yeo-Johnson transformations, AFLPR = Official AFL player rating
RMSE
Model Pre-Processing Cross-Validation
Train Test
(Mean ± SD)
earth Base 4.85 ± 0.18 4.83 4.74
Correlation Filter 4.85 ± 0.18 4.83 4.74
Yeo-Johnson 4.85 ± 0.18 4.83 4.74
glmnet Base 4.87 ± 0.17 4.8 4.71
Correlation Filter 4.87 ± 0.17 4.8 4.71
Yeo-Johnson 4.86 ± 0.18 4.8 4.69*
lm Base 5.04 ± 0.23 4.65 4.77
Correlation Filter 5.04 ± 0.24 4.68 4.77
Yeo-Johnson 4.99 ± 0.17 4.65 4.78
nnet Base 5.21 ± 0.21 4.51 4.96
Correlation Filter 5.22 ± 0.19 4.34 5.03
Yeo-Johnson 5.22 ± 0.24 4.75 5.01
rf Base 4.87 ± 0.18 1.97 4.75
Correlation Filter 4.86 ± 0.18 1.98 4.73
Yeo-Johnson 4.87 ± 0.18 1.97 4.75
rpart Base 5.01 ± 0.18 4.89 4.72
Correlation Filter 5.00 ± 0.17 4.91 4.75
Yeo-Johnson 5.01 ± 0.18 4.96 4.83
svmRadialSigma Base 4.94 ± 0.19 4.43 4.76
Correlation Filter 4.94 ± 0.19 4.43 4.74
Yeo-Johnson 4.94 ± 0.19 4.56 4.73
Baseline (Mean AFLPR) - 5.39 5.39 5.3
Baseline (AFLPR Pre-Game Rating) - 4.96 4.96 4.72
69IJCSS – Volume 20/2021/Issue 1 www.iacss.org
Figure 3: Relative importance of predictor variables in the best performing glmnet model. All 30 variables retained
in the model are shown. AFLPR = Official AFL player rating, Rel. = Relative, Xmas = Christmas,
Stand. = Standardized, ACWR = Acute:Chronic Workload Ratio.
Accumulated local effects (ALE) plots
The top two predictors from the best performing model were used in the creation of ALE plots
to show how the model prediction alters with changes in the predictor, thus providing a practical
means of interpretation for each model (Figure 4). Only the top two predictors are shown here,
so as to not emphasise the importance of the variables measured given the poor model predictive
quality.
Figure 4: Accumulated Local Effects plots for the two most important predictors in the best performing model. A
rug plot is also incorporated on the x-axis to show the distribution of data cases for that variable, with
a denser (black) color indicating a greater number of cases.
70IJCSS – Volume 20/2021/Issue 1 www.iacss.org
Discussion
The purpose of this study was to investigate the ability to predict elite individual AF player’s
game performance using different ML methods, and to subsequently determine the most
important predictors for the model’s developed. Our results show that the ability to predict
individual player game performance is poor, and often no better than using a singular measure
of player quality. Variable importance analysis showed that measures of player quality were
consistently the most important variables for prediction. This research highlights the limited
utility of currently collected pre-game variables to predict week-to-week game performance.
Modeling approaches
The different modeling approaches trialed here showed varied results across the training and test
data sets. Generally, model performance was similar across the different methods (exception for
nnet), as highlighted by the narrow range in RMSE prediction error on the test set (0.14). When
comparing model results to baseline performance, only the glmnet models were able to achieve
a lower RMSE than AFLPR pre-game rating baseline on the test set. This finding shows the
difficulty in predicting performance using the common physical preparation factors, individual
and team characteristics that are currently collected in elite AF environments.
This study is the first to report the predictive accuracy (i.e. RMSE) of ML models to predict the
official AFL player rating using the commonly collected variables we have included, and
therefore, is limited in the context of comparative research. However, previous research
exploring the links between physical preparation and individual characteristics to performance
have also concluded that there may be limited value in this type of player monitoring for week-
to-week individual game performance enhancement (Ryan et al., 2018). Such conclusions align
with the outcomes of our investigation. In addition, Gastin et al. (2013) showed that training
load based variables had limited association with individual AF player performance (r2 = 3.2%);
however, their results also showed that individual characteristics such as age, playing experience
and aerobic fitness explained 45.3% of variance in match performance data, a finding that was
not replicated here. Possible explanations for the discrepancy between these results and our
findings is the use of different performance measures (i.e. custom statistical rating vs AFLPR),
and/or the difference in study design, where no out of sample dataset was used to test the models
developed by Gastin et al. (2013) (i.e. association vs prediction). The approach taken by this
former work is likely to limit the ability of the model to generalize to new data, and therefore,
the explained variance is potentially inflated due to overfitting (James et al., 2013). Regardless,
the outcomes of our investigation, when considered collectively with the findings of previous
work, highlight the limited ability of training load/player monitoring variables to explain and
predict an individual player’s game performance.
71IJCSS – Volume 20/2021/Issue 1 www.iacss.org
When considering our outcomes, it should be noted that this study only includes pre-match
variables in the prediction, and therefore, is inherently limited in its prediction of performance,
since there are many factors that occur within a game that are likely to impact a typical
performance, and which are difficult to predict. These include: the likelihood of a player being
“tagged”, where an opposition player’s primary role is to nullify their opponent regardless of the
impact on their own offensive performance; injury to other players in a team that causes a change
in role/position/game time; fluctuations in the length of the game or change in environmental
conditions, which thereby alter the ability to accrue ratings points. While the unpredictable
week-to-week nature of AF (and other team sports) has been raised previously (Gastin et al.,
2013), our work is, to date, the most comprehensive study of pre-game factors at the individual
and team level, thereby reinforcing the unpredictable nature of AF player performance.
Most important predictors
Variable importance was derived from the best performing model to produce an insight into the
variables most related to the prediction of player performance. In the best performing model, the
two measures of player quality, AFLPR pre-game rating and coaches ranking, were by far the
most important variables. This finding is consistent with common thinking where higher rated
players are likely to perform better, given their historical performances (i.e. AFLPR pre-game
rating) and quality expectations (i.e. coaches ranking). Given the significance of the player
quality finding and the lack of predictive ability in the models exhibited here, an argument can
be made that player and team performance week-to-week can be enhanced by having the team’s
best players available to play. Previous research has shown the importance of having such
players available for team success (Drew, Raysmith, & Charlton, 2017; Eirale, Tol, Farooq,
Smiley, & Chalabi, 2013; Hagglund et al., 2013), and specific to the AFL, having the team’s
top-10 (i.e. key players) available (Fahey-Gilmour et al., 2019). Therefore, potential
modifications/additions in a training program seeking a performance benefit should be balanced
against injury and illness risk mitigation strategies that may assist players to remain healthy and
participate in games week-to-week.
While the results here (based on the variables collected) show that prediction of performance
week-to-week is poor, it does not mean that monitoring of such variables (i.e. physical
preparation factors) should be avoided. Various systematic reviews have linked player load to
injury (Eckard, Padua, Hearn, Pexa, & Frank, 2018), advocating for comprehensive monitoring
of player load in an attempt to minimize injury risk (Drew & Finch, 2016; Johnston, Black,
Harrison, Murray, & Austin, 2018). Further, player monitoring for performance benefit can be
seen in other ways. For example, McCaskie, Young, Fahrner, and Sim (2018) showed that 28.4%
(adjusted r2) of the variability in individual game performance accrued across the first four games
of an AFL season was explained by pre-season training variables. Other performance related
research has shown the importance of physical capacities for gathering disposals in match play
(Mooney et al., 2011), and even career progression (Burgess, Naughton, & Hopkins, 2012).
Furthermore, player monitoring, especially in games, can provide insights into the positional
demands of the game (Johnston et al., 2018), which can provide useful information for overall
physical preparation planning. As a result, it is still important for the variables investigated here
to be collected, but their usefulness for predicting week-to-week individual player performance
in AF games appears limited.
72IJCSS – Volume 20/2021/Issue 1 www.iacss.org
Practical applications and future research
The predictive quality of the models generated here limits their ability to be used on a week-to-
week basis for accurate predictions of player performance. Therefore, if available to play (i.e.
medically and physically sound), coaches should focus on the quality of player and their ability
to perform specific roles/responsibilities within the game, with lesser consideration for physical
preparation factors. However, the results do suggest that incorporating new or different measures
of the efficacy of elite AF players’ training programs are required to potentially improve
predicting player performance, particularly where their relevance to subsequent game
performance is not yet known.
The focus of the pre-match variables included in this study was the inclusion of pre-existing or
consistently collected variables and their derivatives. The lack of predictive ability of these
variables is reflected in the poor performance of the models reported here. As a result, it is
incumbent on stakeholders and those directly responsible for player performance to explore new
or improved measures that can be used to guide performance decisions. The focus of player
preparation pre-match variables here was largely derived from objective technology (e.g. GPS)
or testing (e.g. bench press, 2km time trial), with some inclusion of subjective player reporting
(e.g. wellness screening) and load (e.g. On-legs load). However, these variables mostly relate to
physical training or past games, and there are numerous other activities that are designed to assist
in player performance that are not currently collected or reported in relation to player game
performance. These include mindfulness sessions, which have recently become commonplace
in the AFL (Colangelo, 2017), the volume and type (e.g. review, education, leadership) of
meetings/programs players are required to participate in, measures of players football IQ
(Gabelich, 2018), player decision making ability (Johnston et al., 2018) and the quality of “off-
field” player engagements (Pink, 2015). Additionally, there is emerging research using in-game
player tracking data to quantify player skill/decision making (Spencer, Jackson, Bedin, &
Robertson, 2019) and team movement characteristics (Alexander, Spencer, Sweeting, Mara, &
Robertson, 2019) that has the potential to be linked to player performance. Often, these
aforementioned activities or characteristics are described as being important for elite AF
performance (directly or indirectly) but are yet to be quantified and/or included in studies such
as these.
While the statistical models implemented here were of little predictive power, it is fortunate that
the practitioners responsible for enhancing player performance (i.e. coaches and support staff)
are not bound by the limitations of sample statistical models. Where possible, practitioners
should build their own sophisticated “individual player models” or mental models using the
available data (subjective and objective) to get an understanding of the factors that might
improve player performance. This can then be used to help guide decision making on an
individual player basis.
Additionally, viewing performance through a global lens may not be appropriate on a week-to-
week level. Coaches will often implement weekly training activities to correct different aspects
of team or individual player deficiencies (e.g. style of play, stoppages, contest work, goal kicking
etc.) and/or to prepare for games against specific opponents. Therefore, it is possible that future
research may examine performance at a more granular level, where certain drills and locomotor
activity profile may explain some of the performance for specific game scenarios in matches that
follow.
73IJCSS – Volume 20/2021/Issue 1 www.iacss.org
Limitations
This study used players from one AFL club across six seasons (2014-2019). Due to the length
of the data collection, several limitations exist. The first is the inability to compare predictive
models for subjective ratings (i.e. coach ratings) with the objective AFLPR for the entirety of
the data set, as there was a significant change in how coach ratings were defined and measured
in this time. Coaches ratings are often based on pre-conceived performance indicators (e.g.
specific role and team play), and defined by how well the coach considers these to have been
achieved (Johnston et al., 2012; Sullivan et al., 2014). In addition, it has been suggested that this
subjective measure is the best criterion measure for evaluating player performance, as coaches
have intimate knowledge of what was expected from each player and have the ability to
understand the many performance aspects that may not be explained in objective measures
(Johnston et al., 2012; Sullivan et al., 2014). However, most importantly, Ryan et al. (2018)
suggests that AFLPR and coach ratings assess different aspects of performance, and therefore,
future research should look to understand the predictive ability of measures studied here with
coach ratings, to potentially gain a greater understanding of performance prediction.
Secondly, the statistical methods used in this study are not player specific and therefore not able
to account for the player directly. This is a potential reason for the poor outcomes exhibited here,
where individual players are likely to have their own individual characteristics and/or
preparation factors that allow them to achieve their best performance that are not necessarily
shared by other individuals. For example, Gastin et al. (2013) showed that groups of players
either responded positively, negatively or neutrally to increases in weekly training load leading
into an elite AF game, and that players with varying repeat sprint abilities responded differently
to changing levels of weekly training load. Therefore, using a global model for all players may
not be sensitive enough to ascertain these differences and other statistical methods should be
investigated. At the very least, future research using the approaches established here may look
to separate players into playing position, as has been done previously (Lazarus et al., 2017;
McIntosh et al., 2019), to give a better reflection of the nuances that exist within the component
parts of a team structure.
Thirdly, the change in GPS tracking technology across 2014-2019 made it difficult to obtain
consistent measures of player locomotion, apart from distance, sprint distance and maximal
speed exposure. Potentially, a measure that considers player change of direction load and
acceleration/deceleration profile would assist in providing more understanding of a player’s
physical load and assist in more accurate predictions of performance.
Lastly, given these measures are from one cohort over several seasons, the results are specific to
this time period, and the generalizability of these findings to other teams or other competitions
is unknown. Further, staff at the AFL club used here were aware of the current literature, and as
such, likely made decisions to maximize performance on a week-to-week basis, which may have
led to reducing the variance associated with different predictors, thereby hampering their
predictive ability.
74IJCSS – Volume 20/2021/Issue 1 www.iacss.org
Conclusion
Machine learning methods are not able to successfully predict individual player performance on
a game-by-game basis to a much greater extent than a singular measure of player quality.
Therefore, it is suggested that, based on the current variables collected and analyzed in elite AF
clubs, the information should not be relied upon to reasonably predict player performance.
Increased efforts to improve the collection of data off-field (e.g. mindfulness sessions, football
IQ/decision making, off-field activities), likely in-game actions (e.g. potential tagger) or game
performance variables derived from player tracking data may lead to the greatest improvements
in the capacity to predict individual player game performance. Alternatively, other performance
measures (e.g. coach ratings) should be investigated as a point of comparison.
References
Alexander, J. P., Spencer, B., Sweeting, A. J., Mara, J. K., & Robertson, S. (2019). The
influence of match phase and field position on collective team behaviour in Australian
Rules football. Journal of Sports Sciences, 37(15), 1699-1707.
doi:10.1080/02640414.2019.1586077
Apley, D. W. (2016). Visualizing the effects of predictor variables in black box supervised
learning models. arXiv.org, 1-36. Retrieved from https://arxiv.org/abs/1612.08468
Beretta, L., & Santaniello, A. (2016). Nearest neighbor imputation algorithms: A critical
evaluation. BMC Medical Informatics and Decision Making, 16(Suppl. 3), 74.
doi:10.1186/s12911-016-0318-z
Burgess, D., Naughton, G., & Hopkins, W. (2012). Draft-camp predictors of subsequent career
success in the Australian Football League. Journal of Science and Medicine in Sport,
15(6), 561-567. doi:10.1016/j.jsams.2012.01.006
Colangelo, A. (2017, November 4). Mindfulness and meditation helped Richmond break their
AFL premiership drought. The Age. Retrieved from
https://www.theage.com.au/sport/afl/mindfulness-and-meditation-helped-richmond-
break-afl-premiership-drought-20171103-gzed1o.html
Colby, M. J., Dawson, B., Heasman, J., Rogalski, B., & Gabbett, T. J. (2014). Accelerometer
and GPS-derived running loads and injury risk in elite Australian footballers. Journal
of Strength and Conditioning Research, 28(8), 2244-2252.
doi:10.1519/JSC.0000000000000362
Colby, M. J., Dawson, B., Peeling, P., Heasman, J., Rogalski, B., Drew, M. K., & Stares, J.
(2018). Improvement of prediction of noncontact injury in elite Australian footballers
with repeated exposure to established high-risk workload scenarios. International
Journal of Sports Physiology and Performance, 13(9), 1130-1135.
doi:10.1123/ijspp.2017-0696
Colby, M. J., Dawson, B., Peeling, P., Heasman, J., Rogalski, B., Drew, M. K., . . . Lester, L.
(2017). Multivariate modelling of subjective and objective monitoring data improve the
detection of non-contact injury risk in elite Australian footballers. Journal of Science
and Medicine in Sport, 20(12), 1068-1074. doi:10.1016/j.jsams.2017.05.010
Drew, M. K., & Finch, C. F. (2016). The relationship between training load and injury, iIllness
and soreness: A systematic and literature review. Sports Medicine, 46(6), 861-883.
doi:10.1007/s40279-015-0459-8
75IJCSS – Volume 20/2021/Issue 1 www.iacss.org
Drew, M. K., Raysmith, B. P., & Charlton, P. C. (2017). Injuries impair the chance of
successful performance by sportspeople: A systematic review. British Journal of Sports
Medicine, 51(16), 1209-1214. doi:10.1136/bjsports-2016-096731
Eckard, T. G., Padua, D. A., Hearn, D. W., Pexa, B. S., & Frank, B. S. (2018). The relationship
between training load and injury in athletes: A systematic review. Sports Medicine,
48(8), 1929-1961. doi:10.1007/s40279-018-0951-z
Eirale, C., Tol, J. L., Farooq, A., Smiley, F., & Chalabi, H. (2013). Low injury rate strongly
correlates with team success in Qatari professional football. British Journal of Sports
Medicine, 47(12), 807-808. doi:10.1136/bjsports-2012-091040
Fahey-Gilmour, J., Dawson, B., Peeling, P., Heasman, J., & Rogalski, B. (2019). Multifactorial
analysis of factors influencing elite Australian football match outcomes: A machine
learning approach. International Journal of Computer Science in Sport, 18(3), 100-124.
doi:10.2478/ijcss-2019-0020
Friedman, J., Hastie, T., & Tibshirani, R. (2010). Regularization paths for generalized linear
models via coordinate descent. Journal of Statistical Software, 33(1), 1-22.
Gabelich, J. (2018). ‘Football IQ off the charts’: David King says Carlton teen Zac Fisher uses
the ball like Sam Mitchell. Retrieved from Fox Sports website:
https://www.foxsports.com.au/afl/football-iq-off-the-charts-david-king-says-carlton-
teen-zac-fisher-uses-the-ball-like-sam-mitchell/news-
story/0dc4de3fc820400a936d577c25277fbf
Gastin, P. B., Fahrner, B., Meyer, D., Robinson, D., & Cook, J. L. (2013). Influence of physical
fitness, age, experience, and weekly training load on match performance in elite
Australian football. Journal of Strength and Conditioning Research, 27(5), 1272-1279.
doi:10.1519/JSC.0b013e318267925f
Hagglund, M., Walden, M., Magnusson, H., Kristenson, K., Bengtsson, H., & Ekstrand, J.
(2013). Injuries affect team performance negatively in professional football: An 11-
year follow-up of the UEFA Champions League injury study. British Journal of Sports
Medicine, 47(12), 738-742. doi:10.1136/bjsports-2013-092215
Impellizzeri, F. M., Rampinini, E., Coutts, A. J., Sassi, A., & Marcora, S. M. (2004). Use of
RPE-based training load in soccer. Medicine and Science in Sports and Exercise, 36(6),
1042-1047. doi:10.1249/01.mss.0000128199.23901.2f
Jackson, K. (2016). Assessing player performance in Australian football using spatial data.
(Doctor of Philosophy), Swinburne University of Technology, Melbourne, Australia.
James, G., Witten, D., Hastie, T., & Tibshirani, R. (2013). An introduction to statistical
learning (1 ed.). New York: Springer.
Johnston, R. D., Black, G. M., Harrison, P. W., Murray, N. B., & Austin, D. J. (2018). Applied
sport science of Australian football: A systematic review. Sports Medicine, 48(7), 1673-
1694. doi:10.1007/s40279-018-0919-z
Johnston, R. J., Watsford, M. L., Pine, M. J., Spurrs, R. W., Murphy, A., & Pruyn, E. C. (2012).
Movement demands and match performance in professional Australian football.
International Journal of Sports Medicine, 33(2), 89-93. doi:10.1055/s-0031-1287798
Karatzoglou, A., Smola, A., Hornik, K., & Zeileis, A. (2004). kernlab - an S4 package for
kernel methods in R. Journal of Statistical Software, 11(9), 1-20.
doi:10.18637/jss.v011.i09
76IJCSS – Volume 20/2021/Issue 1 www.iacss.org
Kuhn, M. (2017). caret: Classification and regression training (Version 6.0-76.). Retrieved
from https://CRAN.R-project.org/package=caret
Kuhn, M., & Johnson, K. (2016). Applied Predictive Modeling. (pp. 600). doi:10.1007/978-1-
4614-6849-3
Kuhn, M., & Wickham, H. (2018). recipes: Preprocessing tools to create design matrices
(Version 0.1.3.). Retrieved from https://CRAN.R-project.org/package=recipes
Lazarus, B. H., Stewart, A. M., White, K. M., Rowell, A. E., Esmaeili, A., Hopkins, W. G., &
Aughey, R. J. (2017). Proposal of a global training load measure predicting match
performance in an elite team sport. Frontiers in Physiology, 8, 930.
doi:10.3389/fphys.2017.00930
Liaw, A., & Wiener, M. (2002). Classification and regression by randomForest. R News, 2(3),
18-22.
Malone, J. J., Lovell, R., Varley, M. C., & Coutts, A. J. (2017). Unpacking the black box:
Applications and considerations for using GPS devices in sport. International Journal
of Sports Physiology and Performance, 12(Suppl. 2), S218-S226.
doi:10.1123/ijspp.2016-0236
McCaskie, C. J., Young, W. B., Fahrner, B. B., & Sim, M. (2018). Association between pre-
season training and performance in elite Australian football. International Journal of
Sports Physiology and Performance, 14(1), 68-75. doi:10.1123/ijspp.2018-0076
McIntosh, S., Kovalchik, S., & Robertson, S. (2019). Comparing subjective and objective
evaluations of player performance in Australian Rules football. PloS One, 14(8),
e0220901. doi:10.1371/journal.pone.0220901
Milborrow, S. (2018). earth: Multivariate adaptive regression splines (Version 4.6.3).
Retrieved from https://CRAN.R-project.org/package=earth
Molnar, C. (2018). Interpretable Machine Learning. Retrieved from
https://christophm.github.io/interpretable-ml-book/
Molnar, C., Bischl, B., & Casalicchio, G. (2018). iml: An R package for interpretable machine
learning. Journal of Open Source Software, 3(26), 786. doi:10.21105/joss.00786
Mooney, M., O'Brien, B., Cormack, S., Coutts, A., Berry, J., & Young, W. (2011). The
relationship between physical capacity and match performance in elite Australian
football: A mediation approach. Journal of Science and Medicine in Sport, 14(5), 447-
452. doi:10.1016/j.jsams.2011.03.010
Pink, M. A. (2015). Relationships between AFL player off-field activity player characteristics,
the club environment and on-field engagement. (Doctor of Philosophy), Australian
Catholic University, Fitzroy, Australia.
R Core Team. (2018). R: A language and environment for statistical computing. Vienna,
Austria: R Foundation for Statistical Computing. Retrieved from https://www.R-
project.org/
Robertson, S., Gupta, R., & McIntosh, S. (2016). A method to assess the influence of individual
player performance distribution on match outcome in team sports. Journal of Sports
Sciences, 34(19), 1893-1900. doi:10.1080/02640414.2016.1142106
77You can also read