Canadian Bank Outlook 2019: Macro Risks Moderating, Rates Rising, And Bail-In-Eligible Borrowings Under Way - S&P Global Ratings

Page created by Thomas Cohen
 
CONTINUE READING
Canadian Bank Outlook 2019: Macro Risks Moderating, Rates Rising, And Bail-In-Eligible Borrowings Under Way - S&P Global Ratings
Canadian Bank Outlook 2019:
Macro Risks Moderating, Rates Rising, And Bail-In-Eligible Borrowings Under Way

                                                     AUTHORS
                                                     Nikola Swann      Shameer Bandeally
                                                     Lidia Parfeniuk   Amit Tiwari
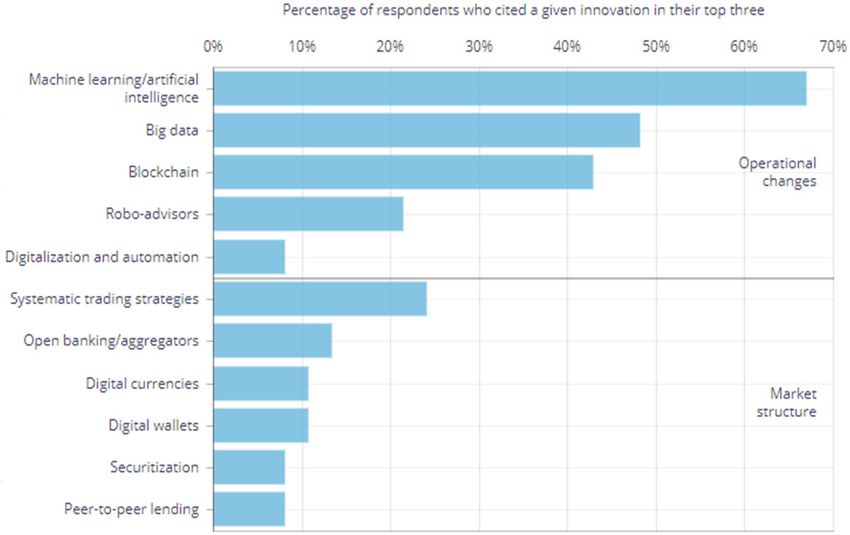
Canadian Bank Outlook 2019: Macro Risks Moderating, Rates Rising, And Bail-In-Eligible Borrowings Under Way - S&P Global Ratings
Contents
Outlook Summary                                  3

Macroeconomic Backdrop                           4

Canadian Banking Risks Still Low Despite         6
Deterioration
Canadian Bank Ratings All Stable But Two         10

Asset And Income Trends Healthy                  12

Digitization And Cybersecurity In Focus          16

Capitalization Adequate-To-Very Strong Despite   18
Headwinds
Asset Quality As Good As It Gets                 19

Funding And Liquidity Steady As Bail-In Regime   22
Implemented

                                                      Jan. 18, 2019   2
Canadian Bank Outlook 2019: Macro Risks Moderating, Rates Rising, And Bail-In-Eligible Borrowings Under Way - S&P Global Ratings
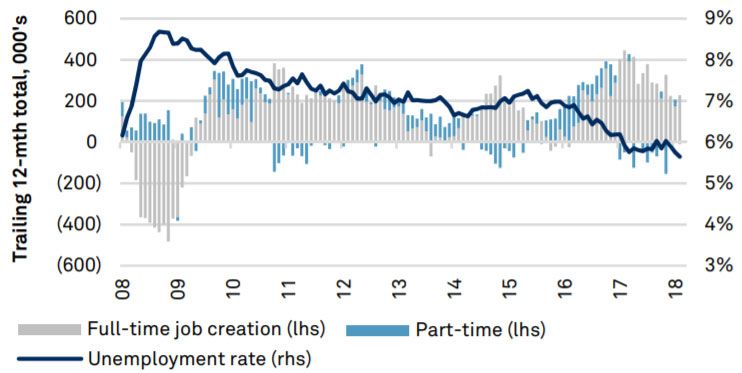
The Outlook For Canadian Banks Is Mostly Stable

   Improving                                            Neutral                                                 Worsening

                 We expect decelerating but still relatively strong economic growth, with increasing rates. We expect banking industry
   Macro
                 risks to remain stable, and our base case presumes growth in consumer debt and house prices will moderate, albeit
 environment     from elevated levels, in 2019.

                 Our expected macroeconomic backdrop implies continued growth, in 2019, in loans and net interest margin (NIM)
 Revenues &      driven by corporate lending. We also expect wealth management and foreign operations to represent increasingly
  Expenses       significant proportions of revenue, but market-sensitive income to remain a drag. On the expense side, we expect
                 gradual progress with digitization to continue to lower input costs, but cybersecurity spending to increase.

                 We expect profitability to hold largely steady, in 2019, as accelerating net interest income (NII) replaces decelerating
 Profitability   growth in non-interest income.

                 We expect mild deterioration in nonperforming assets (NPAs) and net charge-offs (NCOs), reflecting the increased
Asset Quality    debt-servicing cost implied by interest rates, but for these metrics to remain near the stronger end of the past
                 decade’s performance.

                 We expect capitalization by our (S&P Global Ratings risk-adjusted capital [RAC]) measure to remain unchanged and
   Capital       ratings neutral for most banks.

 Funding &       We expect the incremental adding of bail-in-eligible senior resolution notes to not significantly alter prior issuance
  Liquidity      volumes, nor cost-of-funds. Liquidity is unlikely to improve much beyond its current level.

                                                                                                                     Jan. 18, 2019          3
Canadian Bank Outlook 2019: Macro Risks Moderating, Rates Rising, And Bail-In-Eligible Borrowings Under Way - S&P Global Ratings
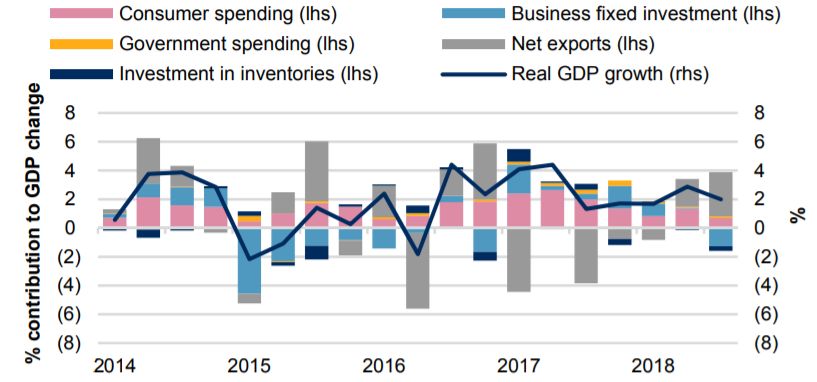
Macroeconomic Backdrop: Decelerating But Still Relatively Strong
Growth As Rates Increase, So Long As Trade Keeps Flowing
    S&P Global Ratings’ Economic Outlook – Select Economic Indicators              Unemployment at its lowest in 40 years
                           2014       2015      2016     2017      2018F   2019F

    Real GDP (%)            2.9       1.0       1.4      3.0       2.1     2.0

    CPI (%)                 1.9       1.1       1.4      1.6       2.3     2.1

    Unemployment (%)       6.6        6.9       7.0      6.3       5.8     5.8

    Short-term rate         1.2       0.8       0.8      1.4       2.1     2.5

    Long-term rate          1.9       1.5       1.5      2.0       2.5     3.3

    U.S.-Mexico-Canada Agreement (USMCA) will present manageable
     changes for several industries such as dairy (price, market share) and
     automobiles (production costs, tariffs). U.S.-China trade tensions             Exports rebounding post-USMCA
     continue to temper business sentiment.

    We expect Canada’s economic growth to decelerate but remain
     relatively strong, as net exports continue to benefit from decelerating
     but still relatively strong U.S. growth, while rising borrowing costs,
     already high consumer debt burdens, and tighter underwriting
     standards continue to dampen housing demand.

    Interest rates will continue to climb as the Bank of Canada moves its
     policy rate toward its neutral range (2.5%-3.5%), from the current
     1.75%. We expect the policy rate to end 2019 at 2.5%.

Sources: S&P Global Ratings, Bank of Canada. CPI--Consumer Price Index.

                                                                                                              Jan. 18, 2019   4
Canadian Bank Outlook 2019: Macro Risks Moderating, Rates Rising, And Bail-In-Eligible Borrowings Under Way - S&P Global Ratings
USMCA: Little Impact… So Long As It’s Ratified
                                                           USMCA Partner Trade – Bil. US$
  700                                                                                                                                                140

  600                                                                                                                                                120

  500                                                                                                                                                100

  400                                                                                                                                                80

  300                                                                                                                                                60

  200                                                                                                                                                40

  100                                                                                                                                                20

     -                                                                                                                                               -
            1994 1995 1996 1997 1998 1999 2000 2001 2002 2003 2004 2005 2006 2007 2008 2009 2010 2011 2012 2013 2014 2015 2016 2017

                                                     Imports (LHS)       Exports (LHS)        Net Exports (RHS)

        Canadian exports rebounded in the latter half of 2018 and are expected to continue expanding in 2019 along with net exports.

        None of the USMCA key updates are expected to present significant challenges to Canadian industries.
               Auto + parts quotas should benefit Canada but will be balanced against general competitive forces, evidenced by recent GM
                closures
               Marginally increased access to local dairy markets for U.S farmers should boost U.S.-to-Canada exports by about $70 million, but
                access is still only 3.6% of the market, with heavy tariffs on exceeding quotas

        Ratification in 2019 was already least certain in the U.S.; the partial government shutdown can only delay U.S. ratification. If ratification
         were to go off the rails, Canadian business sentiment (and related bank revenues, such as those tied to corporate investment spending)
         would likely worsen.
Sources: S&P Global Ratings, World Bank.

                                                                                                                                   Jan. 18, 2019           5
Canada Still A Low-Risk Country For Banking, Despite Mild
Deterioration
                                                                                                                                                   BICRA Brief: Canada

                                                                                                                                         BICRA group: ‘2’
                                                                                                                                            ER/ER trend: 3/Stable
                                                                                                                                            IR/IR trend: 2/Stable

                                                                                                                                         Recent years’ incremental
                                                                                                                                         deterioration led to, in 2018:
                                                                                                                                            ER worsened to ‘3’ from ‘2’…
                                                                                                                                            …but ER trend improved to stable
                                                                                                                                             from negative.

                                                                                                                                         Looking Ahead:
                                                                                                                                            We expect economic and industry risk
                                                                                                                                             trends to remain stable in 2019.

  The 2018 worsening of the ER score reflects our concerns over high consumer indebtedness and elevated house
  prices leaving the Canadian banks more vulnerable to downside risks, but we think these risks are moderating and
  further deterioration is unlikely in 2019.

A BICRA (Banking Industry Country Risk Assessment) is scored on a scale from ‘1’ to ’10’, ranging from the lowest-risk banking systems (group ‘1’) to the highest-risk (group ‘10’). ER –
Economic Risk; IR – Industry Risk.
Source: S&P Global Ratings.

                                                                                                                                                                Jan. 18, 2019               6
Key Sources Of Credit Risk: Consumers And The Housing Market
                                                        Housing Price Growth                                                                                                                                 DSIBs – Median Consumer Loan Growth
 200%                                                                                                                                                                                                10%
 180%
 160%                                                                                                                                                                                                8%
 140%
 120%                                                                                                                                                                                                6%
 100%
  80%                                                                                                                                                                                                4%
  60%
  40%                                                                                                                                                                                                2%
  20%
                                                                                                                                                                                                     0%
   0%
                          Oct-06

                                                     Oct-08

                                                                                Oct-10

                                                                                                           Oct-12

                                                                                                                                      Oct-14

                                                                                                                                                                 Oct-16

                                                                                                                                                                                            Oct-18
                 Feb-06

                                            Feb-08

                                                                       Feb-10

                                                                                                  Feb-12

                                                                                                                             Feb-14

                                                                                                                                                        Feb-16

                                                                                                                                                                                   Feb-18
        Jun-05

                                   Jun-07

                                                              Jun-09

                                                                                         Jun-11

                                                                                                                    Jun-13

                                                                                                                                               Jun-15

                                                                                                                                                                          Jun-17
                                                                                                                                                                                                     -2%
                                                                                                                                                                                                           2012     2013         2014    2015   2016      2017      2018

                    Composite                                          Vancouver                                      Toronto                                    Montreal                                         Credit Cards          HELOC      Other Personal

Composite includes the 11 largest metropolitan areas.

    Housing prices in the two largest and hottest markets (Toronto and Vancouver) cooled in 2018, with year-over-year price growth of about 3%-5%
     in major markets, while some western markets (Edmonton, Calgary) declined. We expect residential mortgage (RM) credit and house prices to
     continue to increase in 2019, reflecting continued strong underlying demand, but at a more moderate pace, tempered by higher interest rates and
     tightened underwriting by the largest lenders, reflecting, among other factors, the B-20 stress test implemented in 2018.

    "Other consumer" loan growth has converged in recent years to about a 3%-6% pace (median growth among the big banks).
          1.  Credit Card activity has been influenced by M&A activity, such as BNS completing its acquisition of BBVA Chile, and acquiring assets or
              partnerships in Colombia and Peru. We don’t expect the Aeroplan-Aimia deal to affect card volumes with TD and CIBC, as we expect Air
              Canada to seamlessly take over the loyalty program. We expect expansion of this kind to continue in 2019, particularly abroad.
          2.  HELOC growth decelerated over the past year, likely reflecting rising interest rates, both of which we expect will continue.
          3.  Other Personal lending is on an uptick--mainly due to automobile lending, such as TD’s U.S. expansion plans in the space, which we
              expect will continue in 2019.

Sources: S&P Global Ratings, company filings, Teranet. DSIB--Domestic systemically important bank. HELOC--Home equity line of credit.

                                                                                                                                                                                                                                                       Jan. 18, 2019       7
Key Drivers Of Our 2018 Revision Remain In Focus
     High-profile cases of documentation deficiencies in the RM
                                                                                                Residential Mortgages Continue Increasing;


     underwriting process, such as with Home Capital and Laurentian
     Bank, have led to renewed efforts to tighten lending frameworks                                         Arrears Improve
     against fraud, including talk of officials allowing the Canada                     4,400                                                                         0.40%
     Revenue Agency to share income data with lenders and/or
     mortgage insurers. Our move to ER3/Stable assumes a limited                        4,350                                                                         0.30%

                                                                                 Mil.
     amount of further evidence emerges regarding fraud or other RM                     4,300                                                                         0.20%
     underwriting deficiencies.
                                                                                        4,250                                                                         0.10%

    Positively, RM arrears/loans have been on a downward trend for                     4,200                                                                         0.00%
     many years. Still, we believe rising DTI and house prices                                  2011     2012     2013     2014     2015     2016    2017     2018
     strengthen incentives for fraud, although we expect these                                                                                                Sep.
     incentives to moderate, near current levels, in 2019.
                                                                                           Mortgages (LHS)          Arrears (LHS)          Arrears / Total Mortgages (RHS)

    An increasing share of brokered mortgages was another factor in
     our move to ER3, as we believe brokers’ incentives differ from
     lenders’, but we also expect moderation in the brokers’ share in
                                                                                                                Macro Credit Metrics
     2019.                                                                      180%                                                                                   15%

                                                                                                                                                                       10%
                                                                                130%
                    Household DTI by Product
                                                                                                                                                                       5%
                                                                                 80%
                                                                                                                                                                       0%
    0%              50%          100%             150%            200%
                                                                                 30%
         Mortgage    HELOC     Cards     Auto    Installment    Other                                                                                                  -5%
                                                                                           1994
                                                                                           1995
                                                                                           1996
                                                                                           1997
                                                                                           1998
                                                                                           1999
                                                                                           2000
                                                                                           2001
                                                                                           2002
                                                                                           2003
                                                                                           2004
                                                                                           2005
                                                                                           2006
                                                                                           2007
                                                                                           2008
                                                                                           2009
                                                                                           2010
                                                                                           2011
                                                                                           2012
                                                                                           2013
                                                                                           2014
                                                                                           2015
                                                                                           2016
                                                                                           2017
                                                                                         2018 F
                                                                                         2019 F
                                                                                -20%                                                                                   -10%
    With anticipated rate hikes and tightened B-20
    guidelines constraining refinancing options, we                                                    Household DTI (LHS)
                                                                                                       Household debt/GDP (LHS)
    expect mortgage arrears to tick up in 2019.                                                        Credit/GDP (LHS)
                                                                                                       Real change in residential house price index (RHS)
Sources: S&P Global Ratings, company filings, Canadian Bankers Association, Canada Mortgage Housing Corp. DTI--Debt-to-income.

                                                                                                                                                      Jan. 18, 2019           8
Brokered Residential Mortgages: Share Growth To Moderate

                                        Broker Share Of Mortgage Originations
          60

          50

          40
    (%)

          30

          20

          10

          0
                 2012               2013                2014             2015               2016               2017

                                   First-time Buyers   Repeat Buyers   Refinancers    Renewers

   In light of the latest Canada Mortgage and Housing Corp. (CMHC) consumer survey, we believe the brokered share
    declined slightly in 2018, among first-time and repeat buyers, and refinancers, while remaining steady among
    renewers.

   Nearly 90% of broker market volume flows through 10 dealers.

  We expect brokers’ share of the market to continue to grow in 2019, although at a more moderate pace, as house-
   priceCMHC.
Sources: growth decelerates.

                                                                                                         Jan. 18, 2019   9
Canadian Bank Ratings: All Stable But Two
                                                    Business          Capital &          Risk        Funding &                       Group           Systemic             ICR &
                                    Anchor                                                                              SACP
                                                    Position          Earnings          Position      Liquidity                     Support         Importance           Outlook

 Bank of Montreal                      a-           Adequate          Adequate           Strong     Avg. & Adeq.          a                             High            A+/Stable

 Bank of Nova Scotia                 bbb+            Strong           Adequate           Strong     Avg. & Adeq.          a                             High            A+/Stable

 Canadian Imperial
                                       a-           Adequate          Adequate       Adequate       Avg. & Adeq.          a-                            High            A+/Stable
 Bank of Commerce

                                                                                                    Above Avg. &
 Central 1 Credit Union                a-             Weak         Very Strong       Moderate                             a-                            Low             A-/Stable
                                                                                                       Strong

 Fédération des Caisses
                                       a-           Adequate           Strong        Adequate       Avg. & Adeq.          a                          Moderate           A+/Stable
 Desjardins du Québec
                                                                                                    Below Avg. &
 Home Capital Group Inc.               a-           Very Weak          Strong            Weak                             b+                            Low            B+*/Positive
                                                                                                     Moderate

 HSBC Bank Canada                      a-           Moderate          Adequate       Adequate       Avg. & Adeq.        bbb+          Core              Low             AA-/Stable

 Laurentian Bank of
                                       a-             Weak            Adequate       Adequate       Avg. & Adeq.         bbb                            Low           BBB/Negative
 Canada

                                                                                                    Above Avg. &
 Manulife Bank of Canada               a-             Weak         Very Strong       Moderate                           bbb+        Strategic           Low             A+/Stable
                                                                                                       Adeq.

 National Bank of Canada               a-           Adequate          Adequate       Adequate       Avg. & Adeq.          a-                         Moderate            A/Stable

 Royal Bank of Canada                  a-            Strong           Adequate           Strong     Avg. & Adeq.          a+                            High            AA-/Stable

 Toronto-Dominion Bank                 a-            Strong           Adequate           Strong     Avg. & Adeq.          a+                            High            AA-/Stable

 Movements From The Anchor:

 Very Weak (-5)       Weak (-2)     Moderate (-1)      Adequate (0)       Strong (+1)      Very Strong (+2)

Source: S&P Global Ratings. SACP--Stand-alone credit profile. ICR--Issuer credit rating. *Home Trust Co. (lead operating company) ICR. Home Capital Group Inc. (non-operating holding
company or NOHC) ICR is B-/Positive, because we view an NOHC as reliant on dividends and other distributions from its operating companies.

                                                                                                                                                            Jan. 18, 2019            10
Tiptoeing Into Bail-in-eligibility Since September
                                                            Key Takeaways
Canadian Systemically                                       1. Bail-in-eligible ("senior subordinated" or "senior resolution") issue ratings are gradually
Important Banks Ratings And                                    being assigned to DSIBs
Outlooks Are Unchanged                                      2. No change to DSIB ICRs (applicable to senior debt ineligible for bail-in) nor outlooks
Following Release Of Draft Bail-                               No change in our government support assessment on Canada (“Supportive”)
In Regulations, June 19, 2017
                                                            3. No resolution counterparty rating assigned to DSIBs
                                                            4. We view Canada’s resolution regime as “effective” (as defined in our ALAC criteria1)

                                                              We rate bail-in debt at one notch below the SACP, reflecting the common-
A Closer Look At How
                                                              equity conversion clause--that we consider to be effective subordination
Proposed Bail-in Regulations
May Affect Canadian Bank
Ratings, July 14, 2017                                                                             BMO             BNS                CM                NA       RY         TD
                                                              Anchor                                 a-            bbb+                a-                a-      a-             a-
                                                              SACP                                    a               a                a-                a-      a+         a+

Canadian Systemically                                         Systemic Importance                    +1              +1                +2               +1       +1         +1
Important Banks Ratings And
                                                              ICR                                    A+              A+                A+                A      AA-         AA-
Outlooks Are Unchanged On
Release Of Final Bail-In                                      Bail-In Debt2                          A-              A-             BBB+              BBB+       A              A
Regulations, April 20, 2018

                                                              We expect the remaining Canadian D-SIFI, the Desjardins Group, to become subject to a
                                                              separate bail-in regime, possibly as early as April 2019, based on the public consultation
Review Of Canadian Bank                                       administered by Desjardin’s regulator (Quebec’s Autorité des marchés financiers or
Resolution Regime Completed;                                  AMF). We plan to comment further on any implications for our ratings on Desjardins,
Ratings And Outlooks On                                       once the AMF’s final regulations are published.
Systemically Important Banks
Unchanged, Aug. 16, 2018                                      1Bank   Rating Methodology And Assumptions: Additional Loss-Absorbing Capacity; April 27, 2015.
                                                              2Only   RBC, TD, and CIBC have issued bail-in debt, to date.

Sources: S&P Global Ratings. ALAC--Additional loss-absorbing capital. DSIB--Domestic systemically important bank.

                                                                                                                                                                Jan. 18, 2019        11
Balance Sheet: Corporate Lending To Continue To Drive Growth

               Loan Growth By Type - All Rated                                        Average Loan Mix – All Rated Canadian Banks
                      Canadian Banks                                           100%
                                                                                90%
    50%
                                                                                80%
    40%                                                                         70%
                                                                                60%
    30%                                                                         50%
                                                                                40%
    20%
                                                                                30%
    10%                                                                         20%
                                                                                10%
    0%                                                                           0%
      2012       2013        2014        2015        2016       2017    2018          2009   2010   2011   2012   2013    2014   2015     2016   2017   2018

               Residential Real Estate         Commercial & Corporate                        Residential Real Estate     Commercial & Corporate
               Commercial Real Estate          Other Consumer                                Commercial Real Estate      Other Consumer

    Post-2011 (generally accepted accounting principles to International Financial Reporting Standards [IFRS]) balance-sheet growth has been
     relatively stable, averaging about 6% per year over the past few years.

    Commercial/corporate lending has driven loan growth in recent years and is becoming a larger part of the loan mix for many banks, a trend
     we expect will continue, in light of our macroeconomic assumptions.

    We expect DSIBs to increase foreign assets more aggressively, augmented by mergers and acquisitions (M&A) activity, particularly in the
     U.S. where many DSIBs have subsidiaries.

    We expect aggregate DSIB loans to grow at about 5%-6% into 2019, with deposits growing at a similar rate.

Source: S&P Global Ratings, company filings.

                                                                                                                                        Jan. 18, 2019          12
M&A: Investments In Wealth & Technology To Continue
    Two key spheres dominated M&A activity in 2018: wealth and technology.

    Banks are continuing to make bolt-on acquisitions of small-to-midsize asset management firms, with BNS leading the way in 2018 with
     several high-profile multi-billion-dollar acquisitions.

    Notably, DSIBs are also gobbling up niche tech startups, such as the acquisition of artificial intelligence startup Layer 6 by TD, and tech-
     savvy specialty finance firm Wellington Financial by CIBC--part of a broader move by banks to effectively analyze the mass amounts of
     customer data on hand, both for better cross-sell and to find and better realize cost efficiencies.

    RBC has been investing in AI research as well, having opened labs in Toronto and Edmonton.

    We expect more of the same M&A in 2019 as wealth revenues show no sign of slowing down, and competitive pressures re: technology
     continue, in Canada and abroad.

                                                               Buys…                   For…                      Industry

    Bank of Montreal                                           KGS-Alpha               Undisclosed               Capital Markets

    Bank of Nova Scotia                                        Jarislowsky-Fraser      $1 Billion                Wealth Management

    Bank of Nova Scotia                                        MD Financial            $2.5 Billion              Wealth Management

    Bank of Nova Scotia                                        Misc. LatAm/Caribbean   Undisclosed               P&C, Cards

    Canadian Imperial Bank of Commerce                         Wellington Financial    Undisclosed               Advisory, Venture Capital

    Toronto-Dominion Bank                                      Greystone Investments   $800 Million              Wealth Management

    Toronto-Dominion Bank                                      Layer 6                 Undisclosed               Artificial Intelligence

Source: S&P Global Ratings, company filings. P&C--Personal & commercial.

                                                                                                                                Jan. 18, 2019       13
NIMs Are Rising And Will Continue To Do So
                                                                                          The Bank of Canada increased the policy (overnight) rate three
                             A Tale of Two Rates                                           times in 2018, from 1.00% to 1.75% as part of its efforts to
 2.65%                                                                                     normalize monetary policy amid tight labor markets, rising exports,
                                                                          1.50%            and relatively strong macroeconomic data. We expect the bank’s
 2.60%                                                                                     policy rate to end 2019 at 2.5%.
                                                                          1.00%
 2.55%
                                                                                          The rate hikes are helping domestic NIMs upward as DSIBs have
 2.50%                                                                    0.50%            succeeded in raising lending rates more quickly than their funding
                                                                                           costs are increasing, sustaining profitability despite decelerating
 2.45%                                                                    0.00%            growth in non-interest income. The latter was largely a result of
           Q1 17 Q2 17 Q3 17 Q4 17 Q1 18 Q2 18 Q3 18 Q4 18                                 market volatility causing declines in underwriting, trading, and
             DSIB Domestic NIM (LHS)               BoC Overnight Rate (RHS)                other market-sensitive income; we are assuming negative impact
                                                                                           from market volatility continues in 2019.

                                                                                          DSIBs+ Profitability (Mostly) Steady In 2019
                                                                    5%                                                                                       18%
                                                                    4%                                                                                       16%
                                                                                                                                                             14%
                                                                    3%
                                                                                                                                                             12%
                                                                    2%                                                                                       10%
                                                                    1%                                                                                       8%
    We expect NIMs to slightly increase in 2019, on
     average across the big banks.                                                                                                                           6%
                                                                    0%
                                                                                                                                                             4%
                                                                    -1%                                                                                      2%
                                                                    -2%                                                                                      0%
                                                                               2015              2016            2017           2018             2019F

                                                                              Average Operating Leverage (LHS)          Return On Equity (RHS)
                                                                              Growth in Operating Revenues (RHS)        Growth In Noninterest Expenses (RHS)
                                                                              Growth In Net Interest Income (RHS)       Growth in Noninterest Income (RHS)
Source: S&P Global Ratings. DSIBs+ is DSIBs plus Laurentian Bank.

                                                                                                                                          Jan. 18, 2019        14
Revenues: Wealth Management & Foreign Operations Increasingly Important

     Since 2012, wealth management (WM) revenues have increased in                          Revenue Contribution By Business Line
      revenue contribution to 21.7% from 18.1%.                                     100%

                                                                                    80%
     We expect these revenues to gain further traction while capital markets
      revenues decline in relative importance.                                      60%

                                                                                    40%
     Foreign revenues are also becoming more important, helped by
      acquisitions that are being progressively integrated--such as those by        20%
      CIBC in the U.S., and BNS in Latin America and the Caribbean.
                                                                                     0%

                                                                                    -20%
                                                                                           BMO          BNS     CM          NA          RY             TD

                                                                                                  P&C    S&T   Wealth     Insurance     Other

                    DSIB Revenue by Activity                                                  DSIB Revenue Trends By Geography
       25%                                                                          70%                                                                     40%
       24%
       23%                                                                          68%                                                                     38%
       22%
       21%                                                                          66%                                                                     36%
       20%
       19%                                                                          64%                                                                     34%
       18%
       17%                                                                          62%                                                                     32%
       16%
       15%                                                                          60%                                                                     30%
                 2012      2013       2014      2015       2016      2017    2018          2014         2015       2016          2017           2018

                   WM / Total Revenues (%)              S&T / Total Revenues (%)                    Canada (LHS)          International (RHS)

    Sources: S&P Global Ratings and company filings. S&T--Sales & trading.

                                                                                                                                    Jan. 18, 2019            15
Digitization To Continue To Lower Input Costs, Offsetting Increased
Cyber-Risk Spending

      $14                     Billion spent on cybersecurity in 2017 by Canadian businesses

      36%                     Business leaders planning to refresh their security architecture for digital transformation

      52%                     Executives in Canada’s financial sector who believe that cyber-risk will be the most
                              disruptive trend in the next 24 months

   We expect further penetration in digital sales, adoption, and self-
    service among all Canadian banks, particularly in mobile banking and                                          DSIBs - Technology Spend
    among smaller Canadian banks that lack the pre-existing                                  15%                                                                     60%
    infrastructure and scale for branch banking.
                                                                                             13%                                                                     58%
   Increased digitization brings its own risks: the big five banks are
                                                                                             11%                                                                     56%
    among the top 100 most-phished brands in North America (according
    to VadeSecure).                                                                           9%                                                                     54%

   Cybersecurity spending thus far has been modest, despite, in 2018,                        7%                                                                     52%
    several high-profile security breaches in large Canadian banks, such
    as BMO, CIBC, and RBC.                                                                    5%                                                                     50%
                                                                                                       2013       2014       2015     2016      2017      2018

   We expect technology spend to continue increasing as companies                                       CES / NIE (LHS)            NIE / Operating Revenues (RHS)
    invest more into their systems and modernize their digital
    architecture.

Sources: S&P Global Ratings, VadeSecure, Statistics Canada, PWC. CES--Computer, equipment, software. NIE--Noninterest expense.
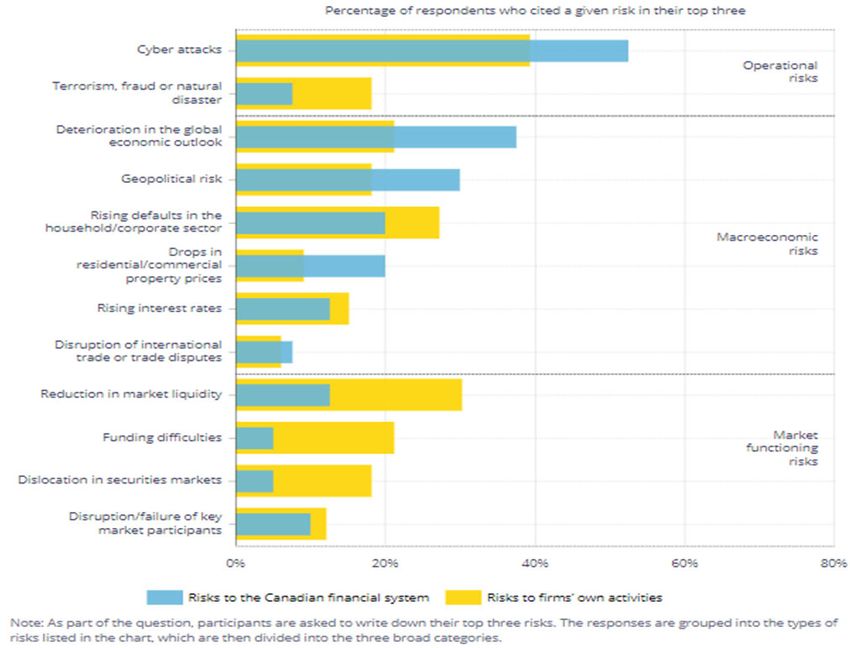
                                                                                                                                                 Jan. 18, 2019         16
Digitization & Cyber-Risk To Remain Top-Of-Mind

 From the Bank of Canada’s Financial System Survey, it appears respondents believe:

 •   Machine learning and artificial intelligence will have the largest impact, of the types of innovation cited, on the operations
     of the Canadian financial services industry in the next three years.

 •   From a market structure perspective, two key innovations--systematic trading strategies and open banking, which allows
     clients to share their banking data with other financial institutions--will have the largest impact.

 •   From a risk perspective, cyber attacks were cited as the biggest threat to the financial system.

                                                                                                                  Jan. 18, 2019   17
Capitalization To Remain Ratings Neutral For Most
                     DSIBs - Average Capital Position                                                           RAC Ratio Distribution, All Rated Canadian
    10.0%                                                                            5.0%
                                                                                                                                  Banks
    9.5%                                                                                       70%
                                                                                     4.5%
    9.0%                                                                                       60%
    8.5%                                                                             4.0%
                                                                                               50%
    8.0%
                                                                                     3.5%
    7.5%                                                                                       40%
    7.0%                                                                             3.0%      30%

                                                                                               20%

                                                                                               10%
                        July 2017 RAC Criteria        ER 3
                                                                                                 0%
                        S&P RAC (LHS)                 S&P Leverage (RHS)                              Adequate (7% - 10%) Strong (10% - 15%) Very Strong (>15%)

    The majority of rated Canadian banks are expected to maintain an adequate RAC ratio during 2019, which is ratings neutral.

    The worsening of the economic risk score to '3' from '2' in 2018, combined with the new assumption that a small (5%) proportion of uninsured RMs are non-
     prime, had a 40 bps-50 bps negative impact on DSIBs RAC ratios, bringing the average down to 8.2% in second-quarter 2018. The effect was more
     pronounced on the smaller Canadian banks (100 bps on average), reflecting both a higher concentration in Canadian exposures and our assumption that the
     proportion of non-prime among uninsured RMs is slightly higher (10%), but the majority of these started from a stronger capital position than the DSIBs. No
     rating actions directly resulted from these changes.

    We expect the DSIB RAC ratios to moderately increase in 2019, in concert with leverage ratios and regulatory capital, as these banks build resources for
     future acquisitions. The impending phase-out of old Tier 1 innovative instruments is not expected to affect our RAC assessments.

    A surprise 25 bps increase in the domestic stability buffer of DSIB capital ratios in December is manageable, with the average Common Equity Tier 1 for
     DSIBs at 11.5%, far above the 9.75% prescribed minimum. We don’t anticipate any impact on DSIBs' S&P Global Ratings RAC figures.

Source: S&P Global Ratings. 2018 RAC average is forecast.

                                                                                                                                                Jan. 18, 2019      18
Oil & Gas Exposures Remain Less Important Than You Might Think
    Crude oil (West Texas Intermediate) prices dropped over 60% in the last four months of 2018, ending at a two-and-a-half year low of $45.4.

    Despite price volatility, risks to banks remain low, as the DSIBs' oil and gas exposure is less than 2% of total loans, and less than 5% of business and government
     loans, on average.

    Asset quality in the sector remains strong as well, with oil and gas NPAs making up less than 2% of oil and gas loans for most banks.

    Western Canadian Select exposure remains low, at about 10% of total oil and gas exposure, with the majority of the exposure being investment-grade.

    Provisions for credit losses (PCLs) in the sector have not been affected by IFRS 9, with most banks posting reduced PCLs year-over-year in energy.

    We expect PCLs overall to increase about 12% in 2019, in-line with the previous year. We could see a spike in PCLs akin to the energy price decline of 2014-2015,
     but, similar to then, modest exposures limit the significance of asset quality concerns.

                    Oil & Gas - Assets & Asset Quality                                                     Oil & Gas Exposure Breakdown
    3.0%                                                                                100%

    2.5%                                                                                 80%

    2.0%                                                                                 60%

    1.5%
                                                                                         40%

    1.0%
                                                                                         20%
    0.5%
                                                                                          0%
    0.0%                                                                                          BMO          BNS          CM          NA          RY           TD
              BMO         BNS          CM           NA           RY      TD
                                                                                               Exploration & Production            Drilling & Services
           Net O&G Loans / Total Loans        Net O&G NPAs / O&G Loans (%)                     Midstream & Downstream (RMD)        Other

Source: S&P Global Ratings. RMD--Refining, marketing, distribution.

                                                                                                                                                  Jan. 18, 2019            19
Underwriting: Trend Toward Lower Insurance (But Lower Loans-to-Value) To
Continue But Decelerate
               Insured Mortgages / Total Mortgages (%)                                        DSIBs - Average Uninsured LTV (%)
    75%                                                                          60%
    70%
    65%                                                                          58%

    60%
                                                                                 56%
    55%
    50%
                                                                                 54%
    45%
    40%
                                                                                 52%
    35%
            2013           2014    2015    2016       2017      2018
                                                                                 50%
               BMO           BNS     CM       NA       RY       TD                         2013    2014      2015      2016      2017      2018

    The proportion of insured mortgages has declined as portfolio insurance falls away.

    Uninsured loan-to-value ratios (LTVs) on the Canadian book were on a slight uptick in 2018 after years of decline, a trend we expect will
     continue into 2019. Uninsured LTVs on new originations averaged around 67% at fourth-quarter 2018.

    On average, uninsured mortgages with high (>75%) LTVs and low (< 650) FICO/Beacon scores have made up less than 1% of uninsured
     mortgages among DSIBs.

    Insured mortgage volumes have historically been low for the smaller banks, and we expect these lenders to issue more uninsured mortgages
     as well.

    We believe the majority of uninsured mortgages outstanding lent by DSIBs have a FICO/Beacon score above (better than) 700.

Source: Company filings.

                                                                                                                              Jan. 18, 2019       20
Asset Quality: Non-Mortgage Consumer Lending To Weaken, Slightly, But
Overall Strength To Remain
             Credit Metrics: All Rated Canadian                                                         NPAs: All Rated Canadian Banks (% Loans)
                           Banks                                                              4.0%

    1.4%                                                                                      3.5%
    1.2%                                                                                      3.0%
    1.0%                                                                                      2.5%
    0.8%
                                                                                              2.0%
    0.6%
    0.4%                                                                                      1.5%
    0.2%                                                                                      1.0%
    0.0%                                                                                      0.5%
                                                                                              0.0%
                                                                                                      2009 2010 2011 2012 2013 2014 2015 2016 2017 2018

                        NCOs (% loans)             NPAs (% loans)                                       Residential RE   C&C    CRE      Other Consumer

NPA – Nonperforming Assets.

    Asset quality has largely remained resilient in the face of growing
     consumer debt and housing prices, with NPAs and NCOs holding                                      NCOs: All Rated Canadian Banks (% Loans)
     steady, or improving, across most segments.                                              1.0%
                                                                                              0.9%
                                                                                              0.8%
    Other consumer debt remains the area with the highest loss rates,
                                                                                              0.7%
     but has been declining since 2017 due to higher recoveries in
                                                                                              0.6%
     various products such as cards and auto.                                                 0.5%
                                                                                              0.4%
    We expect aggregate asset quality to deteriorate slightly in 2019,                       0.3%
     reflecting the increased debt-servicing cost implied by interest                         0.2%
                                                                                              0.1%
     rates, but remain near the stronger end of the past decade’s
                                                                                              0.0%
     performance.                                                                                     2009 2010 2011 2012 2013 2014 2015 2016 2017 2018

                                                                                                        Residential RE   C&C    CRE      Other Consumer

Sources: S&P Global Ratings, company filings. C&C--Corporate and commercial. CRE--Commercial real estate.

                                                                                                                                       Jan. 18, 2019      21
Funding: Incremental Adding Of Bail-In Debt To Continue

                             Canadian Banks – Funding Metrics                                                           Subordinated
                                                                                                                           Debt                 Bank Deposits
    150%                                                                                             105%                   4%                       5%
                                                                                                     100%      Other
    140%                                                                                             95%    Securitization
                                                                                                     90%       16%                     Other           BDNs, CD, CP
    130%                                                                                                                                                  32%
                                                                                                     85%                                2%
                                                                                                     80%        Covered
    120%
                                                                                                     75%         Bonds                2014
    110%                                                                                             70%          10%
                                                                                                     65%
    100%                                                                                             60%            Senior Notes
                                                                                                                                                   ABCP
           2009     2010     2011     2012     2013     2014     2015     2016     2017     2018                        29%
                                                                                                                                                    2%
                      Loans / Deposits (LHS)              S&P Stable Funding Ratio (RHS)
                                                                                                                  DSIBs Wholesale Funding Mix
                      DSIBs - Covered Bonds / Wholesale Funding                                                              Subordinated            Bank
                                                                                                                                Debt                Deposits
                                                                                                                Other            3%                   2%
    15%
                                                                                                             Securitization
    13%                                                                                                          12%                   Other
                                                                                                                                        4%              BDNs, CD,
    11%                                                                                                                                                    CP
    9%                                                                                                        Covered                                     32%
                                                                                                               Bonds
    7%                                                                                                          14%
                                                                                                                                       2018
    5%                                                                                                                Senior
               2014                 2015               2016               2017                2018                    Notes                           ABCP
                                                                                                                       31%                             2%
    Most rated banks enjoy an S&P-calculated stable funding ratio of 100% or more.
    Covered bond issuances have increased 40% on average from five years ago.
    We expect DSIBs to increasingly issue senior resolution notes (following the lead of TD and RBC) without significant disruption to prior
     issuance volumes, nor cost-of-funds.

Sources: S&P Global Ratings, company filings. CDs--Certificates of deposit. CP--Commercial paper. ABCP--
Asset-backed commercial paper. NSFR--Net stable funding ratio.

                                                                                                                                               Jan. 18, 2019        22
Liquidity Unlikely To Improve Much More
                               DSIBs - Liquidity Metrics                                                                                             Cash
                                                                                                                       NHA MBS                       11%
    1.20x                                                                                 140%                           14%                                Bank Deposits
    1.15x                                                                                 135%                                            Other                  3%
                                                                                                                                           2%
    1.10x                                                                                 130%
    1.05x                                                                                 125%                Corporate
                                                                                                               Equity                     2013                  Government
    1.00x                                                                                 120%                  21%                                                Debt
                                                                                                                                         MBS, ABS,                 33%
    0.95x                                                                                 115%
                                                                                                                                           CMO
    0.90x                                                                                 110%                                              2%
                                                                                                                    Corporate Debt
    0.85x                                                                                 105%
                                                                                                                        14%
    0.80x                                                                                 100%
            2009 2010 2011 2012 2013 2014 2015 2016 2017 2018

                     Liquidity Coverage Ratio (RHS)               BLA / ST (LHS)
                                                                                                                              DSIBs Liquid Asset Mix
    All DSIBs have a liquidity coverage ratio of well over 100%, as well as a
     BLA/ST ratio comfortably over 1.0x, despite a slight downward trend in
     2018. Barring further regulatory incentive, we do not expect the banks (as                                                                      Cash
     a group) to significantly improve their liquidity, as rising interest rates                                           NHA MBS                   10%
                                                                                                                             10%
     raise the opportunity cost to holding it.                                                                                                              Bank Deposits
                                                                                                                                          Other                  4%
                                                                                                               Corporate                   2%
    Banks are well-positioned to handle liquidity stresses. In particular, Home                                Equity
     Capital has made significant progress in pulling back from the liquidity                                    15%
     run of 2017.                                                                                                                         2018
    Government securities have become a higher portion of unencumbered                                                              MBS, ABS,                Government
                                                                                                             Corporate Debt            CMO
     liquid asset holdings, a trend we view as positive given the majority of                                                                                    Debt
                                                                                                                 13%                    2%
     holdings in the sub-category are Canadian, U.S., and other highly rated                                                                                     44%
     governments.

Sources: S&P Global Ratings, company filings. BLA/ST--Broad liquid assets to short-term wholesale funding.

                                                                                                                                                     Jan. 18, 2019          23
Related Research
Americas Economic Snapshots, Dec. 21, 2018

Global Banks 2019 Outlook: Bracing For More Volatility, Dec. 3, 2018

Review Of Canadian Bank Resolution Regime Completed; Ratings And Outlooks On Systemically Important Banks
Unchanged, Aug. 16, 2018

Laurentian Bank of Canada Ratings Affirmed; Off CreditWatch; Outlook Negative On Concentrated Mortgage
Exposure, April 27, 2018

Canada Economic Risk Higher On Elevated House Prices And Household Debt And Mortgage Fraud; No Ratings
Affected, Feb. 23, 2018

Canadian Banks Midyear 2018 Outlook: Bail-In, Mortgage Tightening, Tax Reform, And IFRS Affecting The Canadian
Banks, Aug. 17, 2018

How IFRS 9's Expected Credit Loss Framework Will Affect Canadian Banks' Loss Provisioning In 2018 And Beyond,
Dec. 18, 2017

                                                                                                    Jan. 18, 2019   24
Analytical Contacts

Nikola Swann                  Lidia Parfeniuk
Toronto                       Toronto
+1 416 507 2582               +1 416 507 2517
nikola.swann@spglobal.com     lidia.parfeniuk@spglobal.com

Amit Tiwari                   Shameer Bandeally
Toronto                       Toronto
+1 416 507 3224               +1 416 507 3230
amit.tiwari@spglobal.com      shameer.bandeally@spglobal.com

Robert Palombi                Devi Aurora
Toronto                       New York
+1 416 507 2529               +1 212 438 3055
robert.palombi@spglobal.com   devi.aurora@spglobal.com

                                                               Jan. 18, 2019   25
Copyright © 2019 by Standard & Poor’s Financial Services LLC. All rights reserved.

 No content (including ratings, credit-related analyses and data, valuations, model, software or other application or output therefrom) or any part thereof
(Content) may be modified, reverse engineered, reproduced or distributed in any form by any means, or stored in a database or retrieval system,
without the prior written permission of Standard & Poor’s Financial Services LLC or its affiliates (collectively, S&P). The Content shall not be used for
any unlawful or unauthorized purposes. S&P and any third-party providers, as well as their directors, officers, shareholders, employees or agents
(collectively S&P Parties) do not guarantee the accuracy, completeness, timeliness or availability of the Content. S&P Parties are not responsible for
any errors or omissions (negligent or otherwise), regardless of the cause, for the results obtained from the use of the Content, or for the security or
maintenance of any data input by the user. The Content is provided on an “as is” basis. S&P PARTIES DISCLAIM ANY AND ALL EXPRESS OR
IMPLIED WARRANTIES, INCLUDING, BUT NOT LIMITED TO, ANY WARRANTIES OF MERCHANTABILITY OR FITNESS FOR A PARTICULAR
PURPOSE OR USE, FREEDOM FROM BUGS, SOFTWARE ERRORS OR DEFECTS, THAT THE CONTENT’S FUNCTIONING WILL BE
UNINTERRUPTED OR THAT THE CONTENT WILL OPERATE WITH ANY SOFTWARE OR HARDWARE CONFIGURATION. In no event shall S&P
Parties be liable to any party for any direct, indirect, incidental, exemplary, compensatory, punitive, special or consequential damages, costs,
expenses, legal fees, or losses (including, without limitation, lost income or lost profits and opportunity costs or losses caused by negligence) in
connection with any use of the Content even if advised of the possibility of such damages.
Credit-related and other analyses, including ratings, and statements in the Content are statements of opinion as of the date they are expressed and not
statements of fact. S&P’s opinions, analyses and rating acknowledgment decisions (described below) are not recommendations to purchase, hold, or
sell any securities or to make any investment decisions, and do not address the suitability of any security. S&P assumes no obligation to update the
Content following publication in any form or format. The Content should not be relied on and is not a substitute for the skill, judgment and experience of
the user, its management, employees, advisors and/or clients when making investment and other business decisions. S&P does not act as a fiduciary
or an investment advisor except where registered as such. While S&P has obtained information from sources it believes to be reliable, S&P does not
perform an audit and undertakes no duty of due diligence or independent verification of any information it receives.
To the extent that regulatory authorities allow a rating agency to acknowledge in one jurisdiction a rating issued in another jurisdiction for certain
regulatory purposes, S&P reserves the right to assign, withdraw or suspend such acknowledgement at any time and in its sole discretion. S&P Parties
disclaim any duty whatsoever arising out of the assignment, withdrawal or suspension of an acknowledgment as well as any liability for any damage
alleged to have been suffered on account thereof. S&P keeps certain activities of its business units separate from each other in order to preserve the
independence and objectivity of their respective activities. As a result, certain business units of S&P may have information that is not available to other
S&P business units. S&P has established policies and procedures to maintain the confidentiality of certain non-public information received in
connection with each analytical process.
S&P may receive compensation for its ratings and certain analyses, normally from issuers or underwriters of securities or from obligors. S&P reserves
the right to disseminate its opinions and analyses. S&P's public ratings and analyses are made available on its Web sites, www.standardandpoors.com
(free of charge), and www.ratingsdirect.com and www.globalcreditportal.com (subscription), and may be distributed through other means, including via
S&P publications and third-party redistributors. Additional information about our ratings fees is available at www.standardandpoors.com/usratingsfees.
Australia: Standard & Poor's (Australia) Pty. Ltd. holds Australian financial services license number 337565 under the Corporations Act 2001. Standard
& Poor’s credit ratings and related research are not intended for and must not be distributed to any person in Australia other than a wholesale client (as
defined in Chapter 7 of the Corporations Act). STANDARD & POOR’S, S&P and RATINGSDIRECT are registered trademarks of Standard & Poor’s
Financial Services LLC

                                                                                                                                     Jan. 18, 2019        26
You can also read