Canadian Banks Mid-Year Outlook 2020: Navigating Through The Pandemic Cautiously - Aug. 14, 2020 - S&P Global

Page created by Warren Morrison
 
CONTINUE READING
Canadian Banks Mid-Year Outlook 2020: Navigating Through The Pandemic Cautiously - Aug. 14, 2020 - S&P Global
Lidia Parfeniuk
Canadian Banks Mid-Year Outlook 2020:        Shameer Bandeally
                                             Amit Tiwari
Navigating Through The Pandemic Cautiously   Devi Aurora
                                             Felix Winnekens

                                             Aug. 14, 2020
Canadian Banks Mid-Year Outlook 2020: Navigating Through The Pandemic Cautiously - Aug. 14, 2020 - S&P Global
Canadian Banks Mid-Year Outlook 2020 | Contents

 Outlook                                                         3

 Macroeconomic View                                              4

 Capital & Earnings                                              6

 Asset Quality                                                   8

 Consumer Lending                                                10

 Commercial Lending                                              12

 Funding & Liquidity                                             14

 TLAC & ALAC                                                     15

 Related Research                                                16

Data as of Q220 for all DSIBs, as of Q120 for Desjardins Group

                                                                      2
Canadian Banks Mid-Year Outlook 2020: Navigating Through The Pandemic Cautiously - Aug. 14, 2020 - S&P Global
Fundamental Forecast | Strong Balance Sheets
   Worsening                                         Neutral                                                  Improving

                      We expect revenues to decline by 5% year on year in 2020 reflecting pressure on net interest income from
                      ultra low interest rates, and headwinds for some fee income sources. Some offset could result if capital
    Revenues
                      markets hold up in the remainder of the year or if there is partial offset from stronger overall corporate and
                      commercial lending.

                      We expect 2020 expenses to remain relatively stable as certain variable costs have reduced however DSIBs
    Expenses          are absorbing costs associated with COVID-19. Consequently, we expect negative operating leverage for
                      2020.

                      We expect material declines in profitability as net income declines by 30%-50% in 2020 reflecting
                      significantly higher provisions for loan losses. As the economy recovers in 2021, profitability could reverse
   Profitability      its decline, albeit to levels lower than in 2019.

                      We see asset quality metrics deteriorating as higher loan losses emerge particularly from the banks’
                      exposures to high-risk sectors related to the COVID-19 pandemic, including hospitality, restaurants, oil
                      and gas, and certain segments of commercial real estate (CRE) such as retail, and unsecured consumer
  Asset quality       lending with much of the deterioration occurring in 2021. However, the banks’ exposures to these sectors
                      in our view, are manageable.

                      We expect capital ratios to decline from current levels as earnings decline, and higher risk-weighted
                      averages (RWAs) in part reflecting draws on corporate lines and elevated market risk. Still, we expect the
     Capital          DSIBs ‘ risk-adjusted capital (RAC) ratios to remain within our adequate range of 7%-10% in our base case
                      and in our stylized adverse stress scenario.

                      We expect funding trends to remain more or less stable and market access for DSIBs’ issuances to
Funding & liquidity   continue, and for them to maintain appropriate levels of liquidity in the downturn. The various funding
                      programs put in place by central bank helped support funding markets without any major disruptions.

                                                                                                                                       3
Canada’s Economy Faces A Patchy Recovery
–   S&P Global Economics forecasts real GDP will contract 5.9% in 2020 before rising 5.4% in 2021, resulting in a peak-to-
    trough contraction of more than 13%.
–   We expect an economic recovery in two stages: a near term bounce in aggregate demand and employment activity,
    followed by a more gradual protracted, and uneven improvement in the economy.
–   We forecast a near-term correction in house prices down 8.7% year over year, in first-quarter 2021, before starting to
    recover by the end of 2021 as the labor market finds its footing and the pandemic uncertainty fades
–   We expect the economy to still be 2.5% smaller in 2023 compared with the pre-pandemic anticipated size.

Macroeconomic Outlook –                                                             Significant Fiscal Response To COVID-19
Select Economic Indicators                                                          Pandemic By Canada
                           2017       2018      2019       2020f     2021f                             Tax deferrals, loans and other credit measures
                                                                                                       Direct Spending
Real GDP (%)                3.2        2.0        1.7      (5.9)       5.4
                                                                                                  18
                                                                                                  16
CPI (%)                     1.6        2.2        2.0      (0.4)       1.2
                                                                                                  14

                                                                                     (% of GDP)
                                                                                                  12
HPI (% YoY)                 8.9        2.1        2.4      (4.9)       3.3
                                                                                                  10
                                                                                                   8
Unemployment (%)            6.3        5.8        5.7       9.2        7.3
                                                                                                   6
                                                                                                   4
3 Month T-Bill (%)          0.68      1.36       1.66       0.51      0.23
                                                                                                   2
                                                                                                   0
10 Year Bond (%)            1.78      2.28       1.59       0.60      1.09
                                                                                                        Total                Federal                 Provincial*

Source: S&P Global Ratings, Statistics Canada, Bank of Canada, Oxford Economics, *provincial figures estimated from provincial finance departments

                                                                                                                                                                   4
Stable Trends On BICRA Economic and Industry
Risk Scores
– While downside risks associated with high consumer indebtedness and elevated house prices will
  remain key areas of surveillance, we expect the impact on house price correction to be manageable
  and short lived.

                                                                                                               BICRA group ‘2’
                                                                                                               –    Economic Risk trend: 3/Stable
                                                                                                               –    Industry Risk trend: 2/Stable

                                                                                                               Key strengths
                                                                                                               –    High-income, well-diversified,
                                                                                                                    competitive, and resilient economy
                                                                                                               –    Strong industry stability, unified
                                                                                                                    regulatory framework, and deep
                                                                                                                    capital markets
                                                                                                               Key Weaknesses
                                                                                                               –    High household debt and real estate
                                                                                                                    prices. We expect a sharp decline in
                                                                                                                    home prices but short lived.

A BICRA (Banking Industry Country Risk Assessment) is scored on a scale from ‘1’ to ’10’, ranging from the lowest-risk banking systems (group ‘1’) to the
highest-risk (group ‘10’). ER – Economic Risk; IR – Industry Risk. Source: S&P Global Ratings. BICRAs as of July 2020.

                                                                                                                                                            5
Capital Ratios Will Decline Slightly While
Remaining Appropriate For The Ratings
DSIB Capital Metrics
   Q220 RAC                    2020F RAC                   Q220 CET1                       – Our base-case scenario assumes losses
                                                                                             on average of 3x the 2019 losses.
   Adverse CET1                Severely Adverse CET1
 12%
                                                                                           – Our sensitivity analysis indicates
                                                                                             that DSIBs' capital and liquidity levels
                                                                                             have enough strength to endure adverse
 10%
                                                                                             downside scenarios, characterized by
                                                                                             credit losses of up to 1.8% (5x the
   8%                                                                                        average 2019 loss rate).
                                                                                           – Under our adverse stress scenario,
   6%                                                                                        DSIBs' RAC ratios would remain in the
                                                                                             adequate range of 7% - 10%.
   4%                                                                                      – We could take widespread rating actions
                                                                                             if loss rates surpass this level, under our
   2%                                                                                        severely adverse loss scenario (8x the
                                                                                             average 2019 loss rate).
   0%
            BMO         BNS          CM          NA          RY           TD

Sources: S&P Global Ratings and company filings. RAC – Risk-adjusted Capital. CET1 – Common Equity Tier 1 ratio. Adverse & Severely Adverse CET1 projected at
Q420. BMO—Bank of Montreal. BNS—Bank of Nova Scotia. CM—Canadian Imperial Bank of Commerce. NA—National Bank of Canada. RY—Royal Bank of Canada.
TD—Toronto-Dominion Bank.

                                                                                                                                                                6
Profitability To Remain Constrained By Sharply
Higher Provisions
 –    The big drop in earnings year to date is related to sharply higher provisions for loan losses. We don’t expect
      profitability to return to pre-pandemic levels before end of 2021.
 –    We expect domestic NIMs to remain under pressure in the ultra low interest rate environment and for interest
      rates to remain near zero. We believe that NII will stabilize by 2021 reflecting growth in high-yielding corporate
      loans.
 –    DSIBs’ productivity ratios are holding up; however, there are fewer opportunities to reduce costs meaningfully to
      offset the impact from lost revenues.

Low Rates The New Norm                                                                                                    DSIB Profit Metrics

           DSIB Domestic NIM (LHS)                                         BoC Overnight Rate (RHS)                                              Revenue     Net Income        Productivity
           10 Year Bond Yield (RHS)                                        Mortgage Rate (RHS)                                          14,000                                                     80%
 2.65%                                                                                                            3.50%                 12,000                                                     70%
                                                                                                                  3.00%                 10,000                                                     60%
 2.60%

                                                                                                                            $CAD Mil.
                                                                                                                  2.50%                                                                            50%
                                                                                                                                         8,000
 2.55%                                                                                                            2.00%                                                                            40%
                                                                                                                                         6,000
 2.50%                                                                                                            1.50%                                                                            30%
                                                                                                                                         4,000                                                     20%
                                                                                                                  1.00%
 2.45%                                                                                                                                   2,000
                                                                                                                  0.50%                                                                            10%
 2.40%                                                                                                            0.00%                     0                                                      0%
                                                                                                                                                 Q1 Q2 Q1 Q2 Q1 Q2 Q1 Q2 Q1 Q2 Q1 Q2
           Q2 17
                   Q3 17
                           Q4 17
                                   Q1 18
                                           Q2 18
                                                   Q3 18
                                                           Q4 18
                                                                   Q1 19
                                                                            Q2 19
                                                                                    Q3 19
                                                                                            Q4 19
                                                                                                    Q120
                                                                                                           Q220

                                                                                                                                                 BMO   BNS      CM        NA       RY         TD
Sources: S&P Global Ratings and company filings. NIM – net interest margin.
BoC –bank of Canada. NII – Net interest income.
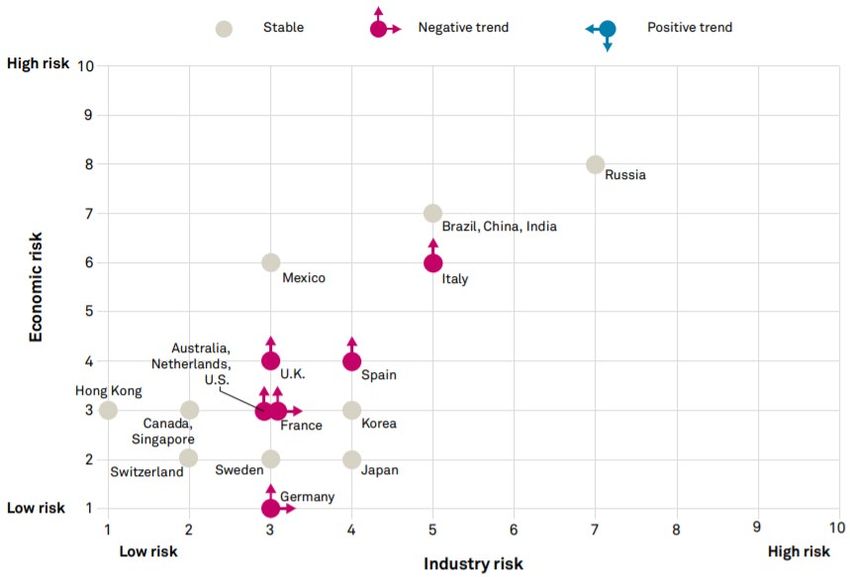
                                                                                                                                                                                                         7
Asset Quality To Weaken Though The Banks Have
Sufficient Cushion For Much Higher Loan Losses
DSIB Asset Quality
                Adj. NPAs (% Loans)                    NCOs (% Average Loans)
                                                                                                 – We believe credit losses will rise, albeit
                                                                                                   from low levels, and will peak in 2021 at
                LLRs / Adj. NPAs (%) (RHS)
                                                                                                   about 70 basis points (bps).

1.2%                                                                                      140%
                                                                                                 – These rates exceed losses recorded
                                                                                                   during the global financial crisis (58bps)
                                                                                          120%     and reflect exposure to high risk sectors
1.0%
                                                                                                   including oil and gas, CRE, as well in
                                                                                          100%     unsecured consumer lending.
0.8%
                                                                                                 – We believe expected losses will be
                                                                                          80%
                                                                                                   manageable from an earnings and
0.6%
                                                                                          60%
                                                                                                   capital perspective.
0.4%                                                                                             – Losses will be deferred to 2021 as most
                                                                                          40%      deferral programs won’t end for another
0.2%
                                                                                                   few months.
                                                                                          20%
                                                                                                 – The average allowance is 80 bps of loans;
0.0%                                                                                      0%       however, if we exclude low risk insured
                                                                                                   mortgages, the coverage improves to an
         2012

                  2013

                         2014

                                2015

                                       2016

                                              2017

                                                     2018

                                                            2019

                                                                   Q220

                                                                          2020F

                                                                                  2021F

                                                                                                   allowance of 90 bps.

Sources: S&P Global Ratings and company filings. NPAs – Nonperforming assets. NCOs – Net chargeoffs. LLRs – loan loss reserves. RHS – Right-hand side.

                                                                                                                                                         8
High-Risk Sectors Will Generate Higher Losses,
But Should Be Manageable Overall
High-Risk Sector Exposure (% Total Loans)

              CRE     HL&E      Retail & Trade    Transport    Oil & Gas
                                                                                  – DSIBs’ exposure to high risk sectors is on
 12%
                                                                                    average under 5%-10% of their
 10%
                                                                                    wholesale loan portfolios, including
  8%
  6%
                                                                                    media, entertainment, leisure, tourism,
  4%
                                                                                    hospitality, retail, restaurants, oil and
  2%
                                                                                    gas, retail CRE, and transportation.
  0%                                                                              – We expect significantly higher loan
           BMO          BNS          CM          NA           RY           TD
                                                                                    losses from these sectors though we
                                                                                    believe that DISBs are well-positioned to
Deferred Loans (% Total Loans)                                                      absorb much higher loan losses.
 18%
 16%
 14%                                                                              – Deferrals – which have been
 12%                                                                                concentrated in residential mortgages,
 10%
  8%                                                                                followed by commercial loans – have
  6%                                                                                slowed since early April.
  4%
  2%                                                                              – We believe that there is a possibility of
  0%
           BMO          BNS          CM          NA           RY           TD       further payment extensions as the banks
Source: S&P Global Ratings, company filings. CRE – Commercial Real Estate. HL&E
                                                                                    continue to work with their customers.
–Hospitality, leisure, and entertainment.

                                                                                                                                 9
Mortgages & HELOCs Loan Losses To Remain Low

DSIB RESL Portfolio

         NPAs (% RESL Loans) LHS         NCOs (% RESL Loans) RHS        PCLs (% Total PCLs) RHS
                                                                                                         –   We expect credit losses in DSIBs’ mortgage
                                                                                                             portfolios, which represent 40% of loans
 0.7%                                                                                            2.0%
                                                                                                             on average, to remain modest.
                                                                                                         –   We expect credit losses from a potential
 0.6%                                                                                                        correction in home prices to be cushioned
                                                                                                 1.5%        by the substantial borrower equity within
 0.5%                                                                                                        the uninsured residential mortgage loans
                                                                                                             (conservative loan to values (LTVs) of high
                                                                                                             40% to mid 50% range), strong credit
                                                                                                 1.0%
 0.4%                                                                                                        underwriting (including stress testing), and
                                                                                                             sizable level of income- support from the
                                                                                                             government’s generous fiscal support.
 0.3%
                                                                                                 0.5%    –   We expect losses in the mortgage book to
                                                                                                             remain consistent with our view of a short-
 0.2%                                                                                                        lived correction phase in the housing
                                                                                                             markets.
                                                                                                 0.0%
 0.1%                                                                                                    –   We expect HELOCs to show slightly higher
                                                                                                             loan losses than conventional mortgages;
                                                                                                             however, they are mostly first lien and
 0.0%                                                                                            -0.5%       benefit from similar conservative LTVs.
            BMO          BNS          CM          NA          RY           TD          DG
Sources: S&P Global Ratings and company filings. NPAs – nonperforming assets. NCOs – net
chargeoffs. PCLs – provision for credit losses. DG PCLs not disclosed. . DG— Federation des caisses
Desjardins du Quebec (Desjardins Group).

                                                                                                                                                        10
Unsecured Consumer Losses Could Rise Sharply
 Other Consumer Asset Quality                                      DSIBs – Other Consumer Loan Growth

               OC NPAs (% OC Loans)    OC NCOs (% OC Loans)                        Credit Cards       HELOC         Other Personal

2.5%                                                                15%

2.0%                                                                10%

                                                                     5%
1.5%
                                                                     0%
1.0%
                                                                    -5%

0.5%                                                               -10%

                                                                   -15%
0.0%
                                                                            2012   2013   2014    2015   2016   2017   2018    2019 Q2 20
         BMO      BNS       CM        NA     RY       TD      DG

                                                                    Source: S&P Global Ratings, company filings. NPAs – nonperforming assets.
                                                                    NCOs – net chargeoffs. OC – Other Consumer which includes cards and auto loans.

 –     We expect losses in unsecured consumer lending portfolios, including cards and auto, to rise meaningfully
       because during times of stress consumers tend to wait to pay off their credit card bills and defer on auto loan
       payments.
 –     Unsecured consumer loans represent on average 11% of DSIBs’ total loans, and the average compounded growth
       rate was 4% from 2012 to 2019.
 –     Indirect consumer exposure to oil and gas producing provinces is manageable though we expect losses to be much
       higher.

                                                                                                                                             11
Higher Risk Property Types Within CRE Could
Suffer
DSIB CRE Portfolio

   CRE Loans (% Total) LHS     CRE NPAs (% CRE Loans) RHS       CRE PCLs (% Total PCLs) RHS   –   The overall exposure to CRE and
                                                                                                  construction lending at about 9% of
                                                                                                  DSIBs’ loans (on average) is manageable.
 12%                                                                                   2.5%
                                                                                              –   Condo exposures are about 9%-10% of
                                                                                                  total CRE among DSIBs.
 10%
                                                                                       2.0%   –   The CRE portfolios are also well-
                                                                                                  diversified by geography and property
                                                                                                  type and exposure to construction
  8%
                                                                                                  lending is limited.
                                                                                       1.5%
                                                                                              –   Non-performing assets have averaged
  6%                                                                                              less than 1% of CRE loans and provisions
                                                                                                  for credit losses (PCLs) are less than 2%
                                                                                       1.0%       of DSIBs PCLs so far this year, with the
  4%                                                                                              exception of BMO.
                                                                                              –   However, several CRE property types
                                                                                       0.5%       (such as retail, hospitality, and office
  2%
                                                                                                  space) will continue to remain at high
                                                                                                  risk from social distancing for a relatively
                                                                                                  long time and could suffer structurally.
  0%                                                                                   0.0%
            BMO          BNS          CM           NA            RY           TD

Sources: S&P Global Ratings and company filings. NPAs – nonperforming assets. NCOs – net
chargeoffs. PCLs – provision for credit losses.

                                                                                                                                            12
Despite Modest Exposures, Oil And Gas Contribute
Heavily To Credit Migrations
 –      DISIBs’ oil and gas exposures are the most immediately vulnerable from a credit standpoint.
 –      The very sharp decline in oil prices has severely affected the sector. However, DSIBs’ exposure to oil and gas at
        2.2% of total loans in our view is very modest.
 –      As a result of the slew of oil and gas loan migrations in the banks’ portfolios, provisions for loan losses rose nearly
        450% on average in second quarter from the first quarter.
 –      Roughly 40% of the energy book is investment grade with the bulk of exposures in the exploration and production
        sector. The credit profiles of DSIBs’ oil and gas loan portfolios have improved since 2015-2016 when oil prices
        dropped sharply.

Oil & Gas – Asset & Asset Quality                                           Breakdown of O&G Exposures
                                                                             Other                            Midstream & Downstream (RMD)
         Net O&G Loans / Total Loans     Net O&G NPAs / O&G Loans (%)        Drilling & Services              Exploration & Production
 4.5%                                                                       120%
 4.0%
 3.5%
                                                                            100%
 3.0%                                                                        80%
 2.5%
 2.0%                                                                        60%
 1.5%                                                                        40%
 1.0%
 0.5%                                                                        20%
 0.0%                                                                         0%
            BMO        BNS        CM          NA         RY            TD             BMO          BNS   CM      NA       RY      TD
Source: S&P Global Ratings, company filings. O&G – Oil & Gas. NPAs –
nonperforming assets.

                                                                                                                                       13
Funding Is Stable And Liquidity Remains High
 –     Funding for DSIBs has been stable, helped by the extensive measures put in place by the Bank of Canada to avoid
       any disruptions in the funding markets and continued international receptivity for the Canadian banks’ issuances.
 –     DSIBs entered the downturn with solid balance sheets with about half of their deposits viewed as core customer
       deposits, and with conservative, highly rated, and liquid investment portfolios.
 –     DSIBs deposits grew as some corporates recycled a good proportion of their draws as deposits. We expect deposit
       growth to remain relatively strong this year, but could decelerate next year.

DSIBs – Funding Metrics                                                          DSIBs – Liquidity Metrics

           Loans / Deposits (LHS)         S&P Stable Funding Ratio (RHS)                     Liquidity Coverage Ratio (RHS)     BLA / ST (LHS)

 130%                                                                    102%     1.30x                                                          140%
                                                                         100%     1.25x                                                          135%
 125%
                                                                         98%      1.20x
                                                                                                                                                 130%
 120%                                                                    96%      1.15x
                                                                                  1.10x                                                          125%
                                                                         94%
 115%                                                                             1.05x                                                          120%
                                                                         92%
                                                                                  1.00x                                                          115%
 110%                                                                    90%
                                                                                  0.95x
                                                                         88%                                                                     110%
 105%                                                                             0.90x
                                                                         86%                                                                     105%
                                                                                  0.85x
 100%                                                                    84%      0.80x                                                          100%
          2012 2013 2014 2015 2016 2017 2018 2019 2020                                    2015     2016      2017      2018   2019   2020 Q2
                                                   Q2

Source: S&P Global Ratings, company filings. BLA / ST – Broad liquid assets to
short-term wholesale funding.

                                                                                                                                                    14
TLAC & ALAC – Banks Are Well Positioned On Both
Ends
TLAC Breakdown & Ratios
                        CET1                       Additional Tier 1                   –   At mid-year 2020, DSIBs’ average regulatory total loss
                        Tier 2                     Other TLAC                              absorbing capacity (TLAC) and TLAC leverage ratios
                        TLAC Ratio (%)             TLAC Leverage (%)
                                                                                           stood at 21% and 6.4%, respectively.
            120                                                        26%
                                                                       24%             –   We expect DSIBs to comfortably reach the minimum
            100                                                        22%                 requirements on TLAC of 22.50% (of risk weighted
                                                                       20%
                                                                       18%                 assets) and TLAC leverage of 6.75% by Nov. 1, 2021.
            80
$CAD Bil.

                                                                       16%
                                                                       14%             –   We continue to view the Canadian government as
            60
                                                                       12%                 “supportive,” however, should our views change to
                                                                       10%
            40                                                         8%                  support “uncertain,” we believe DSIBs will be well-
                                                                       6%                  positioned to receive an ALAC notch equivalent to
            20                                                         4%
                                                                       2%                  their notching for extraordinary government support,
             0                                                         0%                  which would be neutral from a ratings perspective.
                  BMO     BNS      CM    NA   RY       TD      DG

                                              BMO             BNS                CM                 NA                 RY        TD         DG
 Anchor                                       a-             bbb+                 a-                 a-                a-        a-         a-
 SACP                                          a               a                  a-                 a-                a+        a+         a
 Sys. Importance                              +1               +1                +2                 +1                 +1        +1         +1
 Potential ALAC Uplift                        +1               +1                +2                 +2                 +1        +1         +1
 ICR                                          A+               A+                A+                  A                 AA-       AA-        A+
 Bail-In Debt2                                A-               A-               BBB+              BBB+                  A        A          A-
Sources: S&P Global Ratings, company filings. TLAC – total loss absorbing capacity. ALAC – additional loss absorbing capacity.

                                                                                                                                                    15
Canadian Bank Mid-Year Outlook 2020 | Related
Research
– Canadian House Prices Are Likely To Decline Sharply Into Next Year; Strong Fundamentals Restrain
  Broader Housing Market Risks For Now, July 16, 2020
– Canada’s Economy Faces A Patchy Recovery, June 29, 2020
– Banking Industry Country Risk Assessment Update, June 26, 2020
– Laurentian Bank of Canada Affirmed At ‘BBB’; Outlook Remains Negative on Weak Earnings Capacity,
  June 10, 2020
– North American Financial Institutions Monitor 2Q 2020, May 15, 2020
– HSBC Holdings Ratings Lowered To ‘A-/A-2’ On Muted Earnings Prospects And Extensive
  Restructuring; Outlook Stable, May 13, 2020
– Canadian Banks Are Set To Face COVID-19 Related Headwinds From A Position of Strength, Apr. 16,
  2020
– U.S. Banking Outlook, Jan. 13, 2020
– Banking Industry Country Risk Assessment: Canada, Jan. 2, 2020
–   Global Banking Outlook, Nov. 19, 2019

                                                                                                     16
Appendix: Ratings – Stable Ratings In Our Base Case
                                                                  Adjustments from the Anchor:

                          Very Weak (-5)      Weak (-2)     Moderate (-1)      Avg & Adeq (0)      Strong (+1)     Very Strong (+2)

                                            Business         Capital &        Risk                Funding &                       Systemic
                               Anchor                                                                                 SACP                           ICR & Outlook
                                            Position         Earnings        Position           Liquidity (F&L)                  Importance

 Bank of Montreal                 a-        Adequate        Adequate          Strong             Avg. & Adeq.           a             High            A+/Stable

 Bank of Nova Scotia            bbb+          Strong        Adequate          Strong             Avg. & Adeq.           a             High            A+/Stable

 Canadian Imperial
                                  a-        Adequate        Adequate         Adequate            Avg. & Adeq.           a-            High            A+/Stable
 Bank of Commerce

 Fédération des
 caisses Desjardins du            a-        Adequate          Strong         Adequate            Avg. & Adeq.           a         Moderate            A+/Stable
 Québec

 National Bank of
                                  a-        Adequate        Adequate         Adequate            Avg. & Adeq.           a-        Moderate             A/Stable
 Canada

 Royal Bank of Canada             a-          Strong        Adequate          Strong             Avg. & Adeq.           a+            High            AA-/Stable

 Toronto-Dominion
                                  a-          Strong        Adequate          Strong             Avg. & Adeq.           a+            High            AA-/Stable
 Bank

Source: S&P Global Ratings. SACP--Stand-alone credit profile. ICR--Issuer credit rating. Avg & Adeq.--Average & Adequate. *Holding company rating.

                                                                                                                                                                   17
Analytical Contacts

Lidia Parfeniuk                Shameer Bandeally                Amit Tiwari
Director                       Associate Director               Ratings Analyst
Toronto                        Toronto                          Toronto
+1-416-507-2517                +1-416-507-3230                  +1-416-507-3224
lidia.parfeniuk@spglobal.com   shameer.bandeally@spglobal.com   amit.tiwari@spglobal.com

Devi Aurora                    Satyam Panday                    Felix Winnekens
Analytical Manager             Senior Economist                 Director
New York                       New York                         New York
+1-212-438-3055                +1-212-438-6009                  +1-212-438-0313
devi.aurora@spglobal.com       satyam.panday@spglobal.com       felix.winnekens@spglobal.com

                                                                                           18
Copyright © 2020 by Standard & Poor's Financial Services LLC. All rights reserved.

No content (including ratings, credit-related analyses and data, valuations, model, software or other application or output therefrom) or any part thereof (Content) may be modified,
reverse engineered, reproduced or distributed in any form by any means, or stored in a database or retrieval system, without the prior written permission of Standard & Poor’s Financial
Services LLC or its affiliates (collectively, S&P). The Content shall not be used for any unlawful or unauthorized purposes. S&P and any third-party providers, as well as their directors,
officers, shareholders, employees or agents (collectively S&P Parties) do not guarantee the accuracy, completeness, timeliness or availability of the Content. S&P Parties are not
responsible for any errors or omissions (negligent or otherwise), regardless of the cause, for the results obtained from the use of the Content, or for the security or maintenance of any
data input by the user. The Content is provided on an “as is” basis. S&P PARTIES DISCLAIM ANY AND ALL EXPRESS OR IMPLIED WARRANTIES, INCLUDING, BUT NOT LIMITED TO, ANY
WARRANTIES OF MERCHANTABILITY OR FITNESS FOR A PARTICULAR PURPOSE OR USE, FREEDOM FROM BUGS, SOFTWARE ERRORS OR DEFECTS, THAT THE CONTENT’S
FUNCTIONING WILL BE UNINTERRUPTED OR THAT THE CONTENT WILL OPERATE WITH ANY SOFTWARE OR HARDWARE CONFIGURATION. In no event shall S&PParties be liable to any
party for any direct, indirect, incidental, exemplary, compensatory, punitive, special or consequential damages, costs, expenses, legal fees, or losses (including, without limitation, lost
income or lost profits and opportunity costs or losses caused by negligence) in connection with any use of the Content even if advised of the possibility of such damages.

Credit-related and other analyses, including ratings, and statements in the Content are statements of opinion as of the date they are expressed and not statements of fact. S&P’s
opinions, analyses and rating acknowledgment decisions (described below) are not recommendations to purchase, hold, or sell any securities or to make any investment decisions, and
do not address the suitability of any security. S&P assumes no obligation to update the Content following publication in any form or format. The Content should not be relied on and is
not a substitute for the skill, judgment and experience of the user, its management, employees, advisors and/or clients when making investment and other business decisions. S&P
does not act as a fiduciary or an investment advisor except where registered as such. While S&P has obtained information from sources it believes to be reliable, S&P does not perform
an audit and undertakes no duty of due diligence or independent verification of any information it receives.

To the extent that regulatory authorities allow a rating agency to acknowledge in one jurisdiction a rating issued in another jurisdiction for certain regulatory purposes, S&P reserves the
right to assign, withdraw, or suspend such acknowledgement at any time and in its sole discretion. S&P Parties disclaim any duty whatsoever arising out of the assignment, withdrawal,
or suspension of an acknowledgment as well as any liability for any damage alleged to have been suffered on account thereof.

S&P keeps certain activities of its business units separate from each other in order to preserve the independence and objectivity of their respective activities. As a result, certain
business units of S&P may have information that is not available to other S&P business units. S&P has established policies and procedures to maintain the confidentiality of certain
nonpublic information received in connection with each analytical process.

S&P may receive compensation for its ratings and certain analyses, normally from issuers or underwriters of securities or from obligors. S&P reserves the right to disseminate its
opinions and analyses. S&P's public ratings and analyses are made available on its Web sites, www.standardandpoors.com (free of charge), and www.spcapitaliq.com (subscription)
and may be distributed through other means, including via S&P publications and third-party redistributors. Additional information about our ratings fees is available at
www.standardandpoors.com/usratingsfees.

Australia: S&P Global Ratings Australia Pty Ltd holds Australian financial services license number 337565 under the Corporations Act 2001. S&P Global Ratings' credit ratings and
related research are not intended for and must not be distributed to any person in Australia other than a wholesale client (as defined in Chapter 7 of the Corporations Act).

STANDARD & POOR'S, S&P and RATINGSDIRECT are registered trademarks of Standard & Poor's Financial Services LLC.

spglobal.com/ratings

                                                                                                                                                                                           19
You can also read