Canadian Natural Corporate Presentation - June 2021 - Canadian Natural Resources
←
→
Page content transcription
If your browser does not render page correctly, please read the page content below
Canadian Natural
                   Corporate Presentation
                                June 2021
Delivering Value & Growth

SNAPSHOT                                                                                2021F                  2020                 2019
Capital expenditures – net (C$ million)(1)                                             $3,205               $2,701               $3,904

Annualized dividend (C$/share)(2)                                                        $1.88                $1.70                $1.50

Production (annual average, before royalties)

   Natural gas (MMcf/d)                                                      1,620 - 1,680                    1,477                1,491

   Crude Oil (Mbbl/d)                                                              920 - 980                     918                  850

   BOE (MBOE/d)                                                              1,190 - 1,260                    1,164                1,099

Company Gross Reserves, before royalties, of crude oil and natural gas
(as at December 31, 2020)

   Proved crude oil and NGLs (MMbbl)                                                                        10,528                 9,917

   Proved natural gas (Bcf)                                                                                   9,465                6,460

   Proved BOE (MMBOE)                                                                                       12,106               10,993

   Proved and probable BOE (MMBOE)                                                                          15,925               14,252

   (1) 2019 excludes costs related to the Devon Canada asset acquisition which closed on June 27, 2019; 2020 excludes costs related to the
   Painted Pony Energy Ltd. corporate acquisition which closed on October 6, 2020.
   (2) 2019 based on the quarterly dividend of $0.375 per common share; 2020 based on the quarterly dividend of $0.425 per common share; 2021
   based on the quarterly dividend of $0.47 per common share.
   Note: See Advisory for pricing assumptions and cautionary statements.

   TABLE OF CONTENTS
   • Canadian Natural Advantages & Q1/21 Operational Highlights                                                     Page 1
   • Balanced, Diverse, Long Life Low Decline Portfolio                                                             Page 2 - 3
   • Significant Investment Opportunity                                                                             Page 3 - 7
   • Financial Strength – Q1/21 Financial Highlights                                                                Page 8 - 14
   • Asset Overview                                                                                                 Page 15 - 26
   • Environmental, Social & Governance                                                                             Page 26 - 33
Corporate Presentation June 2021
Canadian Natural Advantages
Large, Long Life Low Decline Asset Base
Diversified Asset Base & Product Mix
Flexible Capital Allocation / Effective & Efficient Operations
Low Maintenance Capital
Leading Free Cash Flow Generation
CANADIAN NATURAL’S COMPETITIVE ADVANTAGES 2
Canadian Natural
Q1/21 Quarterly Operational Highlights
• Record BOE production of ~1,246 MBOE/d 6% increase over Q1/20
• Record liquids production of ~979,400 bbl/d 4% increase over Q1/20
‒ Record Oil Sands Mining and Upgrading production of ~468,800 bbl/d of SCO 7% increase over Q1/20
‒ NA E&P liquids, including thermal in situ production of ~478,700 bbl/d 5% increase over Q1/20
• Strong natural gas production of ~1.6 Bcf 11% increase over Q1/20
• Continued focus on operating costs
‒ Oil Sands Mining and Upgrading operating costs are top tier $19.82/bbl of SCO(US$15.66/bbl)(1)
Decreased 5% from Q1/20 levels
Increase SCO sales by ~41,000 bbl/d absolute dollar operating costs essentially flat(2)
‒ NA E&P liquids, including thermal in situ, operating costs were strong $12.80/bbl (US$10.11/bbl)(1)
(1) US$ operating costs based upon Q1/21 quarterly average FX of US$1.00 to C$1.2658.
(2) Comparing to Q1/20 levels, excluding energy costs.
SAFE, SUSTAINABLE, EFFECTIVE & EFFICIENT OPERATIONS 3
1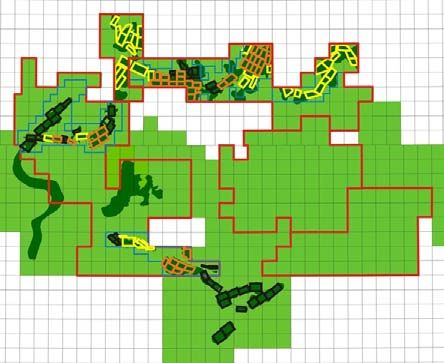
Corporate Presentation                                                                                                                                                              June 2021

        Balanced, Diverse Portfolio

                                                                                      • Balanced, diverse production mix
                                                 North
                                                  Sea                                      ‒ Long Life Low Decline production                  ~81% of liquids
        North America
                                                                                      •   International Brent exposure
                                                                                      •   Vast, balanced resource base to develop
                                                                                      •   Light crude oil and SCO production ~48% of BOE
                                                                                      •   Natural gas ~22% of BOE
                                               Offshore
                                                   Africa

                                                                                                             2021B*
                                                                          BOE Production Mix                                   Liquids Production Mix
                                                                 Natural Gas                                                                                   Conventional &
                                                                       ~22%                             Oil Sands                                              Unconventional
                                                                                                        Mining & Upgrading                                     ~19%
                                                                                                        (SCO) ~38%
                     2021B production
                     ~1,225 MBOE/D*                                                                                     Long Life
                                                                                                                      Low Decline
                                                                      Heavy                                                ~81%
                                                                   Crude Oil                        Light Crude
                                                                      ~30%                          Oil & NGLs ~10%
                 *Based upon mid-point of targeted 2021B production.

                                                            BALANCED PRODUCT MIX PROVIDES FLEXIBILITY                                                                                4

        Canadian Natural’s Assets are Unique
        Robust Through All Cycles
                                                                    • Long life low decline assets provide sustainable
                                                                      production and free cash flow even in lower
                                                                      price environment                                      • Ability to ramp up production
                                                                                                                               faster with improving prices
                                                                    • Exercising capital flexibility by reducing spend
                                        • Low capital exposure        on low capital exposure assets                         • Stronger balance sheet
                                          production grows          • Balance sheet remains strong through the cycle

                                                                                                                 Low Capital Exposure Production

                                               Commodity Price
                                                                                                                                                                  Commodity Price
                    Production Rate

                                                                                                                  Long Life Low Decline Production

                                      Time

                                                     MAXIMIZES CORPORATE ASSET VALUE & FREE CASH FLOW                                                                                5

                                                                                            2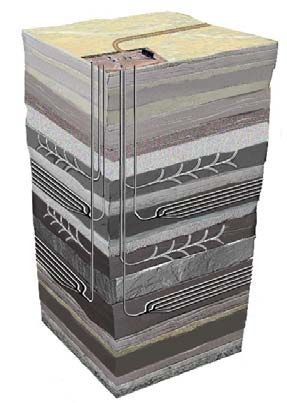
Corporate Presentation                                                                                                                                        June 2021

        Canadian Natural’s Advantage
        Low Corporate Decline Rate

             2021B BOE Production Mix

                                  Oil Sands Mining
                                    & Upgrading                             Long Life
                                                                            Low Decline
                                   ~0% Decline                              Production ~63%
               Pelican &
               Thermal
             ~13% Decline                                                                                                                    ~10% Corporate
                                                                                                                                              Decline Rate
                                  Conventional &
                                  Unconventional                           Conventional &
                                  ~19% Decline                             Unconventional
                                                                           Production ~37%

            Note: Conventional & Unconventional assets include North America crude oil and NGLs, International crude oil and natural gas.

                                                        TOP TIER SUSTAINABLE BUSINESS MODEL                                                                    6

        1P Reserves After Royalties
        2020

                                                                                                                                 ~61% of reserves are
                                                                                                                                   high value SCO

                                                                                                                     Reserve Life Index ~30 plus years*

            0                                5,000                              10,000                              15,000                       20,000
                                                                                                                                            (MMBOE)
                                                                                    Global Peers
            Peers include: BP, COP, CVX, FP, RDS, SU and XOM.
            *Reserve Life Index based upon 2020 Net Proved reserves, based on SEC constant prices and costs over 2020 average net production.
            Source: 2020 Net Proved reserves, based on SEC constant prices and costs, per company reports.

                                                  SIGNIFICANT RESERVES ON A GLOBAL SCALE                                                                       7

                                                                                            3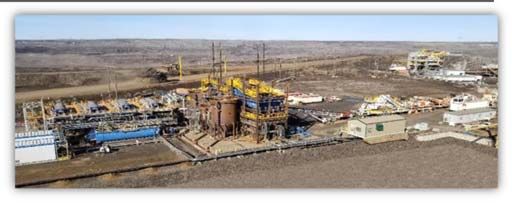
Corporate Presentation June 2021
Net Debt to Reserves
2020
(US$/BOE)
$10.00
$8.00
$6.00
Peer Average
$4.00
$2.00
$0.00
Global Peers
Source: Company reports. Peers include BP, COP, CVX, FP, RDS, SU and XOM.
TOP DECILE FINANCIAL POSITION 8
Free Cash Flow Yield
2021F
(%)
24%
World class long life low decline assets
Disciplined capital low maintenance capital
20%
Top tier effective and efficient operations
16%
Peer Average
12%
8%
4%
Free Cash Flow
$7,900 $5,700 $21,400 $16,700 $8,400 $20,000 $5,900 $22,200
($US million)
Global Peers
Source: RBC Global Integrated & E&P Comparative Valuation - April 22, 2021. Peers include BP, COP, CVX, FP, RDS, SU and XOM. RBC defines free cash flow as
operating cash flow less gross capital expenditures.
LEADING FREE CASH FLOW YIELD 9
4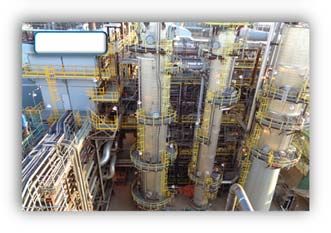
Corporate Presentation                                                                                                                     June 2021

        Debt to Cash Flow
        2021F
            (x)
            2.2

            1.8

            1.4                         Peer Average

            1.0

            0.6

            0.2

                                                                                  Global Peers
            Source: RBC Global Integrated & E&P Comparative Valuation - April 22, 2021. Peers include BP, COP, CVX, FP, RDS, SU and XOM.

                                                               STRONG FINANCIAL POSITION                                                   10

        Enterprise Value to Debt Adjusted Cash Flow
        2021F
            (x)
            9.0

                                                Canadian Natural is a significant
            8.0
                                                    investment opportunity
            7.0

            6.0                                                     Peer Average

            5.0

            4.0

            3.0

                                                                                  Global Peers
            Source: RBC Global Integrated & E&P Comparative Valuation - April 22, 2021. Peers include BP, COP, CVX, FP, RDS, SU and XOM.

                                        SIGNIFICANT UPSIDE TO CURRENT TRADING MULTIPLE                                                     11

                                                                                       5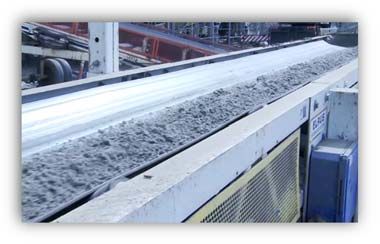
Corporate Presentation                                                                                                                                               June 2021

        Canadian Natural
        2021 Budget
       Capital Expenditures ($ million)                                                                           2020                    2021B
       Total(1)                                                                                                 $2,701                    $3,205

                    2021B Maintenance Capital                           ~$3.0 billion                 2021B Growth Capital                 ~$200 million

       Targeted Production                                                                                          2020                  2021B      % Change(2)
         Natural Gas (MMcf/d)                                                                                     1,477            1,620 - 1,680               ~12%
         Total Liquids (Mbbl/d)(3)                                                                                       918            920 - 980                   ~3%
        Total MBOE/d                                                                                              1,164            1,190 - 1,260                    ~5%

             (1) 2020 excludes net acquisition costs.
             (2) Percent change of 2021B midpoint over 2020.
             (3) Reflects planned downtime for turnaround activities and Canadian Natural’s 70% ownership in the AOSP.
             Note: Rounded to the nearest 1,000 bbl/d. Numbers may not add due to rounding.

                                                 TARGETED 2021 PRODUCTION GROWTH OF ~5%                                                                               12

        Capital Discipline

       • Balance and optimize the four pillars of capital allocation
          ‒ Flexible capital allocation maximizes shareholder value
                                                                                                                               Maximizing
       • Maintain balance sheet strength                                                                                     Shareholder Value
          ‒ Maintain investment grade credit ratings
       • Sustainable and growing dividend
                                                                                                   Balance                               Resource
                                                                                                                          Returns to                Opportunistic
                                                                                                    Sheet                                 Value
       • Maintain disciplined capital budget                                                       Strength              Shareholders     Growth
                                                                                                                                                    Acquisitions

          ‒ Low maintenance capital requirements
       • Opportunistic acquisitions
          ‒ Must add value

                                                             MAXIMIZING SHAREHOLDER VALUE                                                                             13

                                                                                           6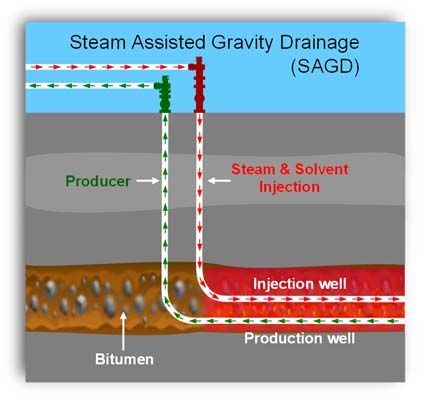
Corporate Presentation                                                                                                                              June 2021

        Operational Excellence

       • Area knowledge, extensive infrastructure and operatorship

       • Top tier effectiveness and efficiency

       • Strong history of capturing margin growth opportunities

       • Process optimization and improvement

       • Technology and innovation

       • Economies of scale

                                   STRONG HISTORY OF EFFECTIVE & EFFICIENT OPERATIONS                                                               14

        Canadian Natural
        Near- & Mid-Term Growth Potential

                                                                                              70,000 bbl/d - 80,000 bbl/d of liquids*
         Conventional & Unconventional
                                                                                              300 MMcf/d - 350 MMcf/d of natural gas

         Thermal In Situ Pad Additions                                                        90,000 bbl/d - 100,000 bbl/d of bitumen

         Oil Sands Mining & Upgrading                                                         35,000 bbl/d - 45,000 bbl/d of SCO

         Total Low Risk Volume Additions                                                      245,000 BOE/d - 285,000 BOE/d

            *Liquids includes light crude oil, heavy crude oil and NGLs.
            Note: Assumes US$45/bbl WTI, C$2.50/GJ AECO and US$1.00 to C$1.30 foreign exchange and IP365. See Advisory for cautionary statements.

                            LARGE DIVERSE ASSET BASE PROVIDES SIGNIFICANT OPTIONALITY                                                               15

                                                                                      7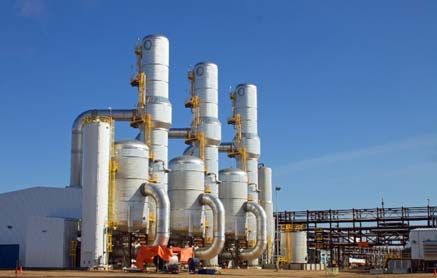
Corporate Presentation June 2021
Financial Strength
Canadian Natural
Q1/21 Quarterly Financial Highlights
• Significant adjusted funds flow ~$2.7 billion
‒ Free cash flow ~$1.4 billion(1)
• Disciplined capital ~$0.8 billion
• Balance sheet is strong
‒ Reduced absolute net debt by ~$1.4 billion from Q4/20 levels
Reduced absolute net debt by ~$2.9 billion from June 30, 2020 levels
‒ Significant liquidity of ~$5.5 billion as at March 31, 2021(2)
• Returns to Shareholders
‒ Significant returns to shareholders ~$1.1 billion(3)
‒ Quarterly dividend increased 11% to $0.47 per common share in March 2021
21st consecutive year of dividend increases
‒ 1,560,000 common shares repurchased at a weighted average price of $38.33 in 2021(3)
(1) After dividend payments and net capital expenditures, excluding share repurchases.
(2) Including committed and undrawn credit facilities, cash balances and short term investments.
(3) Includes year to date 2021 dividends and share repurchases, up to and including May 5, 2021.
ROBUST FINANCIAL PERFORMANCE 17
8Corporate Presentation June 2021
Canadian Natural
Robust Financial Position
Long-Term Ratings Outlook Short-Term Ratings
DBRS BBB High Stable R-2
Standard & Poor’s BBB- Stable A-3
Moody’s Baa2 Stable P-2
• Balance Sheet strength as of March 31, 2021
• Debt to book capitalization ~37%
• Debt to adjusted EBITDA ~2.5x
• Robust financial position as at March 31, 2021
• Significant liquidity ~$5.5 billion*
• DBRS updated outlook to Stable June 4, 2021
*Including committed and undrawn credit facilities, cash balances and short term investments.
Note: See Advisory for cautionary statements, definitions and pricing assumptions.
DELIVERING ON OUR FINANCIAL PLAN 18
Canadian Natural
Balanced Credit Facility Profile
Revolving Credit Facilities (C$ million) Fully Drawn Term Credit Facilities(1) (C$ million)
June 2022(1) $2,425 February 2023(2) $1,000
June 2023(1) $2,425 June 2022(3) $1,475
Operating demand loan $100 February 2023 $2,650
North Sea operating line (£5 million) $8 Total $5,125
Total $4,958
• Lenders
‒ 19 banks diversified by location
‒ 15+ year relationships with 10 banks
(1) Financial covenant on Credit Facilities is based on consolidated debt to book capital ratio to not exceed 0.65:1.00.
(2) Credit facility extended in 2021 to February 2023.
(3) Subsequent to year-end 2020, repaid $1,612.5 million.
LARGE & DIVERSE BANKING GROUP SUPPORTS STRONG LIQUIDITY 19
9Corporate Presentation June 2021
Canadian Natural
2021F Free Cash Flow
($ billion)
$12 ~US$39 WTI ~US$60 WTI
$10
$8
$6
Dividend(2)
$4 Dividend(1)
$2
$0
(3)
2020 2021F
(1) Actual 2020 dividends. Capital Free Cash Flow
(2) Current quarterly dividend annualized.
(3) Excludes net acquisition costs.
Note: See Advisory for cautionary statements, definitions and pricing assumptions; based upon 2021 budget of ~$3.2 billion and the mid-point of 2021F free cash flow range.
SIGNIFICANT & SUSTAINABLE FREE CASH FLOW GENERATION 20
Canadian Natural
Balance Sheet Strength
($ millions)
$25,000
Free Cash Flow generation
$23,000 is significant
$21,000
Balance Sheet strengthens
very quickly
$19,000
Over $3.2 billion returned to
$17,000
shareholders over same period(2)
$15,000
$13,000
(1)
Q2/20 Q1/21 Q4/21F
(1) Q4/21F net long-term debt based upon the mid-point of 2021F free cash flow range.
(2) Targeted returns to shareholders based upon actual dividend payments and share repurchases from June 30, 2020 to May 5, 2021, plus targeted dividend payments based
upon current quarterly dividend from May 6, 2021 to December 31, 2021.
Note: See Advisory for cautionary statements, definitions, and pricing assumptions.
BALANCED FREE CASH FLOW ALLOCATION 21
10Corporate Presentation June 2021
Canadian Natural
Balance Sheet Strength
Debt/EBITDA
(x)
4.5 • Strengthening metrics through the cycle
4.0 • Prudent free cash flow allocation
3.5 3.6x • Priority towards absolute debt repayment
3.0
• Demonstrates resilience of high quality
2.5
assets and business model
2.0
1.5
1.0 ~1.1x Repaid over $1.6 billion of
0.5 non-revolving term loans
0.0 YTD in 2021*
2020 2021F
Debt to Book Cap 40% ~29%
*Total repaid from January 1, 2021 to May 5, 2021.
Note: See Advisory for cautionary statements, definitions, and pricing assumptions; based upon the mid-point of 2021F free cash flow range.
STRONG FINANCIAL METRICS 22
.
Changes to Net Debt
2019 to 2020
(%) In 2020 Canadian Natural:
90% Maintained net debt levels
Executed share repurchases
70% Increased dividend
Increased reserves
50% Increased production
Opportunistic natural gas acquisition
30%
10%
-10%
Change in Net Debt
($3,700) ($70) $600 $1,500 $6,500 $3,200 $19,400 $17,100
($US million)*
Global Peers
*Change based upon December 31, 2019 to December 31, 2020.
Source: As per company reports. Peers include BP, COP, CVX, FP, RDS, SU and XOM.
DELIVERED TOP TIER RESULTS 23
11Corporate Presentation June 2021
Dividend Sustainability Through the Cycle
2020 vs. Q1 2021
Change
(%)
15% CNQ increased dividend in March 2021
4 peers decreased their dividend
10% 2 peers maintained their dividend
1 peer increased their dividend
5%
0%
-5%
-10%
(24%) (30%) (38%)
Global Peers
Source: Company reports. Peers include BP, COP, CVX, FP, RDS, SU and XOM.
Based upon 2020 dividends paid vs. 2021 current dividend annualized, as at March 31, 2021.
21 YEARS OF CONSECUTIVE DIVIDEND INCREASES 24
Long-Term Dividend Growth vs. Global Peers
20 Year CAGR
(% CAGR)
25%
20%
15%
10%
Peer Average
5%
0%
-5%
Global Peers
Peers include: Peers include BP, COP, CVX, FP, RDS, SU and XOM.
Note: Annual 2002 to 2021. 2021 based upon latest announced quarterly dividend, annualized, as at April 28, 2021, per company reports.
LEADING LONG-TERM SUSTAINABLE DIVIDEND GROWTH 25
12Corporate Presentation June 2021
Canadian Natural
Returns to Shareholders – Dividends
($ million)
2,250
2,000 21 years of consecutive dividend increases
~20% CAGR since inception
1,750 Horizon
Phase 3
1,500 complete
1,250
1,000
750
500
Horizon Phase 1 build years
250
0
2006 2007 2008 2009 2010 2011 2012 2013 2014 2015 2016 2017 2018 2019 2020 2021F
Dividend
Note: Based upon annualized dividends declared.
HISTORY OF GROWING RETURNS TO SHAREHOLDERS 26
Canadian Natural Financial Strength
Summary
• Balance Sheet Strength
‒ Maintained debt levels in 2020
Maximizing
‒ Significant further debt reduction in 2021
Shareholder Value • Returns to Shareholders
‒ Increased dividends in 2020 and 2021
Balance Resource
Leading • 21st consecutive year ~20% CAGR*
Returns to Opportunistic
Sheet
Strength Shareholders
Value
Growth
Acquisitions Free Cash ‒ Potential for increased share repurchases
Flow
• Resource Value Growth
‒ Capital discipline
• Opportunistic Acquisitions
‒ No gaps in portfolio
‒ Must add value
*Dividend increased in March 2021. CAGR since inception of dividend.
Note: See Advisory for cautionary statements, definitions, and pricing assumptions.
BALANCING THE FOUR PILLARS, FOCUSED ON VALUE CREATION 27
13Corporate Presentation June 2021
Canadian Natural Advantages
Summary
• World class asset base
‒ ~83% of reserves are Long Life Low Decline(1) ~81% of total liquids production(2)
No decline, high value SCO production ~455,000 bbl/d
Top tier corporate decline rate ~10%
• Diversified across products and basins
‒ ~48% light crude oil and SCO
‒ ~30% heavy crude oil
‒ ~22% natural gas
• Flexible capital allocation and effective and efficient operations
‒ Low maintenance capital ~$3.0 billon ~$200 million growth capital ~5% BOE growth(3)
‒ Culture of innovation and continuous improvement
‒ Continued focus on cost efficiencies across the Company
(1) 2020 Net Proved reserves, based on SEC constant prices and costs, per company reports.
(2) Based upon mid-point of 2021B production.
(3) Capital based upon 2021B. BOE production growth based upon 2021B midpoint over 2020.
WORLD CLASS INVESTMENT OPPORTUNITY 28
Canadian Natural Advantages
Summary (cont’d)
• Leading free cash flow generation $5.7 billion to $6.2 billion*
‒ Supports sustainable and growing dividend
Increase quarterly dividend by 11% in March 2021
21 consecutive years of dividend increases ~20% CAGR since inception
‒ Potential for increased returns to shareholders share repurchases
• Strong financial position
‒ Significant further debt reduction in 2021
• Leading ESG performance
‒ A track record of continuous GHG intensity improvements through technology and innovation
*See Advisory for cautionary statements, definitions and pricing assumptions.
WORLD CLASS INVESTMENT OPPORTUNITY 29
14Corporate Presentation June 2021
Asset Overview
Natural Gas, Light Crude Oil & NGLs
Core Area Summary
• Large, Canadian, natural gas producer
‒ 2020 ~1,480 MMcf/d
‒ 2020 operating costs $1.14/Mcf
• Significant light crude oil and NGL production base
in Canada
‒ 2020 ~84,700 bbl/d
‒ 2020 operating costs $14.61/bbl
• High return international light crude oil
BC AB SK MB ‒ 2020 ~40,200 bbl/d
CNQ Land Base Targeting ~$1.5 billion of operating
free cash flow in 2021F*
*See Advisory for cautionary statements, definitions and pricing assumptions.
TOP TIER ASSET BASE 31
15Corporate Presentation June 2021
Natural Gas, Light Crude Oil & NGLs
Montney
Lean Gas (Corporate Presentation June 2021
Natural Gas, Light Crude Oil & NGLs
BC Montney Drilling & Completion Costs
($/metre) ($/tonne)
$500 $950
$850
$450
$750
$400
$650
$350 $550
$450
$300
$350
$250 $250
2017 2020 2017 2020
Drilling Performance Frac Performance
CONTINUOUS IMPROVEMENT MAXIMIZES VALUE 34
Natural Gas, Light Crude Oil & NGLs
Greater Wembley Area – Defined Plan
• Strategically owned plant capacity of ~205 MMcf/d
Sexsmith
Gas Plant • ~153 sections undeveloped land in Greater Wembley
‒ De-risked by proven production
‒ ~495 defined locations*
Wembley
Gas Plant ‒ ~190 additional locations* in emerging Montney layers
• Wembley light crude oil development plan
‒ Targeting 18 wells in 2021
Average capital efficiency of ~$9,400/BOE/d*
CNQ Land Base ‒ Constructing crude oil battery with capacity of ~7,500 bbl/d
Existing Montney Wells
Q4/20 & 2021 Targeted Wells
Gas Plants
Targeted on-stream October 2021
Pipelines
*Assumes US$45/bbl WTI, C$2.50/GJ AECO, US$1.00 to C$1.30 foreign exchange and IP365.
Note: See Advisory for cautionary statements.
EXTENSIVE LIQUIDS RICH DEVELOPMENT OPPORTUNITIES DRIVE VALUE GROWTH 35
17Corporate Presentation June 2021
Natural Gas, Light Crude Oil & NGLs
Infrastructure Advantage
• Extensive owned and controlled infrastructure
Umbach ‒ Drives costs lower
West Nig
Townsend ‒ Strategic infrastructure proximal to liquids rich
land base
Graham
• Low capital exposure drill to fill strategy
Stoddart
Septimus ‒ Flexible timing in response to market conditions
Greater Wembley
• Opportunity to leverage Liquids Enhancement
and Gas Storage (LEGS) technology
Elmworth
Gold Creek ~2.2 Bcf/d – net design capacity
CNQ Land Base ~1.2 Bcf/d – net available capacity
CNQ Sour Facilities BC AB
CNQ Sweet Facilities Smoky
Wild River
INFRASTRUCTURE ADVANTAGE SIGNIFICANTLY IMPROVES MARGINS 36
Natural Gas, Light Crude Oil & NGLs
Summary
• Leveraging Canadian Natural’s competitive advantages
‒ Large, diverse, balanced asset base
‒ Owned and controlled infrastructure
‒ Flexible capital allocation
~2,500 defined locations*
‒ Effective and efficient operations
‒ Technology and innovation
*Assumes US$45/bbl WTI, C$2.50/GJ AECO and US$1.00 to C$1.30 foreign exchange and IP365.
Note: See Advisory for cautionary statements.
MAXIMIZING SHAREHOLDER VALUE 37
18Corporate Presentation June 2021
Heavy Crude Oil
Core Area Summary
~500 km
• Largest primary heavy crude oil producer
Cliffdale in Canada
Pelican Lake
‒ 2020 production ~70,300 bbl/d
AB SK ‒ 2020 operating costs $17.59/bbl
Smith • Industry leading polymer flood at Pelican Lake
‒ 2020 production ~56,500 bbl/d
‒ 2020 operating costs $6.03/bbl
Targeting ~$1.0 billion of operating
CNQ Land Base
CNQ Heavy Crude Oil Bonnyville & free cash flow in 2021F*
Producing Properties
Lloydminster area
*See Advisory for cautionary statements, definitions and pricing assumptions.
VAST LAND BASE & OWNED INFRASTRUCTURE MAXIMIZES VALUE 38
Technology & Innovation
Heavy Crude Oil Horizontal Multilateral & Fishbone Wells
Multilateral & Fishbone • Multilateral technology unlocks multi-year
low-risk development opportunities
‒ Benefits:
Increased recovery up to 30x over vertical wells
Higher initial crude oil rates
Lower per barrel costs
Reduced land footprint
‒ Key areas:
Bonnyville and Lloydminster areas, Smith and Cliffdale
~1,300 defined
multilateral and fishbone locations*
*Assumes US$45/bbl WTI, 22% WCS differential, C$2.50/GJ AECO, US$1.00 to C$1.30 foreign exchange and IP365.
Note: See Advisory for cautionary statements.
MULTILATERAL TECHNOLOGY - A GAME CHANGER 39
19Corporate Presentation June 2021
Pelican Lake
Operating Costs
• Leveraging area and technological
($/bbl)
$9.00 expertise, economies of scale to
drive value growth
‒ Facility consolidations
$8.00
‒ Improved polymer quality and price
‒ Consolidation of power contracts
Q4/17
$7.00 Acquisition ‒ Elimination of underutilized camps
‒ Reduced workover costs
$6.00 ‒ Reduced injector cleanout costs
Equates to a
$5.00
2013 2014 2015 2016 2017 2018 2019 2020 ~$50 million reduction in annual
operating costs in 2020
*Based upon 2020 Pelican production levels and targeted annual per barrel operating cost savings.
STRONG ANNUAL 2020 OPERATING COSTS OF $6.03/bbl 40
Heavy Crude Oil
Summary
• Leveraging Canadian Natural’s competitive advantages
‒ Large, diverse, balanced asset base
‒ Owned and controlled infrastructure
‒ Flexible capital allocation
~3,000 defined locations*
‒ Effective and efficient operations
‒ Technology and innovation
*Assumes US$45/bbl WTI, 22% WCS differential, C$2.50/GJ AECO and US$1.00 to C$1.30 foreign exchange and IP365.
Note: See Advisory for cautionary statements.
MAXIMIZING SHAREHOLDER VALUE 41
20Corporate Presentation June 2021
Thermal In Situ Oil Sands
Asset Overview
CNQ Thermal Producing Properties Birch Mtn. • Long Life Low Decline assets
CNQ In Situ Project Inventory
Peers ‒ ~122 billion barrels BIIP(1)
Ells River
• Facility capacity of ~340,000 bbl/d(2)
Liege
‒ 2020 production ~249,000 bbl/d
Gregoire ‒ 2020 operating costs $9.44/bbl
• 100% working interest and operatorship on
Pelican
developed properties
Leismer • Leverage use of technology to enhance recovery
and optimize costs
Peace River
Jackfish ‒ Expertise in Cyclic Steam Stimulation (CSS), Steam
Grouse
Pike Assisted Gravity Drainage (SAGD), Steam Flood
Kirby
and Solvents
Lindbergh
Primrose
Marie
Wolf Lake Lake
(1) Discovered Bitumen Initially-in-Place (BIIP).
(2) Includes Jackfish, Kirby & Primrose/Wolf Lake facility capacities.
GREAT ASSETS + TECHNOLOGY + INNOVATION = VALUE CREATION 42
Thermal In Situ Oil Sands
Primrose / Wolf Lake Overview
• Total facility capacity ~140,000 bbl/d
‒ 2020 production ~82,000 bbl/d
• Leverage annual unutilized facility capacity
of ~60,000 bbl/d
Primrose North
Primrose East
‒ Future pad adds capital efficiency ~$10,000/bbl/d(1)
‒ Average CSS production of ~400 bbl/d per well(2)
• ~307 net sections of undeveloped land with decades
Primrose South of highly economic pad additions(1)
‒ ~2,000 locations(1)
Wolf Lake
Approved Project Areas • Steam Flood as a follow up to CSS increases
Approved Development Areas recovery factor by ~20%
Drilled Development Pads
Future Approved Pads • Solvent technology upside
Future Pads
Facilities ‒ Pilot targeted for Q4/21 in steam flood area
(1) At US$45/bbl WTI and 22% WCS differential.
(2) First 12 month production average.
LEVERAGE INFRASTRUCTURE TO ADD LOW COST, LOW DECLINE BARRELS 43
21Corporate Presentation June 2021
Thermal In Situ Oil Sands
Kirby / Jackfish SAGD Overview
• Total facility capacity of ~200,000 bbl/d(1)
‒ 2020 production ~165,000 bbl/d
Kirby Jackfish
North • Leverage annual unutilized facility capacity
of ~35,000 bbl/d
‒ Future pad adds capital efficiency ~$8,000/bbl/d(2)
~6% reduction from 2020F
Pike(3) • Consolidated land base ~367 net sections of
undeveloped land
Kirby
South
‒ Over 20 years of development opportunities
• Economies of scale
‒ Synergies drive lower operating costs
Approved Project Areas
Approved Development Areas ‒ Leverage operating and technical expertise across
Drilled Development Pads operations
Future Approved Pads
Future Pads • Solvent technology upside
Facilities
‒ Continue to monitor the pilot performance in 2021
(1) Includes Jackfish, Kirby South and Kirby North facilities.
(2) At US$45/bbl WTI and 22% WCS differential.
(3) CNQ 50% working interest.
LONG LIFE LOW DECLINE SAGD LAND BASE 44
Technology & Innovation
Solvents – Reducing GHG Emissions Through Steam Efficiencies
• Co-injecting solvent with steam
‒ Kirby South is currently piloting solvent SAGD
SOR and GHG intensity reduction of ~45% achieved
• Next steps:
‒ Primrose solvent pilot
Targeted for Q4/21 in steam flood area
• Benefits:
‒ Reduce steam-to-oil ratio by ~50%
~$1.00/bbl operating cost savings
‒ Lower GHG emissions intensity by ~50%
‒ Potential application throughout extensive thermal
in situ asset base
APPLYING TECHNOLOGY TO IMPROVE PERFORMANCE 45
22Corporate Presentation June 2021
Thermal In Situ Oil Sands
Summary
• Large, Long Life Low Decline asset base
• Capture low cost opportunities with annual unutilized capacity of ~95,000 bbl/d
• Leveraging technology and innovation Solvents
‒ Significant GHG emission improvements
Targeting
‒ Operating cost, energy and water use reductions ~$2.7 billion
of operating free cash
• Potential to double production volumes
flow in 2021F*
• Leveraging economies of scale and synergies
• Reducing costs through effective and efficient operations
*See Advisory for cautionary statements, definitions and pricing assumptions.
LEADING FREE CASH FLOW 46
Oil Sands Mining & Upgrading
• Industry leading oil sands mine operator
‒ Net capacity ~475,000 bbl/d of SCO
CNQ Operating Oil Sands Mines
CNQ Lands • No decline, reservoir risk or reserve replacement cost
‒ 50+ year reserve life(1)
• Significant resource in place
Horizon ‒ ~17.5 billion barrels BIIP(2)
AOSP • Significant economies of scale
• Top tier operating costs, reliability and utilization
~72 km
Fort McMurray
(1) Including future pit development.
(2) Discovered Bitumen Initially-in-Place (BIIP).
LONG LIFE NO DECLINE ASSETS 47
23Corporate Presentation June 2021
Oil Sands Mining & Upgrading
Plant Capacity Utilization
(%)
100%
90%
80%
70%
1 year 2 year
CNQ Peer Average
Note: Sourced from TD research: Mine your own Business reports, includes trailing data as of February 2021.
Peers Include: IMO Kearl, SU Base, SU Fort Hills and Syncrude.
CONTINUOUS IMPROVEMENT DRIVES HIGH SUSTAINABLE UTILIZATION 48
Oil Sands Mining & Upgrading
Operating Costs
($/bbl)
$45.00
$40.00
Over a 50% reduction in
operating costs
$35.00
Equates to a
$30.00
~$3.5 billion reduction in annual
$25.00 operating costs in 2020*
$20.00
$15.00
$10.00
2013 * 2013 * 2020 2020
(C$) (US$) (C$) (US$)
Cash Costs Fuel Costs
*2013 operating costs are before the AOSP acquisition.
Note: Operating costs reflect production downtime for turnarounds (unadjusted). Fuel Costs reflects natural gas costs used in operations.
CONTINUOUS IMPROVEMENT MAXIMIZES VALUE 49
24Corporate Presentation June 2021
Horizon Oil Sands
Mid-Term Opportunities
• Opportunities provide incremental economic production
‒ Incremental 35,000 bbl/d - 45,000 bbl/d of SCO
• Reliability improvements
‒ Diluent Recovery and Vacuum Distillate Units
Potential operating cost
• Potential future production reliability
savings of
and productive capacity
$1.00/bbl - $2.00/bbl
‒ Increased process equipment capacity
IMPROVED RELIABILITY & VALUE ENHANCEMENT 50
Technology & Innovation
In-Pit Extraction Process (IPEP)
• IPEP is a modular extraction plant that
separates bitumen in the mine pit
• Benefits
‒ Reduces GHG emissions by ~40%
‒ Eliminates tailings ponds, as it produces dry
stackable tailings IPEP Field Pilot at Horizon
‒ Significant potential reclamation savings
Targeted operating cost savings of
$2.00/bbl - $3.00/bbl
Example of dry tailings produced
ADVANCING TAILINGS MANAGEMENT TECHNOLOGIES 51
25Corporate Presentation June 2021
Oil Sands Mining & Upgrading
Summary
• Long Life, no decline assets
‒ ~475,000 bbl/d net capacity
• Capturing synergies through technology and innovation
‒ Reliability and capacity increases
‒ In-Pit Extraction Process
Targeting
• Effective and efficient operations ~$5.6 billion
‒ Continuous improvement drives cost savings of operating free cash
• Economies of scale and synergies flow in 2021F*
‒ Three mining operations enhances overall
reliability and creates operating synergies
‒ Maximizes operating free cash flow
*See Advisory for cautionary statements, definitions and pricing assumptions.
SUSTAINABLE FREE CASH FLOW 52
Environmental,
Social &
Governance
26Corporate Presentation June 2021
2020 Environmental Achievements
• Canadian Natural's corporate GHG emissions intensity continues to improve
‒ Decreased by 18% from 2016 levels
‒ Decreased by 2% from 2019 levels
• One of the largest owners of Carbon Capture and Storage and sequestration
capacity globally
‒ Quest CCS facility marked the five millionth cumulative tonne of stored CO2 in May 2020
• Reached milestone of 2.5 million cumulative trees planted at Oil Sands Mining and
Upgrading sites
‒ This work reclaims land and contributes to increased carbon capture
• Successfully achieved three of four current environmental targets in 2020
‒ Targeting an update to environmental targets in 2021
MEETING & EXCEEDING ESG TARGETS 54
The World Needs More Canadian Energy
(Aggregate ESG Score)
300 Environment(1)
Social(2)
250 Governance(3)
200
Average
150
100
50
0
(1) 2020 Yale Environment Protection Index (EPI).
(2) 2020 Social Progress Index (SPI) prepared by Social Progress Imperative.
(3) 2019 World Governance Indicators (WGI), Regulatory Quality Score percentile rank.
(4) Venezuela Social score not shown due to insufficient data and Governance score is negligible.
TOP CRUDE OIL EXPORTING NATIONS IN THE WORLD 55
27Corporate Presentation June 2021
Canadian Natural Has Delivered
Advancing Innovation
• Recognize the need to reduce GHG emissions ~$3.9 Billion
• Leverage technology and Canadian ingenuity INVESTED IN
RESEARCH & DEVELOPMENT*
• Opportunities to reduce emissions further
~$77.4 Million
INVESTED IN GHG RESEARCH AND
TECHNOLOGIES IN 2019
Reduce Environmental Footprint
Unlock Reserves
Increase Production
Effective & Efficient Operations
– Lowers costs
*2009-2020 inclusive.
ONE OF CANADA’S LEADING R&D INVESTORS 56
Continuous Improvement in GHG Emissions
Corporate
GHG Emissions Intensity
(tonnes CO2e/BOE)
0.075
0.070
~32%
REDUCTION IN GHG INTENSITY
0.065 SINCE 2012
0.060 EQUIVALENT TO REMOVING
0.055
~1.9 million
CARS OFF THE ROAD ANNUALLY*
0.050
0.045
2012 2013 2014 2015 2016 2017 2018 2019 2020
*Go forward estimate, relative to 2012 performance.
Note: Represents total Scope 1 Corporate GHG emissions intensity.
CONTINUING TO REDUCE ENVIRONMENTAL FOOTPRINT 57
28Corporate Presentation June 2021
Leading Canadian Oil Sands Intensity
GHG Emissions Intensity
(kgCO2/bbl)
80
70
60
50 ~35%
40 LOWER THAN TOTAL PEER
UPSTREAM SCOPE 1 AVERAGE
30
20
10
0
Total Peer Oil Sands
Total peer average includes all Canadian thermal in situ and oil sands mining peer assets.
Source: Facility Greenhouse Gas Reporting Program – Environment and Climate Change Canada; Rystad Energy UCube; Rystad Energy research and analysis.
Note: Represents Oil Sands emissions intensity in Canada (mining & thermal in situ). Performance in 2018 of 2019 operated portfolio, scope 1 only.
TOP TIER ENVIRONMENTAL PERFORMANCE IN THE OIL SANDS 58
Technology & Innovation
Journey to Net Zero
Near-Term Actions Medium-Term Actions Long-Term Actions
• IPEP pilot • IPEP commercialization • Carbon capture and conversion
(carbon fibers, asphalts, plastics)
• Solvent EOR pilots • Solvent EOR commercialization
• Molten carbonate fuel cells
• Enhanced detection and • Titanium Corporation technology commercialization
measurement technologies for
• NRG COSIA Carbon XPRIZE • Expand / develop future
fugitive emissions reduction
• Molten carbonate fuel cells pilot CCS projects
• Pneumatic retrofits
• Leverage CCS expertise to
• Net zero / ultra-low emissions
optimize projects
heavy oil pad
• Carbon capture and storage (CCS)
‒ Horizon’s CO2 sequestration
‒ Quest CCS project
‒ North West Refinery / Alberta
Carbon Trunk Line
MULTIPLE PATHWAYS TO NET ZERO 59
29Corporate Presentation June 2021
Oil Sands
Pathways to Net Zero Initiative
• Canada’s largest oil sands producers form an
alliance to achieve net zero GHG emissions
‒ Members includes Canadian Natural, Cenovus,
Imperial, MEG and Suncor
‒ Progressing towards Canada’s climate goals
‒ The initiative targets a number of pathways:
CO2 trunkline connecting Fort McMurray and Cold Lake to a carbon sequestration hub
Deploy existing and emerging GHG reduction technology
CCUS, clean hydrogen, process improvements, energy efficiency, fuel switching and electrification
Evaluating, piloting and accelerating application of potential emerging emissions-reducing
technologies
• Requires collaboration between industry and governments to ensure economic
viability of this initiative
PATHWAYS TO NET ZERO IN CANADA’S OIL SANDS 60
Carbon Capture & Sequestration / Storage Technology
Quest
TOP TIER
CO2 CAPTURER AND SEQUESTERER IN THE WORLD(1)
• Reduced CO2 footprint
• Reduced CO2 charges
Tonnes/Year
EQUIVALENT TO Horizon
Quest(2) ~1.1 million REMOVING
Horizon ~0.4 million ~576,000
NWR(3) ~1.2 million CARS OFF THE
Total ~2.7 million ROAD ANNUALLY
(1) Per the Global CCS Institute.
(2) Canadian Natural is a 70% working interest owner in Quest.
(3) Canadian Natural is a 50% owner in North West Redwater (NWR).
LEADING CANADA IN CARBON CAPTURE & STORAGE 61
30Corporate Presentation June 2021
Carbon Capture, Utilization, and Storage (CCUS)
Federal Budget 2021
• Federal budget includes support for CCUS and low-carbon fuels (e.g. hydrogen) as
important pathways to achieve climate objectives
‒ Proposed CCUS tax credit
‒ $319 million of technology funding for CCUS
‒ An additional $5 billion for the current Net Zero Accelerator program
• Recognizes the important role of CCUS for the oil sands sector
• Supports the long-term resilience of the oil and natural gas industry and pathways to
lower GHG emissions
• We look forward to working together with government through the consultation period
GOVERNMENTS ARE ENGAGED ON CCUS OPPORTUNITIES 62
Industry Leading Safety Performance
(Per 200,000 Hours)
0.75
~25%
0.50 TRIF REDUCTION VS 2019
~58%
TRIF REDUCTION VS 2016
0.25
0.00
2016 2017 2018 2019 2020
Total Recordable Injury Frequency
TARGET: NO SAFETY INCIDENTS, NO HARM TO PEOPLE 63
31Corporate Presentation June 2021
Investing in Indigenous Communities
~$550 Million
IN CONTRACTS WITH LOCAL
INDIGENOUS BUSINESSES IN 2019
>$1.4 Billion
IN LAST 3 YEARS
CANADIAN NATURAL WORKS WITH
>150 Indigenous Companies
Fort McKay Métis Elder and Fort McKay First Nation Cultural & Special Events Lead with Canadian
Natural staff during a traditional planting protocol ceremony held at the Muskeg River Mine.
INVESTING IN COMMUNITIES WHERE WE LIVE & WORK 64
Governance
Risk Assessment & Mitigation
• Strong track record of identifying, assessing, adapting, aligning and executing
• Board of Directors as well as Board Governance and Risk Committees
‒ Review and hold management accountable to identify and mitigate risks
• Strong, effective strategies to plans and address risks
‒ Financial, Operational, Market, Technology, Environmental, Social, Governance, Safety, Asset Integrity
Board of Directors
Health, Safety, Asset Integrity and Nominating, Governance and
Environmental Committee Risk Committee
Management Committee
Marketing Finance Environmental, Social, Governance Operations Technology
STRONG GOVERNANCE 65
32Corporate Presentation June 2021
Management Aligned With Shareholders
Management Ownership
(% of Outstanding Shares)
2.5%
~2.3%
2.0% Substantial Management & Director invested wealth
delivers clear alignment with shareholder interests
1.5%
1.0%
0.5%
0.0%
Peers Integrated Peers
Peers include APA, COP, CVE, DVN, EOG, IMO, OVV, PXD and SU.
Note: Based on share ownership data from June 2021 (excluding options). Outstanding shares as at Q1/21 per company reports.
Source: BD Corporate.
MANAGEMENT ALIGNED WITH SHAREHOLDER INTERESTS 66
The Strength of Canadian Natural’s Business Model
• Leaders in ESG performance
• Advantaged assets
‒ Long life low decline assets
‒ Effective and efficient operations
• Leverage technology, innovation and continuous improvement
‒ Delivered game changing environmental performance
‒ Track record of continuous improvement
• Journey to net zero emissions in oil sands (mining and thermal)
Canadian Natural should be an ESG investment priority
UNIQUE, SUSTAINABLE & ROBUST INCLUDING ESG 67
33Notes
Advisory
Special Note Regarding Forward-Looking Statements

Certain statements relating to Canadian Natural Resources Limited (the "Company") in this document or documents incorporated herein by
reference constitute forward-looking statements or information (collectively referred to herein as "forward-looking statements") within the meaning
of applicable securities legislation. Forward-looking statements can be identified by the words "believe", "anticipate", "expect", "plan", "estimate",
"target", "continue", "could", "intend", "may", "potential", "predict", "should", "will", "objective", "project", "forecast", "goal", "guidance", "outlook",
"effort", "seeks", "schedule", "proposed", "aspiration" or expressions of a similar nature suggesting future outcome or statements regarding an
outlook. Disclosure related to expected future commodity pricing, forecast or anticipated production volumes, royalties, production expenses,
capital expenditures, income tax expenses and other targets provided throughout this presentation and the Company's Management’s Discussion
and Analysis ("MD&A") of the financial condition and results of operations of the Company, constitute forward-looking statements. Disclosure of
plans relating to and expected results of existing and future developments, including, without limitation, those in relation to the Company's assets
at Horizon Oil Sands ("Horizon"), the Athabasca Oil Sands Project ("AOSP"), Primrose thermal oil projects, the Pelican Lake water and polymer
flood projects, the Kirby Thermal Oil Sands Project, the Jackfish Thermal Oil Sands Project, the North West Redwater bitumen upgrader and
refinery, construction by third parties of new, or expansion of existing, pipeline capacity or other means of transportation of bitumen, crude oil,
natural gas, natural gas liquids ("NGLs") or synthetic crude oil ("SCO") that the Company may be reliant upon to transport its products to market,
the development and deployment of technology and technological innovations, and the financial capacity of the Company to complete its growth
projects and responsibly and sustainably grow in the long term also constitute forward-looking statements. These forward-looking statements are
based on annual budgets and multi-year forecasts, and are reviewed and revised throughout the year as necessary in the context of targeted
financial ratios, project returns, product pricing expectations and balance in project risk and time horizons. These statements are not guarantees of
future performance and are subject to certain risks. The reader should not place undue reliance on these forward-looking statements as there can
be no assurances that the plans, initiatives or expectations upon which they are based will occur.

In addition, statements relating to "reserves" are deemed to be forward-looking statements as they involve the implied assessment based on
certain estimates and assumptions that the reserves described can be profitably produced in the future. There are numerous uncertainties inherent
in estimating quantities of proved and proved plus probable crude oil, natural gas and NGLs reserves and in projecting future rates of production
and the timing of development expenditures. The total amount or timing of actual future production may vary significantly from reserves and
production estimates.

The forward-looking statements are based on current expectations, estimates and projections about the Company and the industry in which the
Company operates, which speak only as of the earlier of the date such statements were made or as of the date of the report or document in which
they are contained, and are subject to known and unknown risks and uncertainties that could cause the actual results, performance or
achievements of the Company to be materially different from any future results, performance or achievements expressed or implied by such
forward-looking statements. Such risks and uncertainties include, among others: general economic and business conditions (including as a result
of effects of the novel coronavirus ("COVID-19") pandemic and the actions of the Organization of the Petroleum Exporting Countries Plus
("OPEC+") which may impact, among other things, demand and supply for and market prices of the Company’s products, and the availability and
cost of resources required by the Company's operations; volatility of and assumptions regarding crude oil and natural gas and NGLs prices
including due to actions of OPEC+ taken in response to COVID-19 or otherwise; fluctuations in currency and interest rates; assumptions on which
the Company’s current targets are based; economic conditions in the countries and regions in which the Company conducts business; political
uncertainty, including actions of or against terrorists, insurgent groups or other conflict including conflict between states; industry capacity; ability of
the Company to implement its business strategy, including exploration and development activities; impact of competition; the Company’s defense
of lawsuits; availability and cost of seismic, drilling and other equipment; ability of the Company and its subsidiaries to complete capital programs;
the Company’s and its subsidiaries’ ability to secure adequate transportation for its products; unexpected disruptions or delays in the mining,
extracting or upgrading of the Company’s bitumen products; potential delays or changes in plans with respect to exploration or development
projects or capital expenditures; ability of the Company to attract the necessary labour required to build, maintain, and operate its thermal and oil
sands mining projects; operating hazards and other difficulties inherent in the exploration for and production and sale of crude oil and natural gas
and in mining, extracting or upgrading the Company’s bitumen products; availability and cost of financing; the Company’s and its subsidiaries’
success of exploration and development activities and its ability to replace and expand crude oil and natural gas reserves; the Company's ability to
meet its targeted production levels; timing and success of integrating the business and operations of acquired companies and assets; production
levels; imprecision of reserves estimates and estimates of recoverable quantities of crude oil, natural gas and NGLs not currently classified as
proved; actions by governmental authorities (including production curtailments mandated by the Government of Alberta); government regulations
and the expenditures required to comply with them (especially safety and environmental laws and regulations and the impact of climate change
initiatives on capital expenditures and production expenses); asset retirement obligations; the sufficiency of the Company's liquidity to support its
growth strategy and to sustain its operations in the short, medium, and long term; the strength of the Company's balance sheet; the flexibility of the
Company's capital structure; the adequacy of the Company’s provision for taxes; the continued availability of the Canada Emergency Wage
Subsidy ("CEWS") or other subsidies; and other circumstances affecting revenues and expenses.

The Company’s operations have been, and in the future may be, affected by political developments and by national, federal, provincial, state and
local laws and regulations such as restrictions on production, changes in taxes, royalties and other amounts payable to governments or
governmental agencies, price or gathering rate controls and environmental protection regulations. Should one or more of these risks or
uncertainties materialize, or should any of the Company’s assumptions prove incorrect, actual results may vary in material respects from those
projected in the forward-looking statements. The impact of any one factor on a particular forward-looking statement is not determinable with
certainty as such factors are dependent upon other factors, and the Company’s course of action would depend upon its assessment of the future
considering all information then available.

Readers are cautioned that the foregoing list of factors is not exhaustive. Unpredictable or unknown factors not discussed in this presentation or
the Company's MD&A could also have adverse effects on forward-looking statements. Although the Company believes that the expectations
conveyed by the forward-looking statements are reasonable based on information available to it on the date such forward-looking statements are
made, no assurances can be given as to future results, levels of activity and achievements. All subsequent forward-looking statements, whether
written or oral, attributable to the Company or persons acting on its behalf are expressly qualified in their entirety by these cautionary statements.
Except as required by applicable law, the Company assumes no obligation to update forward-looking statements in this presentation or the
Company's MD&A, whether as a result of new information, future events or other factors, or the foregoing factors affecting this information, should
circumstances or the Company’s estimates or opinions change.
Advisory
Special Note Regarding non-GAAP Financial Measures
This presentation includes references to financial measures commonly used in the crude oil and natural gas industry, such as: adjusted net
earnings (loss) from operations, adjusted funds flow and net capital expenditures. These financial measures are not defined by International
Financial Reporting Standards ("IFRS") and therefore are referred to as non-GAAP financial measures. The non-GAAP financial measures used by
the Company may not be comparable to similar measures presented by other companies. The Company uses these non-GAAP financial measures
to evaluate its performance. The non-GAAP financial measures should not be considered an alternative to or more meaningful than net earnings
(loss), cash flows from operating activities, and cash flows used in investing activities as determined in accordance with IFRS, as an indication of
the Company's performance. The non-GAAP financial measure adjusted net earnings (loss) from operations is reconciled to net earnings (loss), as
determined in accordance with IFRS, in the "Financial Highlights" section of the Company's MD&A. Additionally, the non-GAAP financial measure
adjusted funds flow is reconciled to cash flows from operating activities, as determined in accordance with IFRS, in the "Financial Highlights"
section of the Company's MD&A. The non-GAAP financial measure net capital expenditures is reconciled to cash flows used in investing activities,
as determined in accordance with IFRS, in the "Net Capital Expenditures" section of the Company's MD&A. The Company also presents certain
non-GAAP financial ratios and their derivation in the "Liquidity and Capital Resources" section of the Company's MD&A.
Adjusted net earnings (loss) from operations is a non-GAAP financial measure that represents net earnings (loss) as presented in the Company's
consolidated Statements of Earnings (Loss), adjusted for the after-tax effects of certain items of a non-operational nature. The Company considers
adjusted net earnings (loss) from operations a key measure in evaluating its performance, as it demonstrates the Company’s ability to generate
after-tax operating earnings from its core business areas. Adjusted net earnings (loss) from operations may not be comparable to similar measures
presented by other companies.
Adjusted funds flow is a non-GAAP financial measure that represents cash flows from operating activities as presented in the Company's
consolidated Statements of Cash Flows, adjusted for the net change in non-cash working capital, abandonment expenditures excluding the impact
of government grant income under the provincial well-site rehabilitation programs, and movements in other long-term assets, including the
unamortized cost of the share bonus program, accrued interest on subordinated debt advances to North West Redwater Partnership ("NWRP"),
and prepaid cost of service tolls. The Company considers adjusted funds flow a key measure in evaluating its performance, as it demonstrates the
Company’s ability to generate the cash flow necessary to fund future growth through capital investment and to repay debt. Adjusted funds flow may
not be comparable to similar measures presented by other companies.
Net capital expenditures is a non-GAAP financial measure that represents cash flows used in investing activities as presented in the Company's
consolidated Statements of Cash Flows, adjusted for the net change in non-cash working capital, the repayment of NWRP subordinated debt
advances, abandonment expenditures including the impact of government grant income under the provincial well-site rehabilitation programs, and
the settlement of long-term debt assumed in acquisitions. The Company considers net capital expenditures a key measure in evaluating its
performance, as it provides an understanding of the Company’s capital spending activities in comparison to the Company's annual capital budget.
Net capital expenditures may not be comparable to similar measures presented by other companies.
Free cash flow is a non-GAAP measure that represents cash flows from operating activities as presented in the Company's consolidated
Statements of Cash Flows, adjusted for the net change in non-cash working capital from operating activities, abandonment, certain movements in
other long-term assets, less net capital expenditures and dividends on common shares. The Company considers free cash flow a key measure in
demonstrating the Company’s ability to generate cash flow to fund future growth through capital investment, pay returns to shareholders, and to
repay debt.
Adjusted EBITDA is a non-GAAP measure that represents net earnings (loss) as presented in the Company's consolidated Statements of Earnings
(Loss), adjusted for interest, taxes, depletion, depreciation and amortization, stock based compensation expense (recovery), unrealized risk
management gains (losses), unrealized foreign exchange gains (losses), and accretion of the Company’s asset retirement obligation. The
Company considers adjusted EBITDA a key measure in evaluating its operating profitability by excluding non-cash items.
Long-term debt, net and net debt are other financial measures that are calculated as net current and long-term debt less cash and cash
equivalents.
Debt to adjusted EBITDA is a non-GAAP measure that is derived as the current and long-term portions of long-term debt, divided by the 12 month
trailing Adjusted EBITDA, as defined above. The Company considers this ratio to be a key measure in evaluating the Company's ability to pay off
its debt.
Debt to book capitalization is a non-GAAP measure that is derived as net current and long-term debt, divided by the book value of common
shareholders' equity plus net current and long-term debt. The Company considers this ratio to be a key measure in evaluating the Company's
ability to pay off its debt.
Available liquidity is a non-GAAP measure that is derived as cash and cash equivalents, total bank and term credit facilities and short term
investments, less amounts drawn on the bank and credit facilities including under the commercial paper program. The Company considers
available liquidity a key measure in evaluating the sustainability of the Company’s operations and ability to fund future growth. See note 8 - Long-
term Debt in the Company’s consolidated financial statements.
Special Note Regarding Currency, Financial Information and Production
This presentation should be read in conjunction with the unaudited interim consolidated financial statements for the three months ended March 31,
2021 and the Company's MD&A and audited consolidated financial statements for the year ended December 31, 2020. All dollar amounts are
referenced in millions of Canadian dollars, except where noted otherwise. The Company’s unaudited interim consolidated financial statements for
the three months ended March 31, 2021 and the Company's MD&A have been prepared in accordance with IFRS as issued by the International
Accounting Standards Board ("IASB").
Production volumes and per unit statistics are presented throughout the Company's MD&A on a "before royalties" or "company gross" basis, and
realized prices are net of blending and feedstock costs and exclude the effect of risk management activities. In addition, reference is made to crude
oil and natural gas in common units called barrel of oil equivalent ("BOE"). A BOE is derived by converting six thousand cubic feet ("Mcf") of natural
gas to one barrel ("bbl") of crude oil (6 Mcf:1 bbl). This conversion may be misleading, particularly if used in isolation, since the 6 Mcf:1 bbl ratio is
based on an energy equivalency conversion method primarily applicable at the burner tip and does not represent a value equivalency at the
wellhead. In comparing the value ratio using current crude oil prices relative to natural gas prices, the 6 Mcf:1 bbl conversion ratio may be
misleading as an indication of value. In addition, for the purposes of the Company's MD&A, crude oil is defined to include the following
commodities: light and medium crude oil, primary heavy crude oil, Pelican Lake heavy crude oil, bitumen (thermal oil), and SCO. Production on an
"after royalties" or "company net" basis is also presented for information purposes only.
The Company's 2021 targeted annual adjusted funds flow, free cash flow and net debt are based upon forecasted commodity prices of US$60.47
WTI/bbl, WCS discount of US$11.95/bbl, AECO price of C$2.74/GJ and FX of US$1.00 to C$1.26. Forecasted net debt reflects estimated timing of
cash receipts and expenditures.
Additional information relating to the Company, including its Annual Information Form for the year ended December 31, 2020, is available on
SEDAR at www.sedar.com, and on EDGAR at www.sec.gov. Information on the Company's website does not form part of and is not incorporated
by reference in the Company's MD&A.You can also read