CENCOSUD CORPORATE PRESENTATION 3Q19 - Presentación de PowerPoint

Page created by Donna Munoz
 
CONTINUE READING
CENCOSUD CORPORATE PRESENTATION 3Q19 - Presentación de PowerPoint
CENCOSUD
CORPORATE PRESENTATION 3Q19
CENCOSUD CORPORATE PRESENTATION 3Q19 - Presentación de PowerPoint
ABOUT CENCOSUD

                                                   CONSOLIDATED RETAIL PLAYER IN THE LATAM REGION                 +6.0 MM SQM OF
                                                                                                                  LANDBANK TO FUEL
                                                   +50 YEARS OF HISTORY                                           FUTURE     GROWTH
                                                                                                                  ACROSS THE REGION

                                                   +132K EMPLOYEES                                                ON-GOING SHOPPING
                                                                             US$ 4.7 BN                           CENTERS PROJECTS:
                            5 BUSINESS UNITS
                                                                              MARKET                              • LA MOLINA
                                                                                CAP                               • LA 65

                                         HOME       DEPARTMENT   FINANCIAL
  SUPERMARKETS   SHOPPING CENTERS
                                     IMPROVEMENT       STORES    SERVICES    LISTED ON SANTIAGO STOCK EXCHANGE:
                         PRESENCE IN 5 COUNTRIES                             CENCOSUD (2004)
                                                                             FREE FLOAT: 46.3%
                                                                             AV. TRADING VOLUME: US$7.3MM
                                                                             RATED IG BY MOODY’S & FITCH

1,113 RETAIL STORES - 3.6 MM RETAIL SPACE                                    CENCOSUD SHOPPING (2019)
62 SHOPPING CENTERS - 653K GLA TO THIRD PARTIES                              FREE FLOAT: 28.4%
                                                                             AV. TRADING VOLUME: US$5.8MM
                                                                             AA+ RATING BY HUMPHREYS AND FELLER
CENCOSUD CORPORATE PRESENTATION 3Q19 - Presentación de PowerPoint
CENCOSUD’S HISTORY

                                                                                       Acquired Infante, Economax, Foster & Eurofasion.
                                                                                       Purchased Gbarbosa in Brazil and Wong in Peru. JV                                                 JV with Scotiabank development of
                              Opened Mall Alto Las Condes &
   Opened 1st                                                                          in Colombia for the development of Easy.                                                                    SF in Peru
                                  1st Easy store in Chile
  Supermarket

                                                                Acquired SM Las Brisas, Montecarlo and                                    Acquired Prezunic in Brazil. Opened Mall
            Opened 1st Jumbo store in                                            Disco                                                    Costanera Center. Purchased Carrefour in
                      ARG                                            Santiago Stock Exchange IPO                                          Colombia.

     1970 1988    2002                                           2003                        2005                        2008                   2010                             2014                           2019
1963     1982  1993                                                  2004                                2007                                       2012                                               201
                                                                                                                                                                                                        8
                                                    Launched Financial Services in Chile,
                                                                                                                   Starts FS operations in                                 JV with Scotiabank for
                    Opened Mall Unicenter           opened Florida Center & Portal La
                                                                                                                 Argentina. Acquired Blaisten                             development of SF in Chile
                            Arg.                    Dehesa. Acquired SM Santa Isabel in
                                                    Chile

  Opened        Jumbo                                                                Acquired Almacenes Paris.                                                                                             IPO of Cencosud
  Kennedy                       Acquired Proterra in Chile & Home                    Montecarlo & Las Brisas                                                                                                  Shopping
                                                                                     rebranded to Santa Isabel                             Acquired Super Familia in
                                Depot in Arg.
                                                                                                                                         Fortaleza and Bretas in Brazil
CENCOSUD CORPORATE PRESENTATION 3Q19 - Presentación de PowerPoint
2019 FINANCIAL HIGHLIGHTS
SALE OF FINANCIAL SERVICES IN PERU
In March of 2019, the Peruvian Superintendence approved the sale 51% of
Cencosud’s Bank to Scotiabank for a total of USD 100 million. The purpose of
the agreement is to boost growth and co-develop the financial services
business in Peru.

CENCOSUD SHOPPING IPO
In June 2019, Cencosud successfully executed the initial public offering (IPO)
of its Shopping Centers division in Chile, Peru and Colombia. Raising USD
1,055 million.
Price: $1.521
Total Shares: 472,000,000
The new Company owns a total 39 properties (33) in Chile, (2) in Peru and (4)
in Colombia. In addition to 3 plots of real estate in Chile and 2 in Peru.

LIABILITY MANAGEMENT AND TENDER OFFER
In September the Company performed a tender offer of its 2023, 2025 and
2027 bonds for a total of USD 474 million. In November 2019, Fitch Ratings
updated their rating from stable to negative watch.
CENCOSUD CORPORATE PRESENTATION 3Q19 - Presentación de PowerPoint
WHY CENCOSUD?
                                                                    Established presence in largest
                                                                    economies of the region

Healthy balance sheet structure                                                    Organic growth opportunities in fast
                                                                                   developing countries through our
                                                                                   landbank.

                                                     MAIN CORE ETHICS &
                                                     SUSTAINBLE VALUES

    Strong Corporate Governance
                                                                                   Further development of
                                                                                   our omnichannel strategy

                       Focus set on productivity &
                       efficiency
CENCOSUD CORPORATE PRESENTATION 3Q19 - Presentación de PowerPoint
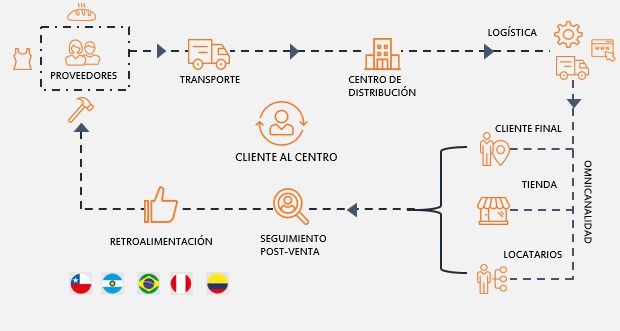
OUR PRESENCE BY COUNTRY
                   REVENUES BY COUNTRY LTM AS OF SEP’19                                        ADJ. EBITDA LTM AS OF SEP’19: US$1,166 MM
                                US$13,836 mm                                                             ADJ. EBITDA MG: 8.4%

                                          9%
                                                                                                                   4%
                     11%                                                                             21%

                14%                                             48%                                                                    52%
                                                                                                5%

                            18%                                                                       18%
i: For calculation details please revise page 13

                      248                                 284                   202                           94                       96
                 SUPERMARKETS                        SUPERMARKETS          SUPERMARKETS                  SUPERMARKETS             SUPERMARKETS
                       36                                 51            F.S JV WITH BRADESCO                  36                       10
              HOME IMPROVEMENT                     HOME IMPROVEMENT                                    HOME IMPROVEMENT        HOME IMPROVEMENT
                       78                                 22                                                  11                        4
              DEPARTMENT STORES                     SHOPPIN CENTERS                                   DEPARTMENT STORES         SHOPPING CENTERS
                       33                          FINANCIAL SERVICES                                          3              F.S: JV WITH COLPATRIA
               SHOPPING CENTERS                                                                        SHOPPING CENTERS
            F.S: JV WITH SCOTIABANK                                                                  FS: JV WITH SCOTIABANK
OUR PRESENCE BY BUSINESS UNITSi
                                REVENUES LTM AS OF SEP’19:                             ADJ. EBITDA LTM AS OF SEP’19: US$1,166 mm
                                      US$13,836 mm                                               ADJ. EBITDA MG: 8.4%

                                           2%              STRONG FOOD RETAIL                           11%
                                          US$ 321MM   PLAYER; MORE RESILIENT TO                      US$ 136MM
                              12%                       ECONOMIC DOWNTURNS                            48,1% mg                  RETAIL SEGMENT
                    US$ 1,639MM                                                           5%                              ACCOUNTED FOR 66% OF
                                                                                                                                         EBITDA
                                                                                     US$ 58MM
                                                                                      3.5% mg
                     12%
            US$ 1,667MM
                                                                                       14%
                                                               72%                 US$ 178MM                                       47%
                      2%                                      US$ 10,044MM
                                                                                    10.9% mg
             US$ 361MM                                                                                                              US$ 593MM
                                                                                                                                     6.0% mg

                                                                                               23%
RETAIL SEGMENT ACCOUNTED
FOR 95% OF REVENUES                                                                    US$ 284MM
                                                                                        79.6% mg.
For calculation details please go to page 13
                                                              RECOGNIZED BRAND PORTFOLIO
SOUND BALANCE SHEET

                                    LATEST NEWS                                                            DEBT BY CURRENCY (AFTER CCS)
● Cencosud executed the IPO for its Shopping Centers division in Chile, Peru
  and Colombia raising USD 1,055 million. Proceeds will be use to pay off                                     Otras Latam                                  Otras Latam;
                                                                                                                  6%                                           8%
  debt.                                                                                            USD
                                                                                                   16%
● Cencosud executed a tender offer for its 2023, 2025 and 2027 Bonds for                                                                             USD
  up to USD 474 million.                                                                                                           CLP + UF
                                                                                                                                                     20%
                                                                                                                                     83%                                             CLP + UF
● Investment Grade rating since 2011 (In Novemeber, Fitch Ratings updated                                                                                                              73%
  their ratings from stable to negative)
           ● Fitch Ratings:            BBB- (negative)
           ● Moody’s:                  Baa3 (negative)
                                                                                             3Q19                                                  3Q18
                         NET FINANCIAL EVOLUTION                                                   DEBT AMORTIZATION SCHEDULE (US$ MM)
 4,4                                                            4,2
                                               3,8       3,9                                                                                        987
 4,6              3,7                   3,6
          3,5                                                             Deuda
                            3,3
                                                         3,9    3,8       Financiera Neta
                  3,7                          3,7
          3,4                                                             (USD mm)
                            3,3         3,2
                                                                                                                        605         577                                              581

                                                                                                                                                                 424
                                                                          NFD/EBITDA
                                                                          Ajustado (veces)                                                                 213                 192
                                                                                                         156
                                                                                             53   48              53          34              50                          14
  2012

          2013

                  2014

                             2015

                                        2016

                                               2017

                                                         2018

                                                                09.2019

                                                                                             19   20     21       22    23    24     25       26    27     28    29       30   41    45
ORGANIC GROWTH
CENCOSUD SHOPPING CENTERS PROJECTS:                         LANDBANK PER COUNTRY (SQM):

                                                               COUNTRY                     Q            SQM
              LA MOLINA – PERU
              LA 65 - COLOMBIA                                 CHILE                       36           2.1MM
                                                               ARGENTINA                   34           3.1MM
                                                               BRAZIL                      23           328K
 LA MOLINA:
 •   HIGH SEGMENT DISCTRICT                                    PERU                        22           129K
 •   +35.7K GLA                                                COLOMBIA                    8            127K
 •   ANCHOR STORES
 •   OPENING DATE: 2H2021                                          CAPEX BREAKDOWN               CHANGES IN SELLING AREA
                                                                    US$ 300 MM
                                                               CENCOSUD’S CAPEX 2019
                                                                17%
                                 LA 65:                                                                           4
                                 •   UP & COMING DISTRICT                                                      OPENINGS
                                 •   +78K GLA                                              50%
                                 •   ANCHOR STORES                                                               32
                                 •   OPENING DATE: 2H2022    33%                                          REMODELLINGS

                                                                       ORGANIC GROWTH
                                                                                                                  5
                                                                       RECURRENT CAPEX                        CLOSURES
                                                                       TECHNOLOGY & OMNI
                                                                       STRATEGY
OMNICHANNEL STRATEGY

                    ANY-HOW          Long-term objectives:
ANY’S STRATEGY

                                     • Improve websites & apps,
                   ANY-WHERE            surpass industry standards
                                     • Optimized product mix with
                     ANY-TIME
                                        100% delivery in our stores
                    ANY-THING        • Reduce cost through
                                        automatized tools
                  ALL THE TIME

                 SUPERMARKETS FOOTPRINT    CHILE       ARG        COL      PER
                 % FOOD ONLINE                 94%       100%       79%       88%

                 % NON-FOOD ONLINE             66%       100%      239%       62%                                    Ov. Tot. Sales Over Tot.
                 % SKU DROPSHIP                    -         8%     63%       26%    E-commerce Sales    VAR % 19/18     3Q19       Sales 3Q18
                                                                                     Supermarkets           40,5%              1,9%         1,2%
                 EXPRESS DELIVERY           1.5 HRS      2 HRS     3 HRS    1.5 H5
                                                                                     Department Stores      25,3%            12,0%          8,5%
                                                                                     Home Improvement       41,1%              4,0%         2,6%
                                                                                     Total                  33,9%              3,4%         2,2%
PRODUCTIVITY & EFFICENCY

            SHARED SERVICES CENTER
Offers services to other units, thus reaching functional specialization on
recurring & high volume transaction.

                                                                             REGIONAL PROCUREMENT &
OPERATING WITH 120                   CREATING OVER 650K PAYMENT
                                     ORDERS AS WELL AS RECONCILED
                                                                             PRIVATE LABEL TEAM
ROBOTS, SSC HAS PROCESSED 14MM
INVOICES                             180MM COUPON CARDS.
                                                                             THE COMPANY CREATED A REGIONAL
                                                                             PURCHASE TEAM WITH THE
RESULTS: RECOVERED USD 5MM FOR LOSSES BY USD 30.5MM DUE TO                   PURPOSE OF:
COMMERCIAL AGREEMENT, DECREASED IMPROVED MANAGMENT OF ANNUAL                  OFF SEASON AVAILABILITY OF
                                INVENTORY.
                                                                                 PRODUCTS
                                                                              COST EFFICIENCY IN                 BIG DATA ANALYTICS
                                                                                 PROCURMENT
                                                                                                               BIG DATA ANALYTICS DEPARTMENT
                                                                             CENCOSUD IS A PIONEER IN THE       CREATED OVER TWO YEARS AGO
                                                                             LATAM REGION FOR CREATING A       TAKING ADVANATGE OF THE EXTENSIVE
                                                                             CENTRALIZED TEAM OF PRODUCT        DATABANK OF THE COMPANY
                                                                             DEVELOPMENT AND PRIVATE LABEL      THROUGH THE IMPLEMENTATION OF A
                                                                             PURCHASING.                        PLATFORM THAT IDENTIFIES
                                                                                                                SYNNERGIES AND PROVIDES INDEPTH
                                                                                                                INSIGHTS
ETHICS & SUSTAINABLE VALUES

    KEY DIMENSIONS OF OUR ETHICS CODE                                                    PILLARS OF THE SUSTAINTABILITY STRATEGY

                                                                            2019 HIGHLIGHTS:

                                                                            o Recognized in Dow Jones
                                                                              Sustainability Index (DJSI),
                                                                              placed in the #12 position (up 3
                                                                              places vs 2018).

   Yearly revised ethics code
   Trained Board of Directors and Employees on ethics issues.
   More than 137,000 people trained on ethics issues and sustainability.
   Signed Code of ethics and Code of Conduct by all employees.
   Available hotline for unethical behavior
STRONG CORPORATE GOVERNANCE
                        BOARD OF DIRECTORS                                       NEW CORPORATE STRUCTURE

                                                                                Organizational Structure1

                                                                                 Chief Executive Manager
                                                                                       Matias Videla

                                                                                                                 SM Chile
                                                                   Peru Manager       Argentina Manager     Cristian Siegmund
                                                                Alfredo Mastrokalos   Diego Marcantonio
                                                                                                            Dept. Store Chile
                                                                Colombia Manager       Brazil Manager       Ricardo Bennett
                                                                Marta Lucia Henao       Sebastian Los
                                                                                                            Home Imp. Chile
                                                                                                             Felipe Longo

                                                                        NEW MANAGEMENT STRUCTURE WTH THE PURPOSE:
SOX STANDARD SINCE 2012:           BOARD OF DIRECTOR COMITTEE
                                                                      TAKE FURTHER ADVANTE OF LOCAL MARKET KNOWLEDGE
• 7 SEASONED BOARD MEMBER              • ROBERTO PHILLIPS
                                                                                  EXPEDITE DECISION MAKING
• 2 INDEPENDET MEMBERS                  • MARIO VALCARCE
                                                                         PROMOTE EFFICENCIES ACROSS EACH BUSINES UNIT
                                       • ALEJANDRO PERÉZ
CALCULATION DETAILS
For this presentation the following exchange rates, calculations and details were considered:
Market cap calculated as of September 2019 using the stock closing price of CLP 1,200 and average Exchange Rate of CLP 683,06 per US$
Daily average trade volume; Figures as of September 2019 using close stock price CLP $1,200 and an average exchange rate of CLP 683,06 per US$
Adjusted EBITDA represents EBITDA plus exchange differences and gains (losses) from indexation units, minus revaluation of assets.
Revenues and Adjusted EBITDA converted to US$ using a last twelve month average exchange rate of CLP $683,06 per US$
Revenues and Adjusted EBITDA include IFRS16 accounting rule for the first 9 months of 2019.
Revenue and Adjusted EBITDA graph exclude the “others” segment, which contributes US$12mm in revenues and –US$82mm in Adj. EBITDA.
Revenues and Adjusted EBITDA exclude the adjustment of hyperinflation in Argentina (IAS29), including the adjustment, revenues for the LTM period were
US$14.189 MM and Adjusted EBITDA was US$1,193 MM, using end of period exchange rate of CLP 679,2 per US$. Argentina represented a 20.3% of total revenues
and 20.2% of total Adjusted EBITDA.
Debt denominated in US$ using end of period exchange rate as of September 2019. Debt includes liabilities of leases due to the adoption of new IFRS16 rule as well
as includes the hyperinflationary effect of Argentina due to IAS29 rule.
Amortization schedule is presented net off gains/losses from mart to market of derivatives, overdrafts and Comex debt (excluding forwards).
Debt by currency after cross currency swaps.
You can also read