Cereal o ender: is Kellogg's breaking its breakfast promises? - Changing Markets
←
→
Page content transcription
If your browser does not render page correctly, please read the page content below
Cereal
offender:
is Kellogg’s breaking
its breakfast promises?

  Executive Summary
  Food fortification plays an important role in addressing micronutrient deficiencies and tackling
  malnutrition. Breakfast cereals are one of the most commonly fortified foods and dominate many
  children’s diets globally. This paper examines more closely the voluntary commitments on fortification
  and their implementation by the world leader in breakfast cereals, Kellogg’s. The paper focuses on
  Mexico, where Kellogg’s dominates the breakfast cereal market: a 2013 national survey found that four of
  the five most commonly bought breakfast cereals for children are Kellogg’s brands.

  In its strategy documents, Kellogg’s articulates its responsibility to play a role ‘in tackling the global
  challenges of food security including undernutrition, hidden hunger, and obesity in middle- and low-income
  communities across the globe’ through delivering ‘healthy foods for people of all income levels in every
  country’. Kellogg’s also made bold claims that it had addressed ‘nutrition shortfalls’ and ‘improved Latin
  American cereals with the right amounts of Vitamins A, B and D, iron, calcium, folic acid and antioxidants.’

  To assess whether these claims are true, Changing Markets has assessed the micronutrient make-up of
  Kellogg’s breakfast cereals in Mexico. Our comparison of micronutrient levels in 2013 and 2018 reveals
  that, in the last five years, Kellogg’s cereals have become significantly poorer in terms of minerals and
  vitamins. Across the board, analysis of the five most popular Kellogg’s breakfast cereals showed that over
  two thirds of all micronutrients across all five cereals had been reduced or removed when compared to
  2013 levels. Several types of B vitamins and vitamins C and E have been significantly reduced or entirely
  removed. The levels of iron have been reduced in all five cereal brands analysed, despite the fact that iron
  deficiency rates among the Mexican population remained almost unchanged during this period.

  The findings show a lack of scientific rationale behind the fortification of Kellogg’s breakfast cereals. The
  company’s commitments and claims that Kellogg’s fortifies its cereals with ‘nutrients specific for the needs
  of the area’ in the case of Mexico seem to be empty words.

                                                                                                                  1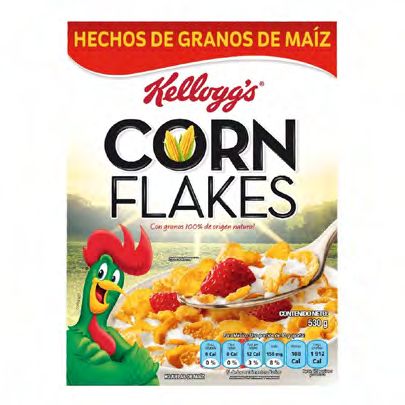
Cereal offender: is Kellogg’s breaking its breakfast promises?

                   1. Introduction

                   Micronutrients are essential vitamins and minerals that humans need to develop and maintain good health. Having a
                   balanced diet based on the consumption of unprocessed or minimally processed foods is one way to ensure that we get
                   the micronutrients we need. However, due to the inaccessibility and unaffordability of nutritionally rich foods for many
                   people, more than one in three people worldwide are deficient in vital micronutrients.1

                   Food fortification can help to correct or prevent micronutrient deficiencies and improve public health. Mandatory
                   fortification programmes are typically country-specific interventions that involve fortifying staple foods (such as flour,
                   salt and oil) with key nutrients in which a large proportion of the population is deficient. However, food fortification need
                   not take place solely through mandated or legislated programmes; market-driven, voluntary fortification can also play
                   an important role. In theory, the food industry could take straightforward and effective measures to tackle micronutrient
                   deficiencies to complement governmental regulation. Indeed, many companies already use fortification as a marketing
                   tool for some of their products or to comply with their own corporate social responsibility commitments. In this report,
                   we take a closer look at voluntary fortification by focusing on the micronutrient profile of breakfast cereals – one of the
                   most commonly fortified food products available globally.2

                   The nutrition profile of breakfast cereals is already fraught with controversy. Many breakfast cereals are classified as ultra-
                   processed foods, are high in added sugar and salt, and are often aggressively marketed to children. It is recommended
                   that children and adults reduce the consumption of ultra-processed foods, because of links to obesity.3 Nevertheless,
                   fortified breakfast cereals remain a major source of micronutrients worldwide, including in the United States and across
                   the European Union.4,5

                   Kellogg’s is the global market leader for breakfast cereals and makes some of the most well-known breakfast cereal products
                   on the market, such as Corn Flakes and Special K. Kellogg’s claims to be a ‘socially responsible’ business with the purpose
                   of ‘nourishing families so they can flourish and thrive’, and has made many commitments to tackling undernutrition and
                   micronutrient deficiencies worldwide.6

                   This report takes a look at the claims Kellogg’s makes in the context of its breakfast cereal product range in Mexico, where
                   micronutrient deficiencies are a major public health problem and many children eat breakfast cereals daily. According to
                   a national study, 42% of parents state that they buy breakfast cereals because their children ask for them, compared to
                   33% who buy them for their nutritional value.7 The same study also showed that 58% of the parents believe the claims
                   on package labels and other marketing materials. Interestingly, a 2017 study found that guideline daily amount labels and
                   nutritional claims were displayed more frequently on the breakfast cereals that the study classified as ‘less healthy’.8 It is
                   therefore worth considering the role that nutritional claims may play in the Kellogg’s marketing strategy, particularly for
                   their higher-sugar, -salt or -fat products, which may not be the healthiest daily breakfast choice for children.

2
How often do children between
3 and 12 years old consume
breakfast cereals in Mexico ?
3 years 12 years
1%
50 % Never
3%
2 to 3 times a week
Monthly
9%
Once a week
37 %
Every day
Source: PROFECO, 2013 3Cereal offender: is Kellogg’s breaking its breakfast promises?
2. Spotlight on Kellogg’s
2.1. Breakfast: the most important meal in the Kellogg’s day
Breakfast cereals are at the heart of Kellogg’s, a global company founded in 1906 that sells products in more than 180 countries.
Although Kellogg’s manufactures a broad range of snacks and convenience foods, it remains best known for its breakfast cereal
range. Founder W.K. Kellogg and his brother invented breakfast cereal in 1898,9 motivated by a desire to ensure the masses –
who had now shifted from farm to factory work – consumed wholewheat, which was deemed to counter ill health.10
Today, breakfast products continue to represent a very significant share of the company’s total sales. In the US market alone,
sales of Kellogg’s breakfast products are almost US $3bn, representing approximately 23% of the company’s nearly US $13bn
worldwide sales.11 Kellogg’s remains the leader of the global breakfast cereal market, which was valued at US $37bn in 2016.12
Kellogg’s is also the market leader in Mexico, with 43% of market share in 2017.13
2.2. Kellogg’s: a company with ‘heart and soul’?
Since its foundation, Kellogg’s has taken pride in its credentials as a company with the purpose of ‘nourishing families so
they can flourish and thrive’.14 The company claims that its objective ‘to win in the marketplace’ is intertwined with the wider
objective ‘to make a difference in people’s lives’ – an approach that is part of the legacy of W.K. Kellogg, a major conservationist
and philanthropist.15
In its strategy documents, Kellogg’s articulates its responsibility to play a role ‘in tackling the global challenges of food security
including undernutrition, hidden hunger, and obesity in middle- and low-income communities across the globe’ through delivering
‘healthy foods for people of all income levels in every country’. It also reiterates its commitment to supporting the achievement of
Sustainable Development Goals 2 and 3, relating to hunger and ensuring healthy lives, respectively.16
In its Nutrition Milestones strategy,17 Kellogg’s outlined its supposed commitment to nutrition and, thanks to articulating some
broad-brush policies on nutrition, improved its ratings in the 2018 Global Access to Nutrition Index (hereafter Global Index).18
Kellogg’s states it develops marketing strategies to reach undernourished populations in developing countries by providing
education materials to improve nutrition literacy, helping consumers to make informed food choices and making its products
more accessible and affordable to low-income groups.
This strategy is led by Kellogg’s Chief Growth Officer rather than a corporate social responsibility or nutritionist-lead team. The
2018 Global Index asserts:
[The Kellogg’s] ‘Growth 2020’ strategy, which aims to double the business in emerging
markets, is linked to commitments to provide targeted, fortified products that address
nutritional deficiencies in developing countries. Kellogg is one of only a few companies
that commit to creating and delivering marketing strategies appropriate to reaching
undernourished populations in developing countries.
But despite such accolades and declarations of good intentions, a closer analysis of the documentation created by Kellogg’s
exposes tactics that are commercially rather than philanthropically motivated; for example, creating reduced package sizes for
low-income populations, rather than making their products more affordable in real terms or improving nutrient levels. This
strategy of growth first, with nutrition as a mere side note, is evident in another Kellogg’s aim: to ‘win where the shopper shops’.19
4In relation to its business operations in Latin America specifically, Kellogg’s states:
[a]cross Latin America, we have been working to innovate and renovate our foods to reduce
the sugar and sodium levels. By the end of 2016, 46 percent of total portfolio complied with
the nutrient profile established by the government in Mexico and aligned to the Colombia &
Brazil nutrient profile voluntary pledges.20
However, this claim appears to refer entirely to reducing the levels of ingredients considered unhealthy when consumed in
large amounts, such as sugar and salt. For example, in some cereals in Mexico Kellogg’s are reducing sugar levels (in cereals
targeted at children) but they are replacing sugar with non-caloric sweeteners. It could be suggested that efforts by Kellogg’s
to improve the macronutrient profile of their cereals are lacklustre. It is unclear how this relates to Kellogg’s improving the
nutritional value of its products via fortification, or to responding to the population’s nutrient needs.
2.3. Kellogg’s: favouring fortification?
Kellogg’s claims to be committed to ‘preventing and addressing undernutrition micronutrient deficiencies, aligned to international
guidance, in developing countries through targeted fortification of our foods’, and identifies ‘Zinc, Iron, and Vitamin A as areas of
deficiency in many emerging markets’.21 The strategy further states: ‘Kellogg is also focused on our current fortification profiles for
each region to ensure we are delivering key nutrients specific for the needs of the area’.22
Moreover, Kellogg’s says it is investing in research and development, innovation, and reformulating its products to improve
their nutritional quality. It claims that such actions are informed by the assessment of ‘existing usage of key ingredients and
nutrients within products and region’23. This suggests that, when considering fortification strategies, Kellogg’s takes into account
how products are consumed, national laws and regulations, the nutrient needs and intake of the general population, and
technical feasibility.
In its 2017/18 Corporate responsibility report, Kellogg’s declared it was ‘focused on closing the gap on hidden hunger and micro/
macro nutrient deficiencies in emerging and developed markets’. Further, the company made bold claims that it had addressed
‘nutrition shortfalls’ and ‘improved Latin American cereals with the right amounts of Vitamins A, B and D, iron, calcium, folic acid
and antioxidants’. But these claims lack further explanation; it remains unclear what improvements Kellogg’s made or how
these were implemented.
5Cereal offender: is Kellogg’s breaking its breakfast promises?
3. Nutrient-rich or nutrients ditched?
Nutritional composition of Kellogg’s cereals
3.1. Disappearing nutrients: the example of Mexico
Studying the labels of Kellogg’s cereal products currently on sale in Mexico, it is hard to conclude how their fortification reflects
either the population’s needs or their consumption of products. The nutrient makeup of Kellogg’s cereals can vary dramatically;
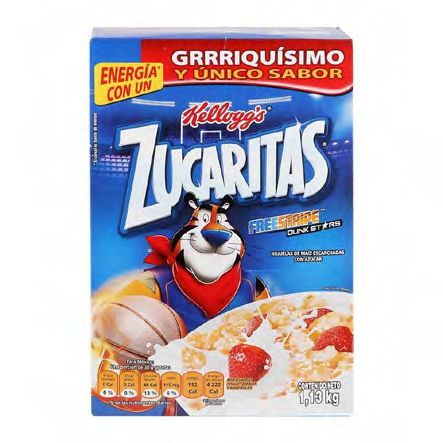
a 30g portion of Zucaritas contains just 10% of the recommended dietary allowance (RDA) of iron, whereas the same amount of
Apple Jacks contains 25%. (see table below) i
The variation in levels of micronutrients is not only confined to differences between Kellogg’s cereal brands; it seems that
differences in nutrient levels can be highly pronounced even within the same core brand. For example, a 30g portion of
chocolate- or vanilla-flavoured Special K contains 35% of the RDA of B12, whereas the same amount of Special K Cosecha Roja
contains a mere 11%. The rationale for such a stark difference in nutrient levels for products within the same range is unclear.
Furthermore, consumers might assume fortification levels to be consistent between these very similar products, which are also
expected to be consumed by same population demographic.
Table 1: Contribution (%) of one portion of Kellogg’s cereals towards RDA of micronutrients in Mexico in 2018 (values adjusted to 30g portion size)
Name Vitamin Vitamin Vitamin Vitamin Vitamin Vitamin Vitamin B3 Vitamin Vitamin Vitamin Calcium Iron Zinc
A C D E B1 / B2 / / Niacin B6 B9 / Folic B12
Thiamin Riboflavin acid
ALL BRAN Chocolate 26% 19% 26% 19% 26% 15% 19%
ALL BRAN Original 26% 19% 26% 19% 26% 15% 19%
APPLE JACKS 25% 25% 15% 50% 50% 45% 50% 25% 70% 25% 15%
CHOCO KRISPIS 35% 25% 25% 25% 10% 35% 16% 20% 25%
CHOCO KRISPIS Crookies 35% 25% 25% 25% 10% 35% 15% 20% 25%
CORN FLAKES 35% 25% 35% 25% 35% 20% 25%
CORN FLAKES
35% 40% 40% 25% 35% 20%
(Edición especial)
CORN POPS 35% 25% 35% 25% 35% 20% 25%
EXTRA Arándanos 26% 19% 26% 19% 26% 15% 19%
EXTRA Chocolate 35% 25% 35% 25% 35% 20% 25%
FROOT LOOPS 35% 25% 35% 25% 35% 20% 25%
SPECIAL K Cosecha Roja 26% 11% 19% 8% 11% 11% 11% 19%
SPECIAL K Original 15% 15% 15% 10% 35% 10% 20% 15%
SPECIAL K Proteína & Calcio 19% 11% 2% 8% 26% 15% 15% 19%
SPECIAL K Sabor Chocolate 15% 15% 15% 10% 35% 15% 20% 15%
SPECIAL K Sabor
15% 25% 15% 10% 35% 15% 20% 25%
Vainilla con Almendras
ZUCARITAS 25% 15% 15% 40% 40% 40% 40% 15% 40% 10% 15%
ZUCARITAS NutriCrisp 25% 25% 25% 40% 40% 40% 40% 15% 35% 20% 25%
Sources: Product labels
i For the purpose of food and drink labelling requirements, Mexican legislation NOM-051-SCFI/SSA1-2010 includes RDAs of
micronutrients for the Mexican population. Available from: http://dof.gob.mx/nota_detalle.php?codigo=5137518&fecha=05/04/2010
6
3.2. Mind the gap: matching nutrients to nutrition needs
Kellogg’s classifies its emerging markets as countries with low, high or moderate deficiency in zinc, iron and vitamin A. It
classifies Mexico as having moderate deficiency rates. This is backed up by Mexican government surveys, which have recorded
that one in four children under five suffer from anaemia, and 1.6 million children have a low height for their age due to chronic
malnutrition.24 Further, according to the National Health Survey, children and adults in Mexico do not get enough calcium
through their diets alone.25
Chart 1: Percentage of Mexican children aged 5 to 12 years old with insufficient intake of major micronutrients
High
High
Severity
of deficiency Low Moderate Moderate
Percentage
of range >10% 15 - 23% 15 - 23% 46 - 52% 55 - 88%
Micronutrient ZnZinc
A
Vitamin A
B 9
Folic Acid
Fe
Iron
Ca
Calcium
Source: Mexico Instituto Nacional de Salud Pública (2012)26
Chart 2: What types of cereals parents in Mexico buy for their children
Most of the time, which breakfast cereal do you buy for your children? (by number of mentions)
Zucaritas de Kellogg’s 26%
Corn Flakes de Kellogg’s 23%
Choco Crispis de Kellogg’s 19%
Froot loops de Kellogg’s 10%
Nesquick de Nestlé 6%
Corn Pops de Kellogg’s 4%
All Bran de Kellogg’s 2%
Corn Flakes de Nestlé 2%
Azucaradas de Maizoro 2%
Special K Kellogg’s 1%
Trix de Nestlé 1%
Choco Zucaritas Kellogg’s 1%
La Lechera Flakes 1%
Corn Flakes de Maizoro 1%
Zucosos de Nestlé 1%
0% 5% 10% 15% 20% 25% 30%
Source: PROFECO, 2013
Our research prompts further questions regarding how Kellogg’s puts its positive words into practice when fortifying its cereals.
Comparison of the nutrient content of a number of Kellogg’s products in 2018 against levels reported on product labels in
2013 reveals that, in the last five years, Kellogg’s has removed essential micronutrients from its cereals in Mexico. As Table 2
shows, the levels of iron have been reduced in all five cereal brands analysed, despite the fact that iron deficiency in Mexico
remained almost unchanged during this period. In fact, national studies have shown that anaemia (predominantly caused by
iron deficiency) actually increased in prevalence.27
7Cereal offender: is Kellogg’s breaking its breakfast promises?
Table 2: Variation (%) in micronutrient composition, 2013–2018
Vitamin A Vitamin C Vitamin D Vitamin E Vitamin B1 Vitamin B2 Vitamin B3 Vitamin B6 Vitamin B9 Vitamin B12 Calcium Iron Zinc
Thiamin Riboflavin Niacin Folic acid
+ 133% 0% + 150% - 1 00% - 100% - 100% - 100% - 60% + 40% + 7% - 20% + 67%
+ 75% - 17% - 100% - 100% - 100% - 100% - 100% - 64% 0% - 100% - 50% +25%
- 100% - 100% - 100% + 14% - 100% - 100% + 14% - 64% 0% - 100% - 50% - 100%
EDICION ESPECIAL
- 60% - 100% 0% - 100% - 100% - 100% - 100% - 70% - 53% - 56%
+ 67% - 40% - 100% - 20% - 20% - 20% - 20% - 70% - 20% - 100% - 60% + 50%
Source: Product labels
When we state ‘increase’ it is because the levels of micronutrients were not available for 2013, therefore it was not possible to quantify the increase.
Considering Mexican legislation requires micronutrient levels to be stated on labels of any fortified foods, we have assumed that it is unlikely the product contained any additional nutrients
in 2013, if no information was stated on the label at that time. If information is given in 2018, we have thus assumed this is de facto an increase albeit an unquantifiable one.
B 9
Folic Acid
Ca
Calcium
Fe Iron
%
0
-10
-20
-30
-40
-50
-60
-70 - 50%
-80 - 64%
-90
-100
- 100%
% change from 2013 to 2018
0
-10
-20
-30
-40
-50
-60
-70
-80 - 60%
-90 - 70%
-100
- 100%
%
Calcium was Iron levels
Folic Acid has been
removed entirely in Corn Flakes
reduced by over two
from Corn Flakes have been halved
thirds in Zucaritas
and Zucaritas
B 9
Folic Acid
CaCalcium
Fe
Iron
Source: Product labels
8As Table 2 shows, with the exception of an increase in the levels of zinc, Kellogg’s cereals have become significantly poorer
in terms of minerals and vitamins. It is especially striking, how significantly Kellogg’s has reduced the levels of folic acid and
vitamins B, C and E. With the exception of vitamin B12 in Choco Krispis and Vitamin B1 in Corn Flakes (edición especial),
vitamins B have been significantly reduced and in many cases entirely removed from the cereal products that are most popular
among Mexican children, such as Zucaritas, Corn Flakes and Choco Krispis.28 Since B vitamins are among the more expensive
micronutrients, and have been removed from products with some of the highest market share, this could indicate that Kellogg’s
is primarily motivated by profits and not by its commitment to address undernutrition and micronutrient deficiencies.
This comparison shows that the Kellogg’s fortification strategy is wildly inconsistent, rarely following rhyme or reason. In the
past five years Kellogg’s has dramatically reduced the nutrients in several of its core products, particularly those marketed to
and consumed by children. This contradicts the company’s commitments. Claims that Kellogg’s fortifies its cereals based on
‘nutrients specific for the needs of the area’29 seem to be empty words in the case of Mexico.
4. Conclusion
Kellogg’s marketing materials and policies make for reasonable reading when it comes to nutrition and fortification, but the
nutritional content of its products seems to be primarily driven by profits – not by the nutritional needs of the populations in
question.
Most Kellogg’s breakfast cereals are high in macronutrients and processed ingredients that are associated with an unhealthy
diet, such as sugar and salt, and the company often uses the addition of micronutrients as a marketing ploy to make their
products appear healthier. Given that the macronutrient profiles of Kellogg’s breakfast cereals already lead many to question
the nutritional value of these products, our analysis has unveiled a worrying trend of further reducing the nutritional value of
Kellogg’s breakfast cereals through the apparent removal of vital micronutrients.
The findings in this report ask some stark questions of the world’s cereal giant. What is its rationale for removing or reducing
certain micronutrients in different types of cereals if the population has not shown improvements in deficiency levels? Why the
dramatic difference in micronutrient content over the course of a few years? Why are some cereals from the same product range
fortified with different levels of nutrients? These questions show a lack of scientific rationale behind the fortification policies of
Kellogg’s breakfast cereals.
If Kellogg’s is serious about playing its part in making its customers healthier and increasing their wellbeing, the company must
explain why its products have such confusing and varied nutrient levels – even within the very same brand of cereal. Its policies
demonstrate that Kellogg’s is well aware it plays a vital role in the nutrition intake of its customers, but with these findings
we have to ask whether Kellogg’s is prioritising profit growth over the health of the children and adults who eat their cereals.
Smaller packets, and marketing strategies that talk a good game, might line the pockets of shareholders – but they are not lining
the stomachs of consumers with nutrient-rich foods. Kellogg’s must urgently review its practices to fit its supposed policies. It is
time for Kellogg’s to start living up to its ideals by providing consistent fortification for its cereals and other products.
9Cereal offender: is Kellogg’s breaking its breakfast promises?
References
1. The Micronutrient Initiative and UNICEF (2004) Vitamin & mineral deficiency: A global progress report [ONLINE] Avail-
able at: https://www.unicef.org/media/files/vmd.pdf.
2. Kellogg’s (n.d.) Food fortification in focus [ONLINE] Available from: https://www.kelloggsnutrition.com/en_AE/knowl-
edge/nutrition/foodfortification.html.
3. National Health Service (2017) Healthy breakfast cereals [ONLINE] Available from: https://www.nhs.uk/live-well/eat-
well/healthy-breakfast-cereals/.
4. Fulgoni, V.L. and Buckley, R.B. (2015) The contribution of fortified ready-to-eat cereal to vitamin and mineral intake
in the U.S. population, NHANES 2007–2010. Nutrients, 7(6): 3949–3958 [ONLINE] Available from: https://www.ncbi.
nlm.nih.gov/pmc/articles/PMC4488767/.
5. Williams, P.G. (2014) The benefits of breakfast cereal consumption: A systematic review of the evidence base.
Advances in Nutrition, 5(5): 636S–673S [ONLINE] Available from: https://academic.oup.com/advances/arti-
cle/5/5/636S/4565784.
6. Kellogg’s (n.d.) Nourishing families so they can flourish and thrive: Kellogg’s nutrition [ONLINE] Available from: http://
crreport.kelloggcompany.com/download/KelloggNutritionMilestones.pdf.
7. Mexico Profeco (2011) Sondeo cara a cara sobre consumo de cereales [ONLINE] Available from: https://www.profeco.
gob.mx/encuesta/mirador/2011/Sondeo_cereales.pdf.
8. Nieto, C., Patiño, S.R.-G., Tolentino-Mayo, L., Carriedo, A. and Barquera, S. (2017) Characterization of breakfast cereals
available in the Mexican market: Sodium and sugar content. Nutrients, 9(8): 884 [ONLINE] Available from: https://
www.ncbi.nlm.nih.gov/pmc/articles/PMC5579677.
9. Kellogg’s (n.d.) Our best days are yours [ONLINE] Available from: https://www.kelloggs.com/en_US/who-we-are/
our-history.html.
10. Oksman, O. (2016) How lobbyists made breakfast ‘the most important meal of the day’. The Guardian, 28 November
[ONLINE] Available from: https://www.theguardian.com/lifeandstyle/2016/nov/28/breakfast-health-america-kel-
log-food-lifestyle.
11. Kellogg’s (2017) 2017 Annual report [ONLINE] Available from: http://www.annualreports.com/HostedData/AnnualRe-
ports/PDF/NYSE_K_2017.pdf.
12. Grand View Research (2018) Breakfast cereal market size, share & trends analysis report by product (RTE, hot cereal),
by distribution channel (supermarket, e-commerce, convenience store), by region, vendor landscape, and segment
forecasts, 2018–2025 [ONLINE] Available from: https://www.grandviewresearch.com/industry-analysis/breakfast-ce-
reals-market.
13. Euromonitor International (2018) Breakfast cereals in Mexico: Country report [ONLINE] Available from: https://www.
euromonitor.com/breakfast-cereals-in-mexico/report.
14. Kellogg’s (n.d.) Corporate responsibility [ONLINE] Available from: http://crreport.kelloggcompany.com/.
15. Kellogg’s (2018) Nourishing families so they can flourish and thrive: 2017/2018 Corporate responsibility report [ONLINE]
Available from: http://crreport.kelloggcompany.com/download/Kellogg+Company+CR-Report+2017-18.pdf.
16. Kellogg’s (n.d.) Nourishing families so they can flourish and thrive: Kellogg’s nutrition [ONLINE] Available from: http://
crreport.kelloggcompany.com/download/KelloggNutritionMilestones.pdf.
17. Kellogg’s (n.d.) Nourishing families so they can flourish and thrive: Kellogg’s nutrition [ONLINE] Available from: http://
crreport.kelloggcompany.com/download/KelloggNutritionMilestones.pdf.
18. Access to Nutrition Index (2018) Global index 2018: Ranking 2018 [ONLINE] Available from: https://www.accesstonu-
trition.org/index/global.2018.
19. Kellogg’s (n.d.) Nourishing families so they can flourish and thrive: Kellogg’s nutrition [ONLINE] Available from: http://
crreport.kelloggcompany.com/download/KelloggNutritionMilestones.pdf.
20. Kellogg’s (n.d.) Nourishing families so they can flourish and thrive: Kellogg’s nutrition [ONLINE] Available from: http://
10crreport.kelloggcompany.com/download/KelloggNutritionMilestones.pdf.
21. Kellogg’s (n.d.) Nourishing families so they can flourish and thrive: Kellogg’s nutrition [ONLINE] Available from: http://
crreport.kelloggcompany.com/download/KelloggNutritionMilestones.pdf.
22. Kellogg’s (n.d.) Nourishing families so they can flourish and thrive: Kellogg’s nutrition [ONLINE] Available from: http://
crreport.kelloggcompany.com/download/KelloggNutritionMilestones.pdf.
23. Kellogg’s (n.d.) Nourishing families so they can flourish and thrive: Kellogg’s nutrition [ONLINE] Available from: http://
crreport.kelloggcompany.com/download/KelloggNutritionMilestones.pdf.
24. Gutiérrez, J. et al. (2013) Encuesta Nacional de Salud y Nutrición 2012. Resultados Nacionales. Cuernavaca: Instituto
Nacional de Salud Pública.
25. Rivera, J.A., Pedraza, L.S., Aburto, T.C., Batis, C., Sánchez-Pimienta, T.G., González de Cosío, T., López-Olmedo, N.
and Pedroza-Tobías, A. (2016) Overview of the dietary intakes of the Mexican population: Results from the National
Health and Nutrition Survey 2012. Journal of Nutrition, 146(9): 1851S–5S [ONLINE] Available from: https://www.ncbi.
nlm.nih.gov/pubmed/27511939.
26. Mexico Instituto Nacional de Salud Pública (2016) 2016 Encuesta Nacional de Salud y Nutrición [ONLINE] Available
from: https://ensanut.insp.mx/ensanut2016/index.php.
27. Mexico Instituto Nacional de Salud Pública (2016) 2016 Encuesta Nacional de Salud y Nutrición [ONLINE] Available
from: https://ensanut.insp.mx/ensanut2016/index.php.
28. Revista del Consumidor (2011) El Laboratorio Profeco Reporta: Estudio de Calidad: Cereales Para Niños ¿El Desayuno de
los Campeones? [ONLINE] Available from: https://www.gob.mx/cms/uploads/attachment/file/119166/Estudio_Cere-
ales_para_nin__os_30-44_Abril_2011.pdf.
29. Kellogg’s (n.d.) Nourishing families so they can flourish and thrive: Kellogg’s nutrition [ONLINE] Available from: http://
crreport.kelloggcompany.com/download/KelloggNutritionMilestones.pdf.
11www.changingmarkets.org This report was published in February 2019 by the Changing Markets Foundation. This report has been written and researched by the Changing Markets Foundation in collaboration with independent researchers. The purpose of the report is to shed light on industry-specific issues related to fortification of breakfast cereals. The information in this document has been obtained from sources believed reliable and in good faith. The authors accept no liability whatsoever for any direct or consequential loss arising from the use of this document or its contents. Designed by Pietro Bruni - helloo.org
You can also read