Characteristics of Light Absorbing Carbonaceous Aerosols in Southeast Asia - LCLUC
←
→
Page content transcription
If your browser does not render page correctly, please read the page content below
Characteristics of Light Absorbing Carbonaceous
                        Aerosols in Southeast Asia

      Max Gerrit Adam, Andrew Chiang, Rajasekhar Balasubramanian

                  Department of Civil and Environmental Engineering,
                          National University of Singapore

                 South/Southeast Asia Research Initiative (SARI) meeting
                                Johor Bahru, Malaysia
23/07/2019                                                                 1
Outline
       1. Introduction

       2. Objectives

      3. Materials & Methods

       4. Results

       5. Conclusions and implications

23/07/2019                               2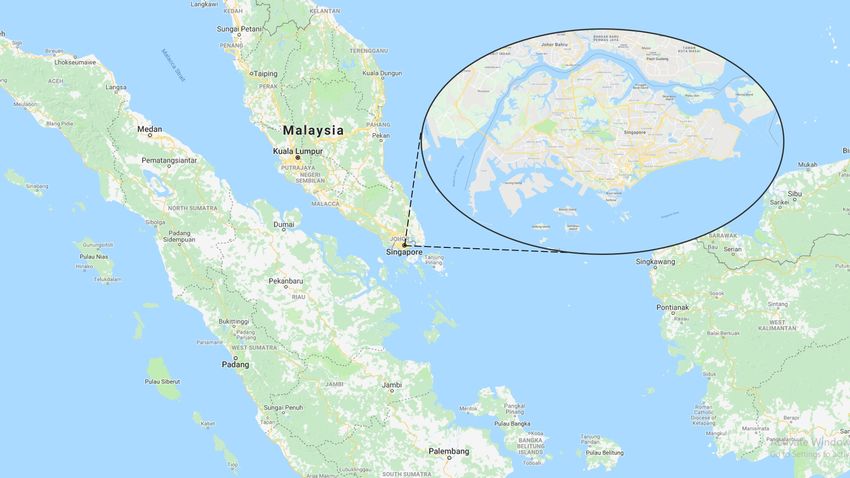
Climate impacts of Black Carbon and Brown Carbon

                            LACA = BC and BrC

 Black Carbon (BC)                                             Brown Carbon (BrC)
• BC is the most strongly light-absorbing component of         • Light-absorbing component of organic carbon (OC)
  particulate matter (PM)                                      • Aging affects light-absorbing properties
• Affects climate by:                                          • Radiative impacts on atmosphere uncertain
    • Directly absorbing sunlight (⇒ warming)
    • Darkening clouds, snow and ice (⇒ warming)
    • Altering precipitation and cloud patterns (uncertain ⇒
      cooling and/or warming)
• Remains in atmosphere days to weeks
• Atmospheric processes (‘aging’) affects light-absorbing
  properties

  23/07/2019                                                                                                3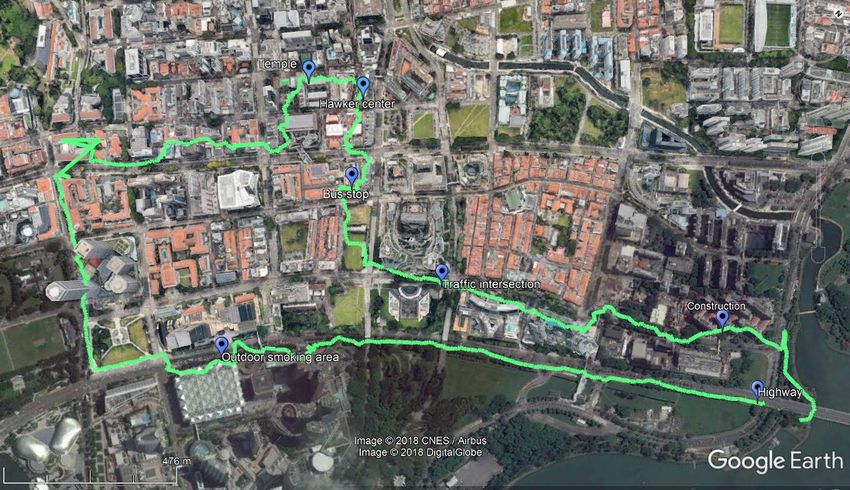
Climate impacts of Black Carbon and Brown Carbon

• Atmospheric Brown Cloud (ABC): build-up of aerosols emitted from
   coal burning, combustion, biomass burning, industrial processes in
   South Asia (China, India among others) during winter monsoon
   season.

                                                                                                  IPCC-AR5
                                                                        Large uncertainties associated with
                                                                        direct radiative forcing of BC and OC.

    23/07/2019                                                                                         4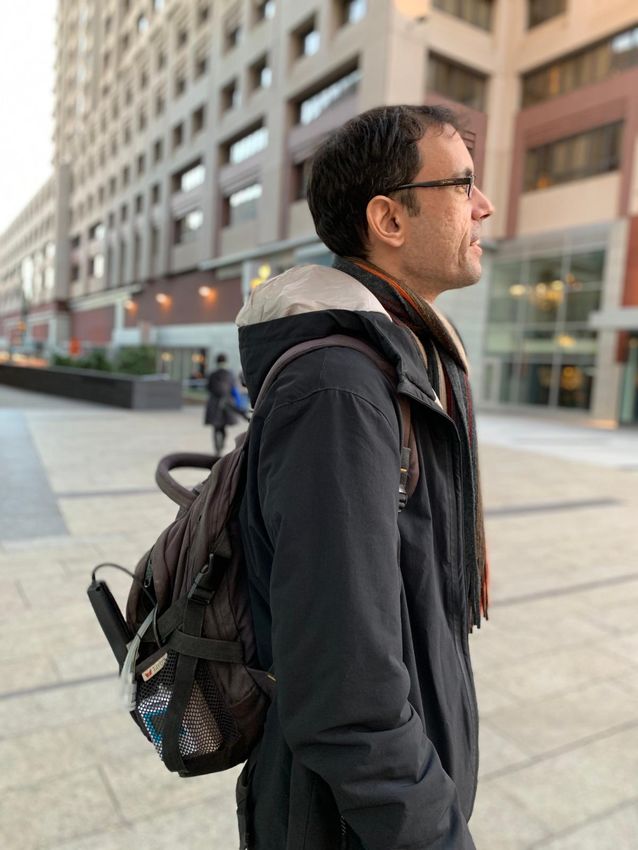
Sources of BC and BrC
                              LACA = BC and BrC

      Black Carbon (BC)                           Brown Carbon (BrC)
    • Incomplete combustion of fossil fuels       • Biomass burning
    • Biomass burning                             • Photochemical reactions of volatile
                                                    organic compounds (VOCs)

23/07/2019                                                                                5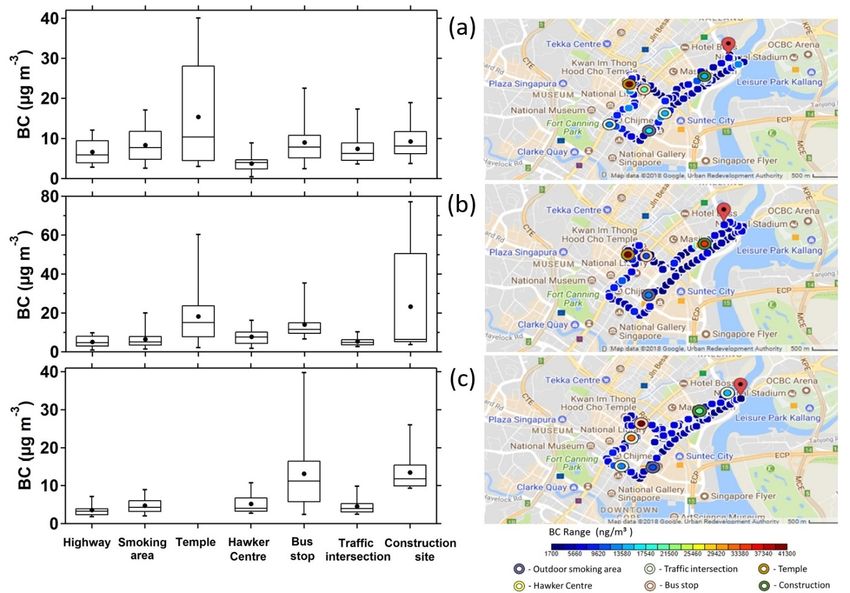
Health effects of BC
                                                               PM2.5   PM0.1
                                                        PM10

• BC usually less than 100 nm in diameter.
• A range of human health effects are associated
  with inhalation of fine particulate matter (PM less
  than 2.5 µm) and its component BC.
• Once inhaled, BC particles (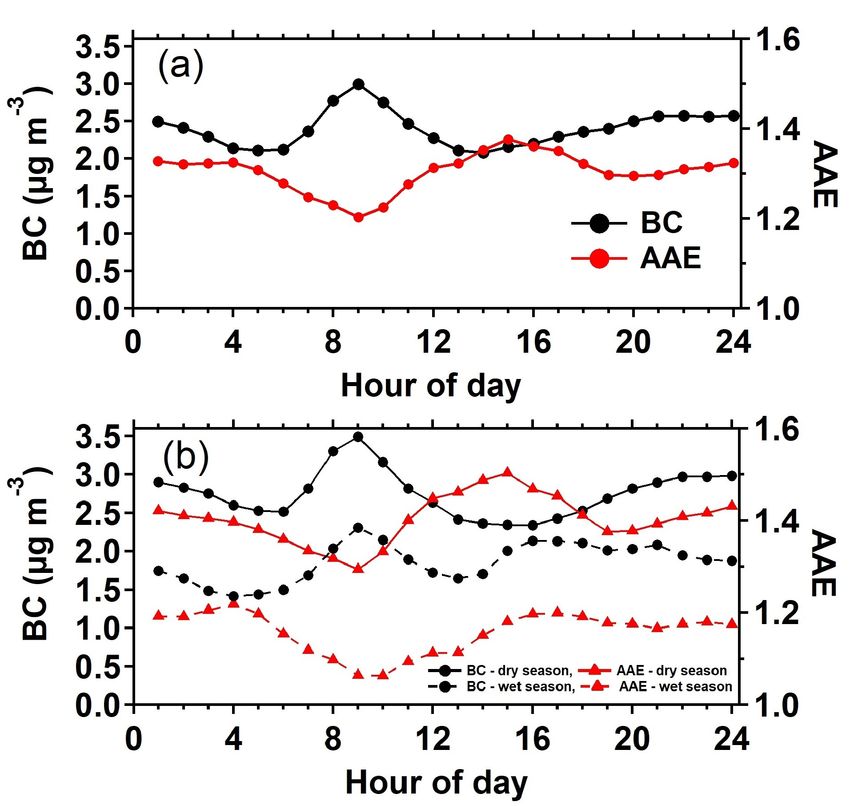
Objectives • To study the temporal and spatial variations of BC in an urban environment fixed site and personal exposure monitoring of BC. • To characterize the optical properties of water-soluble organic carbon, the water-soluble fraction of BrC. • Form a scientific basis for development of environmental policies to mitigate climate change and to improve urban air quality.
Materials and Methods

23/07/2019                           8

Black carbon measurements
Aethalometer AE33                                             microAeth AE51

                                                                                    Personal exposure
                              Fixed site measurements
                                                                                    measurements

• Optical method to measure absorption due to aerosols      • Handheld, portable version of AE33
  at 7 wavelengths (370, 470, 520, 590, 660, 880, 950 nm)     based on same working principle
  in real-time                                              • Only absorption at one wavelength
• BC collected on filter tape                                 (880 nm)
• Absorption at wavelength 880 nm is exclusively due to
  BC and proportional to BC mass concentration

   23/07/2019                                                                                  9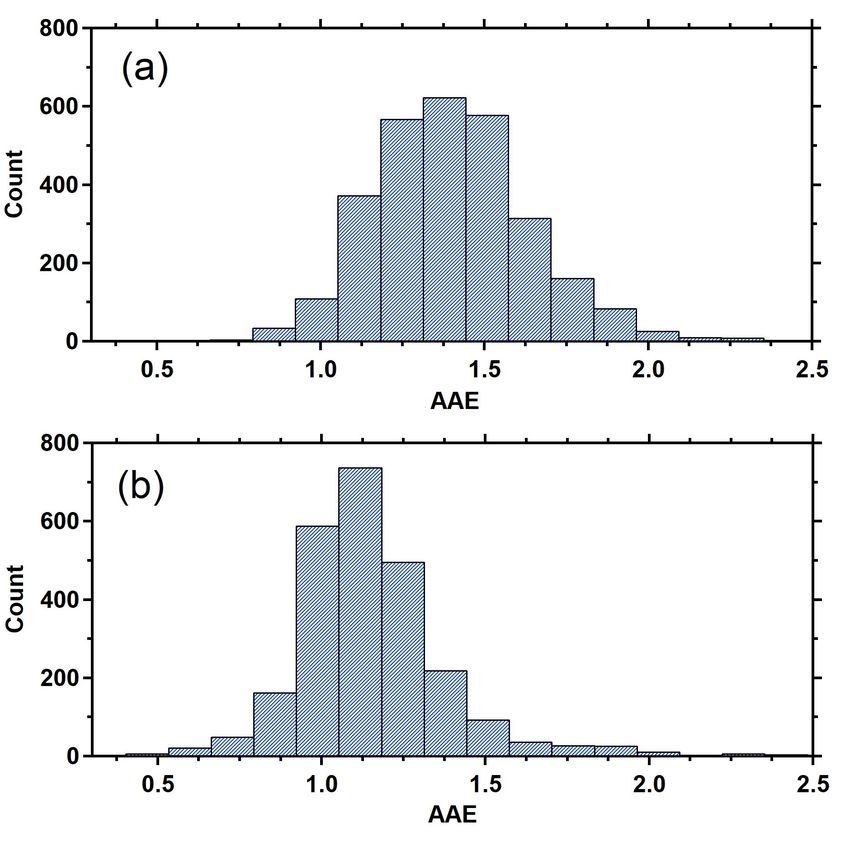
Analysis of BrC measurements

                                                          Light absorption properties determined

                               UV-VIS Spectrophotometer    Absorption Ångström Exponent, AAE
                                    (200 – 800 nm)
                                                           Mass Absorption Efficiency, MAEBrC

                                  WSOC
TAS MiniVol                                           1     2                       3
                                 Analysis
PM2.5 Samples from:
1) NUS Rooftop
2) Roadside
3) Samples from 2015 haze episode (Sep/Oct)
Geographical Location of Monitoring Locations
Malaysia
Singapore
Indonesia
Singapore
Southwest monsoon – dry
Northeast monsoon – wet
1) NUS - fixed BC monitoring site
1
2 2) Central Business District - personal exposure
3 BC
5
4 3) AYE Expressway
4) Jurong Island & Tuas Industrial Areas
6 5) Pasir Panjang Terminal
6) SeaRoute and locations of mobile study Microenvironments monitored (7 km route): • Highway • Bus Stop • Traffic Intersection • Construction Site • Smoking Area • Temple • Hawker Centre Three different timings of the day: - morning - afternoon - evening
Results

23/07/2019             13
Seasonal variation of BC and AAE
Dry season Wet season
(a) BC
• Higher BC concentrations during Southwest
monsoon season (dry; June to October) compared
to Northeast monsoon (wet; December to March).
(b) AAE
AAE = 1 for ‘pure’ BC from fossil fuel
AAE > 1.8 for biomass burning aerosol
AAE computed over wavelength range 370 - 950 nm
• Correspondingly higher AAE values during dry compared
to wet season.
• Higher AAE values indicative of absorption at lower
wavelengths BrC. Influence of biomass burning
emissions from transboundary transport.
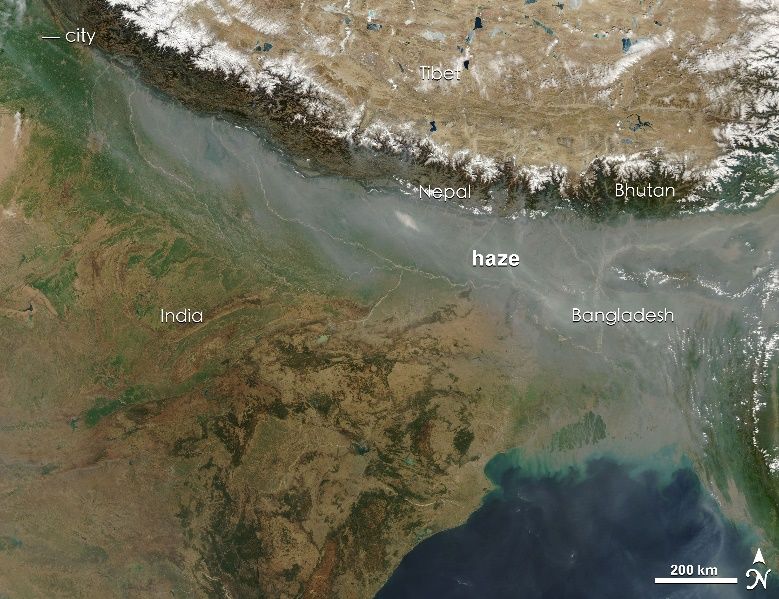
23/07/2019 14Fire hotspot activity in SEA
Singapore
• Illustrative example, 30 July 2017:
- NOAA HYSPLIT 96-hour airmass back-trajectory
- fire hotspot activity (NOAA, Visible Infrared Imaging Radiometer Suite (VIIRS))
23/07/2019 15Diurnal variation of BC and AAE
Maximum BC Minimum AAE (~1)
(a) Entire dataset
• BC peak between 8 – 10 am, coinciding with peak
morning rush hour traffic.
• Daytime minimum BC due to dilution effects (boundary
layer expansion, sea breeze)
• Daytime maximum AAE in conjunction with PM2.5
maximum indicative of photochemical formation of BrC
(b) Grouped by season
• Diurnal variation of BC and AAE lower during wet
season compared to dry season.
• During wet season, BC secondary peak observed,
and AAE peaks at a later time compared to dry
season.
23/07/2019 16Radiative properties of WSOC
Parameter Rooftop Roadside Smoke-haze
AAE 3.51 ± 0.91 2.43 ± 0.65 3.93 ± 1.48
MAE, m2/g 1.46 ± 0.56 2.36 ± 0.47 1.45 ± 0.50
AAE and MAE were determined for samples taken during the wet season:
• Roadside measurements indicate presence of BrC from traffic emissions.
• Secondary formation of WSOC (through photochemical reactions of
VOCs) likely responsible for higher AAE values at rooftop location.
• Highest AAE from smoke-haze sample while bleaching of chromophores
may be responsible for relatively low MAE values.
• The differences of the AAE and MAE of WSOC in Singapore compared to
the other studies can be attributed to differences in formation and/or
pollution sources.
23/07/2019 17Personal exposure measurements of BC
• Highest exposure at construction site and
temple.
• Lowest exposure at highway and food court
(hawker centre).
• Consistent enhancement of personal exposure
measurements compared to background BC
levels measured at NUS rooftop.
Enhancement of BC in microenvironments
compared to fixed monitoring site
motorized
Non-
motorized
(a) Morning (0730-1000 local time); (b) Afternoon (1200-1430 LT); (c) Evening (1930-2200 LT)
23/07/2019 18Conclusions • BC shows seasonal variations in Singapore with higher BC values during dry season compared to wet season. • The diurnal cycle of BC and AAE indicates strong influence from traffic emissions. • Higher biomass burning contribution during dry season inferred from AAE and air mass trajectories + fire hotspots. • WSOC measurements indicate presence of BrC from traffic emissions as well as photochemical production of BrC from VOC precursors. • Personal exposure measurements of BC in different microenvironments indicate consistently higher values than fixed monitoring values. Highest exposure values were observed at a construction site and temple. 23/07/2019 19
Implications of this study

• Reductions of fossil fuel burning related emissions will lead to near-term
  climate change benefits on several scales (local to global) not only in terms of
  BC reductions but also BrC which has in several recent studies shown to
  potentially significantly contribute to atmospheric warming.

• Personal exposure monitoring of BC on an intra-urban scale is advised to
  identify hotspots of anthropogenic air pollution consequently enabling urban
  authorities to provide advisories to the public to safeguard human health.

  23/07/2019                                                                  20
Thank you!

23/07/2019                21
Additional slides

23/07/2019                       22
Sources of Black Carbon

             Open burning: BC+ organic carbon    Residential cooking: BC + organic carbon

             Transportation: Diesel is BC rich     Industry (coke) BC and sulfate

23/07/2019                                                                                  23
BC coating and lensing effect
Evolution of BC in the atmosphere (‘aging’) Lensing effect
23/07/2019 2423/07/2019 25
Black carbon measurements
 Aethalometer AE33                                                      microAeth AE51

                                                                                               Personal exposure
                                     Fixed site measurements
                                                                                               measurements

Parameters                                                              Parameters
BC Detection         100 μg/m3                                BC Detection      0 – 1 mg/m3
Range                                                                   Range
Time Base            1 min                                              Time Base         10 - 60 sec
Flow Rate            3 l/min                                            Flow Rate         150 ml/min
Wavelengths Used 370, 470, 520, 590, 660, 880 & 950 nm                  Wavelength Used   880 nm
BC concentration measurement is defined by the absorption measurement
                             at 880 nm

     23/07/2019                                                                                         26
Setup for personal exposure data collection 23/07/2019 27
Air mass back-trajectory analysis
• HYbrid SingleParticle Lagrangian Integrated Trajectory (HYSPLIT) is used to
  determine the back-trajectories
• Application: e.g. to address whether the trajectory originated over land or
  ocean; rising or sinking air parcel
• Useful for interpretation of the OA factors

                                     Example of air mass
                                     back-trajectory

   15/08/2019                                NUS                                28
Timeseries of BC fixed site measurements
• Measurements from mid-May 2017 to end of March 2018
• Hourly average shown
• Mean BC = 2.44 ± 1.51 µg/m3
23/07/2019 29Frequency distribution of BC and AAE
Dry season
Wet season
Frequency distribution of hourly BC values.
Entire dataset (n = 6403).
Frequency distribution of hourly AAE values,
grouped by dry and wet season.
23/07/2019 30Diurnal PM2.5 from fixed site monitoring (NEA) 23/07/2019 31
BC effects and benefits

23/07/2019                             32
You can also read