Characterizing Online Engagement with Disinformation and Conspiracies in the 2020 U.S. Presidential Election
←
→
Page content transcription
If your browser does not render page correctly, please read the page content below
Characterizing Online Engagement with Disinformation and Conspiracies in the
                                                                 2020 U.S. Presidential Election

                                                                     Abstract                                     Distortion of facts to promote disinformation and propa-
arXiv:2107.08319v1 [cs.SI] 17 Jul 2021

                                                                                                               ganda greatly reduces trust in online systems, because of
                                           Identifying and characterizing disinformation in political dis-     its ability to influence both individual opinions and social
                                           course on social media is critical to ensure the integrity of
                                           elections and democratic processes around the world. Persis-
                                                                                                               dynamics (Van der Linden 2015; Nyhan and Reifler 2010).
                                           tent manipulation of social media has resulted in increased         At an individual level, exposure to unreliable and conspir-
                                           concerns regarding the 2020 U.S. Presidential Election, due         atorial narratives has been observed to influence people’s
                                           to its potential to influence individual opinions and social dy-    perceptions of the truth and decrease pro-social behaviours
                                           namics. In this work, we focus on the identification of dis-        (Van der Linden 2015; Nyhan and Reifler 2010). Moreover,
                                           torted facts, in the form of unreliable and conspiratorial narra-   with polarized and partisan narratives, it can further exacer-
                                           tives in election-related tweets, to characterize discourse ma-     bate prejudices and ideological separations (Jolley, Meleady,
                                           nipulation prior to the election. We apply a detection model        and Douglas 2020). Secondly, the disinformation landscape
                                           to separate factual from unreliable (or conspiratorial) claims      is complex, with possibilities for injecting disinformation,
                                           analyzing a dataset of 242 million election-related tweets.         propaganda, and influencing the discourse through automa-
                                           The identified claims are used to investigate targeted topics
                                           of disinformation, and conspiracy groups, most notably the
                                                                                                               tion (Ferrara et al. 2020), coordination (Sharma, Ferrara, and
                                           far-right QAnon conspiracy group. Further, we characterize          Liu 2020), compromised accounts, follow trains and others
                                           account engagements with unreliable and conspiracy tweets,          (Torres-Lugo, Yang, and Menczer 2020). The range of ac-
                                           and with the QAnon conspiracy group, by political leaning           tivities can be widespread, with both concealed and overt
                                           and tweet types. Finally, using a regression discontinuity de-      efforts to promote manipulative narratives.
                                           sign, we investigate whether Twitter’s actions to curb QAnon           In the context of the 2020 U.S. 2020 presidential elec-
                                           activity on the platform were effective, and how QAnon ac-          tion, held on November 3, 2020, since Twitter is recognized
                                           counts adapt to Twitter’s restrictions.                             as one of the social media platforms with the most news-
                                                                                                               focused users, with significant following in U.S. politics
                                                                 Introduction                                  (Hughes and Wojcik 2019 (accessed March 20, 2020), we
                                                                                                               investigate and characterize disinformation on Twitter, with
                                         Disinformation and social media manipulation has threat-              an analysis of more than 240 million election-related tweets,
                                         ened the integrity of elections and democracies around the            collected between June 20, 2020 and September 6, 2020. We
                                         world. In the 2016 U.S. Presidential Election, official in-           focus on the following research questions to characterize on-
                                         vestigations by the U.S. Congress revealed the presence of            line engagement with disinformation and conspiracies:
                                         Russian state-backed operations attempting to manipulate
                                         the U.S. political landscape. In the years following the in-          • R1. What are the prevalent disinformation and con-
                                         vestigation, social media platforms like Twitter and Face-              spiracy narratives on Twitter preceding the U.S. 2020
                                         book have actively documented several other suspicious op-              Election? We apply and train a detection model to sep-
                                         erations linked to Russia, Iran, Venezuela, China and other             arate factual from unreliable (or conspiratorial) claims to
                                         countries (Gadde and Roth 2018), suggesting presence of                 examine how the political discourse was manipulated.
                                         persistent efforts to manipulate online discussions. Although         • R2. How significant is the impact and reach of disin-
                                         social media has been instrumental in shaping conversations             formation and conspiracy groups in terms of account
                                         around social and political issues (Loader and Mercea 2011),            engagements (characterized by activity level, political
                                         its positive effects have been undermined by disinformation             leaning, tweet types, and propagation dynamics)? We
                                         and manipulation. The promotion of disinformation, propa-               characterize account engagements with the QAnon con-
                                         ganda, and politically divisive narratives have been regu-              spiracy group, and we compare propagation dynamics of
                                         larly seen in many social contexts (Sharma, Ferrara, and Liu            unreliable/conspiracy and reliable engagement cascades.
                                         2020; Bessi and Ferrara 2016; Martin and Shapiro 2019).
                                                                                                               • R3. Did Twitter’s restrictions on QAnon influence its
                                         Copyright © 2021, Association for the Advancement of Artificial         activities and were they effective in limiting the con-
                                         Intelligence (www.aaai.org). All rights reserved.                       spiracy? We investigate activity before/after the restric-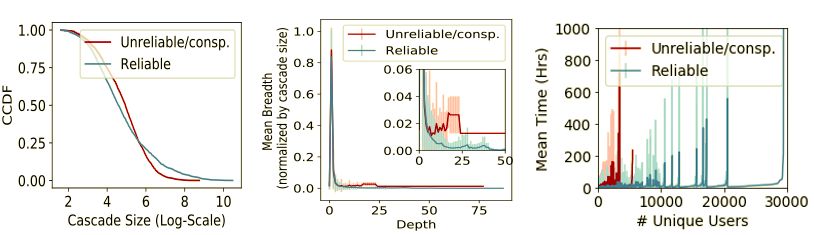
tion and factors driving the sustained activity of QAnon                               Related Work
  accounts, and we test if QAnon accounts adapted to Twit-         Social media manipulation has been observed in political
  ter’s restrictions using a regression discontinuity design.      discourse in several countries (Woolley and Howard 2017).
  Contributions and findings. The findings of the research         However, changing strategies of social media manipulation
questions studied in this paper are as follows,                    continue to challenge our understanding and findings on ma-
                                                                   licious activities on the network (Cresci 2020). Twitter re-
• We apply CSI (Ruchansky, Seo, and Liu 2017) to detect            ported seeing some of the operations as being less clandes-
  unreliable/conspiracy tweets in the election dataset, with       tine and more overt efforts to promote disinformation than
  validation AUC 0.8 and F1 0.76. The most prominent top-          they have in recent years (Miles P. 2020 (accessed June 18,
  ics targeted by disinformation promoters preceding the           2020). Therefore, identification and analysis of disinforma-
  election included mail-in voter fraud, COVID-19, Black           tion and its landscape preceding the U.S. 2020 election is
  Lives Matter, media censorship, and false claims and con-        vital, along with characterization of account engagements
  spiracies about past and current political candidates.           with disinformation, to estimate its risks, and investigate the
                                                                   effectiveness of interventions and actions to limit it.
• While disinformation tweets are widespread and diverse,             With regards to U.S. elections, recent papers attempt
  engagements with such tweets are less viral than with re-        to uncover different aspects of social media manipulation.
  liable tweets (i.e., mean time to reach unique accounts is       (Bessi and Ferrara 2016) discovered tens of thousands of
  higher, mean cascade breath is smaller). Yet, there can be       bot accounts distorting the 2016 election-related Twitter dis-
  several such tweets which manage to receive substantial          course, in what turned out to be an effort associated with
  attention and engagements.                                       the Russian Internet Research Agency (Badawy et al. 2019).
• QAnon far-right conspiracies are quite prevelant on Twit-        (Luceri, Cardoso, and Giordano 2020) conducted a year long
  ter, and we find that while 85.43% of all accounts (10.4M)       analysis of bot activity on Twitter before the 2018 midterm
  in the collected data, did not have an observed engage-          election. Based on detection of bot-like behaviours in ac-
  ment with QAnon accounts in the dataset, fraction of such        counts, they found that 33% of bots were active even one
  accounts is much smaller (34.42%) in the active 1.2 mil-         year prior to the midterm, and new bots were introduced
  lion accounts (that appear in at least 20 tweets in data).       into the discussion progressively up to the midterm. Nine-
                                                                   teen thousand highly-active bots generated a large volume
• Investigation of QAnon activities suggests that their            of 30M political messages, and humans were susceptible to
  strategies include entering into active discussions with         retweeting bots with one-third of their retweets being con-
  left-leaning accounts through replies, in an effort to “red      tent pushed by bots. (Ferrara et al. 2020) observed high vol-
  pill” (i.e., dramatically transform ones perspective with        ume of tweets from bot-like accounts prior to the Novem-
  typically disturbing revelations). Also, the conspiracy          ber election, and found highly partisan retweeting behav-
  group quickly adapted to Twitter’s ban on its activities         ior among bots and humans. (Ferrara et al. 2020) also an-
  imposed in July, 2020. Using a regression discontinuity          alyzed distortion with three types of conspiracy hashtags,
  design to estimate causal effects of Twitter’s interven-         i.e. QAnon, -gate conspiracies such as pizzagate and obam-
  tion, we find statistically significant changes in hashtags      agate, and COVID-19 conspiracies, and found 13% of all ac-
  adopted by QAnon. Also, the volume of engagements af-            counts sharing the conspiracy hashtags were suspected bots.
  ter the Twitter ban is still largely sustained by existing ac-   They also found that accounts sharing content from right-
  counts created before the ban, rather than new accounts.         leaning media were almost 12 times more likely to share
                                                                   conspiratorial narratives than left-leaning media accounts.
   Research implications. Our findings indicate that there            Tracking the growth of the QAnon conspiracy from fringe
are high interactions among more active accounts and disin-        online subcultures to mainstream media over one year,
formation or conspiracy groups, and engagements through            (de Zeeuw et al. 2020) found that after the incubation pe-
reply tweets are prevalent with both left/right leaning ac-        riod on 4chan/pol in Oct 2017, the movement had quickly
counts. An important implication from the study is also that       migrated to larger platforms, notably YouTube and Reddit,
the actions enforced to limit malicious groups might not be        and was covered by news media only when it moved off-line.
robust to evasive actions from malicious actors. Therefore,        In terms of cross-platforms effects, (Papasavva et al. 2020)
rethinking effective platform interventions is needed.             found spike in new account registrations on Voat after Red-
   This work is different from most previous studies, espe-        dit ban on QAnon threads in Sept 2018. They also studied
cially in investigating effectiveness of social media platform     content of QAnon posts finding discussions related to pre-
actions to limit disinformation or conspiracies. QAnon is a        decessor Pizzagate conspiracy, and “Q drops”, which refer
notable conspiracy, and most studies have traced its normi-        to the cryptic posts meant for adherents of the conspiracy to
fication, its conspiracies and posts. Our work instead is the      decode, and found more submissions but less comments in
first to focus on characterization of interactions with QAnon      QAnon threads compared to general threads.
accounts, and their activities and evasion of Twitter’s restric-      Addressing growing concerns around conspiracy commu-
tions. We also provide a large data-driven analysis of dis-        nities, (Phadke, Samory, and Mitra 2021) investigated what
information preceding the 2020 U.S. Election, focused on           individual and social factors promote users to join conspir-
observed engagements for quantifying the impact of disin-          acy communities. Their findings on Reddit suggest that di-
formation/conspiracies to better understand its risks.             rect interactions (i.e., replies) with conspiracists is the most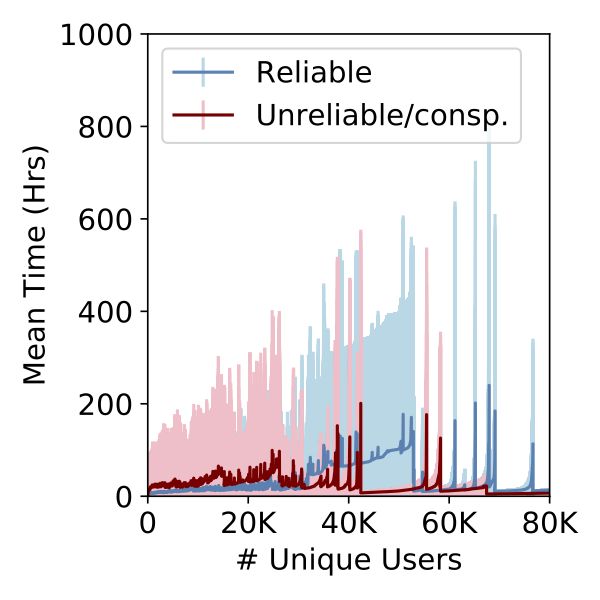
Table 1: Detection dataset statistics                 unverifiable theories, and may be politically motivated (Fer-
                                                                     rara et al. 2020; Phadke, Samory, and Mitra 2021). To cap-
   Statistic                                            Count        ture distortion aimed at manipulation of public opinion, we
   Tweets                                        242,087,331         focus on any kind of unreliable (likely false or misleading)
   Users accounts                                 10,392,492         narratives, including conspiracies promoted prior to the elec-
   Unreliable/conspiracy URLs cascades                 3,162         tion. The term disinformation is used here as an umbrella
   Reliable URLs cascades                              4,320         term to refer to distorted narratives appearing in the form
   Unlabeled cascades                                192,103         of unreliable, including conspiratorial claims. In literature,
   Avg. cascade size (# engagements)                   57.11         the term disinformation separates itself from misinformation
   Avg. cascade time (in hrs)                          80.42         based on intent to manipulate vs. lack thereof (Sharma et al.
   Avg. time between engagements (hrs)                  5.93         2019). However, since we do not assess intent from tweets,
                                                                     we do not make a distinction between the two terms.

                                                                     Model Specifications
important social precursor for joining (i.e., first contribu-
tion to) a conspiracy community. (Silva et al. 2020), on the         Detection model. We apply CSI, a supervised deep learn-
other hand, investigated which factors are most predictive           ing based model in (Ruchansky, Seo, and Liu 2017) for dis-
of engagements with factual and misleading tweets, finding           information detection. The model captures three main sig-
follower-friend ratio, banner image or URL in user profile,          nals or features: source, text, temporal, which are useful for
presence of image in the tweet, as most relevant, and fac-           disinformation detection (Ruchansky, Seo, and Liu 2017;
tual tweets were more engaging in COVID-19 tweets. Dif-              Sharma et al. 2019). To classify a tweet, the model con-
ferently from the papers, we focus on characterization of in-        siders time-ordered sequence of engagements that the tweet
teractions with QAnon accounts, based on political leaning           receives, along with temporal information such as the fre-
and tweet types, and on their activities and strategies to en-       quency and time intervals between engagements. In addi-
gage with other accounts and escape Twitter’s restrictions.          tion, it learns the source characteristic, based on account be-
                                                                     haviours i.e., which accounts co-engage with a given tweet.
                                                                     These input signals are useful for differentiating disinfor-
                        Data Collection                              mation tweets. In general, engagements or social context are
For the analysis, we start from the dataset collected in (Chen,      useful to learn predictive features, as they provide feedback
Deb, and Ferrara 2020) which tracks election related tweets          from other accounts through engagement dynamics (Sharma
from May, 2019 onwards, and contains over approximately              et al. 2019). The model needs to be provided training data
one billion tweets.1 The dataset was collected by tracking           containing labeled cascades (i.e., tweets with its engage-
mentions of official and personal accounts of Republican             ments), We describe the process for labeling data and ex-
and Democratic candidates in the presidential election us-           tracting features (cascades) for training the detection model
ing Twitter’s streaming API service, which returns matches           in the following paragraphs.
in tweet content and metadata within a ∼1% sample of the
stream of all tweets. The details of the tracked mentions and
                                                                     Reliable, unreliable and conspiracy URLs. We collect
distribution of frequent hashtags and bigrams in the data are
                                                                     lists of unreliable and conspiracy news sources from three
available in (Chen, Deb, and Ferrara 2020).
                                                                     fact-checking resources on low-credibility news sources:
   For this analysis, we focus on the tweets that appeared
                                                                     Media Bias/Fact2 , NewsGuard3 , and Zimdars (2016). News-
between June 20, 2020 and September 6, 2020, in or-
                                                                     Guard maintains a repository of news publishing sources
der to study the disinformation surfaced on Twitter in the
                                                                     that have actively published false information about the re-
months preceding the election. This subset of the data con-
                                                                     cent COVID-19 pandemic. The listed sources from News-
tains 242, 087, 331 election-related tweets from 10, 392, 492
                                                                     Guard, accessed on September 22, 2020 are included, along
unique users. We focus on engagements, therefore, it is use-
                                                                     with low and very low factual sources listed as question-
ful to define four tweet types considered here: (i) Original
                                                                     able from Media Bias/Fact Check, and sources tagged with
tweets (accounts can create content and post on Twitter) (ii)
                                                                     unreliable or related labels from Zimdar’s list. We sepa-
reply tweets (iii) retweeted tweets, which reshare without
                                                                     rately collect mainstream reliable news sources referencing
comment (iv) quote tweets (embed a tweet i.e., reshare with
                                                                     Wikipedia4 . In total, we obtained 124 mainstream reliable
comment). Engagements are defined here as one of the tweet
                                                                     and 1380 unreliable (or conspiracy) news sources. Original
types other than original tweets (and engagements can be
                                                                     tweets sharing URLs published from these news sources are
with original tweets or other tweet types also).
                                                                     thereby labeled as reliable and unreliable/conspiracy respec-
                                                                     tively. In addition, we also label tweets that are retweets,
       Disinformation Detection Methodology                          replies, or quotes sharing such URLs, if the parent of the
In this section, we present the methodology to separate fac-         tweet is not in the collected tweets (1% Twitter sample).
tual from unreliable (or conspiratorial) claims in election-
                                                                        2
related tweets. Conspiracies theories are attempts to explain             https://mediabiasfactcheck.com/
                                                                        3
events or situations, often postulated on most likely false and           https://www.newsguardtech.com/covid-19-resources/
                                                                        4
                                                                          https://en.wikipedia.org/wiki/Wikipedia:Reliable sources/
   1
       Dataset: https://github.com/echen102/us-pres-elections-2020   Perennial sources
Table 2: Results on detection of unreliable/conspiracy cascades in the election dataset
Method AUC AP F1 Prec Rec Macro-F1
SVM 0.6236 ± 0.01 0.5025 ± 0.01 0.5710 ± 0.01 0.5594 ± 0.01 0.5835 ± 0.02 0.6226 ± 0.01
GRU 0.5244 ± 0.05 0.4499 ± 0.04 0.4606 ± 0.11 0.4367 ± 0.05 0.5110 ± 0.17 0.5073 ± 0.05
CI 0.6326 ± 0.02 0.5364 ± 0.01 0.5732 ± 0.02 0.5307 ± 0.02 0.6243 ± 0.03 0.6046 ± 0.02
CI-t 0.6554 ± 0.02 0.5661 ± 0.01 0.5820 ± 0.03 0.5354 ± 0.01 0.6426 ± 0.08 0.6099 ± 0.01
CSI 0.8054 ± 0.02 0.6826 ± 0.02 0.7597 ± 0.02 0.6611 ± 0.02 0.8944 ± 0.04 0.7608 ± 0.02
Information cascades and cascade statistics. To train the extracted with doc2vec. (ii) GRU (Ma et al. 2016) which uti-
detection model, we first extract cascades of engagements lizes a recurrent neural network (RNN) to classify the cas-
from the dataset. Information cascades represent the diffu- cade based on text features of the time-ordered sequence of
sion or spread of information on the network. Each cas- engagements in the cascade. (iii) CI, which can be consid-
cade corresponds to a time-ordered sequence of engage- ered as a variant of the CSI model, utilizes only tweet text
ments (retweets, quotes and replies), that originate at a and account metadata features of the engagements as input
source tweet and spread through chains of retweets, quotes to a RNN for classification. (iv) CI-t, another variant of the
and replies. Formally, a cascade can be denoted as Cj = CSI model, utilizes tweet features of engagements, and in
[(u1 , tw1 , t1 ), (u2 , tw2 , t2 ), · · · (un , twn , tn )], where the tu- addition temporal information of time intervals between en-
ple corresponds to an original tweet, or an engagement with gagements as input to a RNN. (v) CSI model, which includes
the original tweet or its predecessor engagements, and repre- all three features (tweet features of engagements, temporal
sents the user (u), tweet (tw), and temporal (t) dimensions of information, and account behaviours).
when the user posted the tweet or engagement. The cascade The CSI model has AUC 0.8 and high recall and is there-
is labeled by the URLs linked in its first tweet as described fore used for inference on unlabeled cascades. The ensem-
earlier, if the tweet shares a URL from one of the considered ble of CSI models trained over five folds are used for infer-
factual or unreliable news sources, it is labeled accordingly, ence. We take the top 80th and bottom 80% percentile, of
otherwise left unlabeled. cascades predicted with the largest margins above and be-
Since the dataset contains over 10M accounts and 242M low the detection threshold, resulting in 72,228 unreliable
tweets, for computational efficiency, we subsample accounts and 81,453 reliable classified cascades respectively. The en-
and cascades, whilst ensuring minimal information loss, gagements or tweets forming the reliable cascades consti-
such that at least 75%(∼180M) of the tweets are accounted tute about two third of the total tweets in all cascades. For
for in the data. We find that this can be achieved by sub- human validation, we take a random sample of 50 cascades
sampling cascades with a minimum number of engage- from ones labeled by the model (Note: the list of validated
ments, and accounts with highest active and passive engage- tweets is provided in supplementary materials). In 2/50 (4%)
ments with other accounts in the dataset5 . For accounting the model label differed from the label assigned by inspect-
for >75% of the tweets, we find cascade size of 5, and ing the tweet and its account for suspensions. The model er-
7471 highest engaging accounts was sufficient. This results rors included a tweet critical of the postal system and though
in ∼200K cascades (192K unlabeled, and rest labeled with non conspiratorial, could have been mistaken for claims re-
3120 unreliable and 4320 reliable cascades). The full cas- lated to mail-in voter fraud by the model, and another which
cades comprise engagements from accounts outside of the strongly supported criticism of China by president Trump,
subsampled accounts, and span the large fraction of dataset although not from a suspended account and unlikely part of
tweets. Full cascades are used in the analysis of identified QAnon/conspiracy groups, was predicted unreliable. To reit-
disinformation cascades, but for training and inference with erate, these validated cascades were uniformly sampled from
CSI, the subsampled accounts in these cascades are utilized. cascades that were assigned labels using CSI, considering
Table 1 provides statistics of data and training cascades. predictions with largest margins from the detection thresh-
old, as discussed earlier using the ensemble of 5-fold classi-
Model Evaluation fiers, and the expected lower error rate, confirmed by valida-
Table 2 reports 5-fold cross validation results obtained using tion suggests it can be reliably utilized for further analysis.
CSI on the labeled cascades. The metrics reported are the
ROC AUC average precision AP score. We also reported the Methodology for Inferring Political Leaning
F1, Precision, Recall and macro-F1 at the detection thresh- In this section, we describe the methodology we use to infer
old selected from the ROC curve, that achieves maximum political leaning of accounts on the network. The inferred
geometric mean of validation set sensitivity and specificity. political leanings are used later in the analysis and charac-
For comparison, we evaluate it against several baselines: terization of the disinformation landscape. Similar to prior
(i) SVM- RBF on text features of the cascade source tweet, work (Ferrara et al. 2020), we use the list of 29 prominent
news outlets classified as left, lean left, center, lean right,
5
Active refers to tweets (original, retweet, reply, quote) from the right as per ratings provided by allsides.com.6 We consider
account, whereas passive means the account has been involved in
6
another account’s tweets (retweeted, replied, quoted, or mentioned) https://www.allsides.com/media-biasleft and lean left classified outlets as the left-leaning, and Table 3: Number of accounts labeled as left or right-leaning
right and lean right as right-leaning. (by media URLs, account profile description, and human
verification) for validation, with error rate (%) in each type
Model specifications based on the inferred political leaning of those accounts.
For accounts that tweeted or retweeted URLs published MediaURLs Profile Desc. Human Verif.
from these news outlets, we characterize their political lean-
LP-Left 68k (0.71) 29.5k (0.32) 116 (1.72)
ing by measuring the average bias of the media outlets they
LP-Right 46k (0.27) 14.0k (0.34) 103 (2.91)
endorsed. This gives us a set of labeled accounts with known
political leaning labels based on the media URLs. To infer Lo-Left 68k (0.67) 29.5k (0.25) 116 (1.72)
labels of other accounts, we can propagate labels from this Lo-Right 46k (0.37) 14.0k (0.58) 103 (2.91)
known set (also called the seed set i.e., accounts with known
political leaning labels based on the media URLs) to other
accounts based on interactions between accounts. hashtags were classified as left/right through human valida-
We utilize the retweet network to infer political lean- tion of most frequently used 3,000 hashtags. The list is pro-
ing of other accounts starting from the seed set accounts. vided in supplementary material). (iii) Manual verification
Retweeting is a form of endorsement, different from other based on inspection of tweets of randomly sampled subset
tweet types, and accounts which retweet each other tend to of accounts (i.e., based on explicitly stated party affiliation
share the same political biases (Badawy et al. 2019). To that in tweet or account profile, or expressed support of left/right
end, we use Louvain method (Blondel et al. 2008) to iden- presidential candidate/party, and assigned ‘center’ instead of
tify communities in the retweet graph, where edge weights left/right if non-partisan). We sampled 100 inferred accounts
represent the number of retweets between accounts. The uniformly at random, and 124 inferred accounts by strati-
method optimizes modularity which provides a measure of fied sampling based on degree distribution of accounts in
edge density within communities compared to across com- the retweet graph, to ensure coverage of dense and sparsely
munities. We assign political leaning to each identified com- connected accounts in the retweet graph, since the retweet
munity, using the average political leaning of media URLs graph was used infer the leanings.
endorsed by accounts in the seed set that belong to the com- In Table 3, we report the error rate on each evaluation
munity. The seed set accounts with high entropy in distri- measure separately for the left-leaning and right-leaning ac-
bution of left-leaning and right-leaning URLs (close to uni- counts. Here, we added an alternative baseline based on La-
form distribution with margin of 0.2), and ones that shared bel propagation (Badawy et al. 2019) for comparison. The
less than 10 URLs from the media outlets are filtered out. total error rate was 4.46% on manually verified labels for
both methods (label propagation (LP) and Louvain (Lo) used
Inference of political leanings here, on RT graph from same media URL labeled seed set)
Using media outlets, we obtain a seed set of 114K accounts and results were robust on both. Error analysis on the man-
from 10.4M accounts in the dataset. To limit the size of ually labeled set, suggests that errors included few accounts
the retweet network, we consider the top active 1.2M ac- that are actually neither left/right leaning (but center), e.g.,
counts that appeared (in original tweet, retweet, quote, or U.S. Department of State, reporter accounts, or unrelated
reply tweet) at least 20 times in the collected dataset. or disinterested in U.S. politics, and were erroneously clas-
sified as left/right leaning. Other mistakes included anti-
Using the seed set and retweet graph of 1.2M accounts,
Trump conservatives that were inferred as left-leaning, or
gives a resulting inferred network with large left-leaning
with high entropy in left/right leaning views in their tweets.
communities of 540,719 and 68,197 accounts and two
smaller left-leaning ones, and large right-leaning commu-
nities of 480,982 and 10,723 accounts, and multiple smaller Results and Analysis
ones. Of the 1.2M accounts, we were able to infer the politi- In the following subsections, we analyze identified unreli-
cal leaning of 92% of the accounts. The rest of the accounts able/conspiracy cascades, and characterize account engage-
remain undetermined due to high entropy in left and right- ments. We characterize disinformation topics, QAnon con-
leaning URLs shared, or with communities that had fewer spiracy group and its interactions with left and right demo-
than two seed accounts. We thereby identified 610,430 left- graphics, their activities, effect of Twitter’s restrictions, and
leaning and 500,804 right-leaning in the 1.2M accounts. propagation dynamics of engagements with disinformation.
Verification. We measure the accuracy of inferred lean-
ings based on three types of evaluations (i) Media URL la- Disinformation topic modeling
bels i.e., based on the averaged political leaning of left/right Topic modeling We use topic modeling to identify promi-
leaning media outlets endorsed in tweets from the account nent topics that were targets of disinformation prior to the
(However since media URL labels are also used as seed set election. With identified unreliable/conspiracy cascades, we
labels during inference, therefore for evaluation we report can model the topics in tweet text associated with the source
averaged 5-fold results wherein 20% of the seed labels are (first) tweet in the cascade. The text is pre-processed by tok-
held-out and kept unseen during inference). (ii) Profile de- enization, punctuation removal, stop-word removal, and re-
scriptions, i.e., based on whether the account profile descrip- moval of URLs, hashtags, mentions, and special characters,
tion dominantly included left or right leaning hashtags (the and represented using pre-trained fastText word embeddingsmail, ballots, voting, fraud, voter,
jobs, tax, economy, us, china, vote, ballot, election, absentee,
american, people, federal, law, democrats, person, dems, votes democrats, party, democrat,
mining, taxes, order, need, democratic, vote, republican,
would, state republicans, election, socialist,
communist, country, radical,
political, liberal, left
god, bless, loveoneanother,
bebest, good, patriots, morning, obama, barack, clinton,
lord, pray, please, thank, Q Watch Missile Attack on 4th Sec hillary, obamagate,
participate, retweet, thanks, @realDonaldTrump Was Right administration,
campaign, spying,
q, maga, trust, tammy, biden, plan, hussein, years, corrupt
bbb, rd, love, must, great, bqqm
venezuela, por, de,
para, urgente,
news, watch, twitter, media, police, blm, law, antifa, militar, los, en,
video, fake, conference, fox, violence, federal, riots, necesita, libertad,
covid, virus, vaccine, cnn, people, live, breaking, people, cities, democrats, intervencion,
coronavirus, als, people, socialistas
press, see, tweets terrorists, violent, crime,
hydroxychloroquine, deaths, terrorist, stop
fda, treatment, hcq, china,
patients, fauci
Figure 1: Topic clusters for identified unreliable/ conspiracy tweets with example top representative tweet of cluster
(Bojanowski et al. 2017)7 . We take the average of word em- far-right conspiracy group now banned by several platforms
beddings in the tweet text to represent each tweet. Using (de Zeeuw et al. 2020). Another cluster related to Venezuela
pre-trained embeddings trained on large English corpora, we appears in support of right-leaning theories potentially about
can potentially encode more semantic information and it is voter fraud, and anti-democratic posts, however, our model-
useful for short texts where word co-occurrence statistics are ing is limited to English, the most prominent language in
limited for utilizing traditional probabilistic topic models (Li the tweets (∼94% disinformation tweets were in English,
et al. 2016). The tweet text representations are clustered us- followed by ∼3% in Spanish, remaining languages less than
ing k-means to identify topics clusters. 0.1% each). In Table 4, we list examples of identified un-
We select number of clusters (K) using silhouette and reliable/conspiracy tweets within tweets with the most en-
Davies-Bouldin measures of cluster separability. K that gagements in the collected dataset, discarding false posi-
jointly is in the best scores of both is selected between 3- tives. Some of these have been debunked by fact-checking
35. This gave us K=30, and inspecting word distribution and sites as false, misleading or lacking evidence89 .
representative tweets (closest to cluster center), we discard
two clusters unrelated to US politics (ALS treatment and Quantifying interactions with QAnon group
Nigeria violence), and eight small or less distinguished clus-
ters, and merge over-partitioned clusters each related to the QAnon, a far-right conspiracy group emerged in 2017 on
Black Lives protests, and to mail-in voter fraud. 4chan, and has risen to prominence for its baseless conspir-
acies that have received significant following and attention
(de Zeeuw et al. 2020). The group advances the conspiracy
Topic clusters The resultant clusters are in Fig 1. For each theory that president Trump is battling a satanic child sex-
cluster, top words ordered by highest tf-idf scores, along trafficking ring, and an anonymous ‘Q’ claims to be a US
with an example tweet from 100 most representative tweets government official with top-clearance, providing insider in-
of the cluster are shown. The major themes relate to false formation about deep state operations (Ferrara et al. 2020).
claims about mail-in voter fraud, COVID-19 and pushing In this subsection, we analyze activities of QAnon accounts
hydroxychloroquine as a cure, and protests concerning law and characterize its interactions with other accounts.
enforcement and Black Lives Matter. Other topics target spe- Identification and verification. We identify accounts
cific candidates and entities, such as social media platforms that actively form part of the conspiracy group by posting
for censorship of unverified and conspiratorial content, con- original content related to QAnon conspiracies, referred to
spiracies and allegations against former president Obama, as QAnon accounts thereafter. We extract tweets (original,
or targeting the democratic party as a whole on different so-
cial issues, and misleading claims about jobs and economy. 8
https://www.politifact.com/factchecks/2020/jul/28/viral-
The remaining clusters include the QAnon conspiracies, a image/opening-case-file-does-not-mean-joe-biden-criminal/
9
https://apnews.com/article/shootings-wisconsin-race-and-
7
Pre-trained: https://fasttext.cc/docs/en/english-vectors.html ethnicity-politics-lifestyle-23668668b3b59fa609a18d023c0bb485Table 4: Examples of unreliable/conspiracy tweets within Table 5: QAnon conspiracy keywords along with their oc-
tweets with most engagements in the data currence frequency in tweets (original, reply or quoted
tweets i.e., excluding retweets) containing the keywords
Unreliable/conspiracy tweet # Eng.
BREAKING: Democratic Presidential nominee @JoeBiden is for- 56K Keyword Freq. Keyword Freq.
mally being listed as a criminal suspect by high level Ukraine wwg1wga 159436 wgaworldwide 18231
government officials, in a major case involving his son - Hunter. #qanon 68039 #qarmy 13577
https://t.co/Xe2bSLEAh8
#obamagate 78574 #pizzagate 13053
We are being censored! @realDonaldTrump @Facebook is about to un- 48.6K #savethechildren 33221 #taketheoath 10994
published our FB page with 6 million followers. The NY Times recent thegreatawakening 23305 greatawakening 31615
article claiming we are right wing Provacateurs They are interfering deepstate 25268 deepstatecoup 995
with this election! Conservatives are being censored on FB. PLEASE deepstatecabal 1669 deepstateexposed 2188
RETWEET!! https://t.co/xVy8xZ7kyC #pedogate 5211 pedowood 4454
I am tired of the censorship! Anderson Cooper called me a snake oil 48K #plandemic 8456 #scamdemic 4674
salesman because I’m trying to get the FDA to test a supplement that #sheepnomore 1492 adrenochrome 6397
I’ve seen work! And Twitter keeps taking my followers! Please RT and thestorm 3989 followthewhiterabbit 95
follow me as I support President @realDonaldTrump! thesepeoplearesick 2843 wearethenewsnow 5540
trusttheplan 2579 pizzagateisreal 698
Can you believe what’s happening!? They give Joe Hiden’ the ques- 47K thestormisuponus 887 newworldorder 901
tions, and he reads them an answer! https://t.co/ivMw6uQ2gp darktolight 6825 clintonbodycount 1898
HEARTBREAKING A 60 year old Black Trump Supporter was mur- 46.9K
dered in cold blood all because he support President @realDon-
aldTrump This is a Hate Crime He deserves Justice Let’s make his name Table 6: Verification of 100 accounts sampled from inferred
trend Use #JusticeForBernellTrammell https://t.co/XZbdOiHgRR right/left-leaning accounts posting QAnon associated key-
NATURE ARTICLE HOAX BUSTED!! Proof that chloroquine let’s 40.6K words. Verified as: (Q) is QAnon conspirator; else not (N)
covid attack cancer cells but not normal cells. PLEASE RETWEET.
@realDonaldTrump @IngrahamAngle @SteveFDA @drsimonegold
@jennybethm https://t.co/XN0YC1liSQ Inferred Leaning Human verification # Accounts
If we can stand in line at a grocery store or hardware store, we can stand 32.5K Right-leaning (74k) Q 100
in line at the polls to vote. President @realDonaldTrump is RIGHT Left-leaning (7.6k) N (Reference QAnon) 79
that universal, unmonitored vote-by-mail would be a DISASTER, and
we’re already seeing evidence of that across the country. @TeamTrump N (Re-purposed hashtag) 2
https://t.co/ai1uNjQi7k Q (Incorrect leaning) 19
Undetermined (10k) Q 89
N 11
quote, or reply tweets) excluding retweets containing any
keywords or hashtags frequently associated with the QAnon
words are not considered in the recall measure).
group. Table 5 lists the QAnon associated keywords with
their frequencies. This gives 92,065 accounts with posts con-
taining QAnon associated keywords. 7,661 of these were in- QAnon interaction graph. To quantify interactions be-
ferred left-leaning accounts, for 10,085 the political lean- tween accounts, we consider that two accounts have inter-
ing was undetermined (not inferred), and the rest were in- acted if there exists a retweet (i.e., retweet without com-
ferred as right-leaning. For accounts posting QAnon key- ment), quoted tweet (i.e., retweet with comment), or reply
words, grouped by the inferred political leaning, we sampled tweet edge between the accounts, in the collected dataset.
100 accounts uniformly at random from each group (left, Further, to account for directionality of the interactions,
right, undetermined), and inspected their tweets to identify we partition the accounts that have interacted with QAnon
whether the accounts are promoters of QAnon conspiracies. accounts into “ID” (influenced) and “IR” (influencer). In-
The validation and error analysis of the sampled accounts is fluenced accounts are those that have been influenced by
provided in Table 6. Among the 100 inferred left accounts, (retweeted, quoted, or replied to) QAnon accounts tweets,
19% were mistakenly inferred as left-leaning (and were pro- whereas influencer are accounts that QAnon accounts have
moters of the conspiracy), 79% were not part of the con- retweeted, quoted or replied to. Table 7 reports what per-
spiracy group and only referencing the QAnon movement centage of all accounts were influenced but did not influence
(oppose, ridicule, discuss or tag in their tweets containing QAnon (ID-only), influencer but not influenced (IR-only),
QAnon keywords), and 2% were using the “pedogate” hash- and both influencer and influenced in the data (IR&ID).
tag in a different context as compared to how the hashtag We find that 85.43% of 10.4M accounts had no observed
was used by QAnon conspirators. Among the inferred right- interaction with QAnon accounts in the collected tweets.
leaning accounts, all were verified to be QAnon accounts. However, considering accounts that appeared in at least 20
Based on this observation, we retained the inferred right- tweets (original, reply, retweet, quote) in the dataset, we find
leaning accounts posting QAnon associated keywords as the only 34.42% of the active 1.2M accounts had no interaction
identified QAnon accounts (since they indicate with high with QAnon accounts in the collected tweets. Also, we con-
precision support of the far-right QAnon conspiracy theo- sider a random sample of accounts from the active 1.2M ac-
ries). This two-stage filtering for QAnon accounts identifica- counts of the same sample size as % of QAnon accounts in
tion, results in 100% precision and 88% recall based on the that set (drawn five times, and statistics averaged) for com-
verified examples weighted by actual number of accounts parison. IR&ID and IR-only are similar. The main difference
in each type (words not included as QAnon associated key- is in the ID-only and Neither cases, wherein % of influenced217 Figure 3: Distribution of account interactions with QAnon
84 171 accounts by tweet type and inferred political leaning.
QAnon 27 IR&ID
5.2% 24.9% (a) % of accounts that interacted with QAnon accounts with mentioned
56 60 tweet types inferred as left or right leaning with active 1.2M accounts.
58
92 32
Tweet Type Left- Right- Undetermined
4 IR-only Leaning Leaning
11
4.5%
34 Reply To (RP-TO) 42.54 50.16 7.30
4 Replied By (RP-BY) 49.97 45.58 4.45
42
48 Retweet (RT) 8.95 90.06 0.99
2
3
Quoted (QTD) 25.03 73.44 1.53
ID-only Neither
30.98% 2 34.42%
2
2
1 (b) Fraction of inferred left/right-leaning accounts in active 1.2M that
interacted with QAnon accounts with mentioned tweet types.
Figure 2: QAnon accounts interaction graph in active 1.2M 1.00 1.00
accounts. Edges are retweets/quotes/replies from source to 0.75 0.75
destination node, normalized by # accounts in source.
0.50 0.50
Table 7: QAnon interactions quantified over all accounts 0.25 0.25
in the dataset. Influenced (ID) are accounts that replied, 0.00 0.00
RP QTD RT Not RP QTD RT Not
retweeted or quoted tweets from QAnon accounts. Influ- (RT/QTD) (RT/QTD)
encer (IR) are accounts that were replied, retweeted or Left-Leaning Right-Leaning
quoted by QAnon accounts. Table contains: # Accounts (%).
10.3 M (All users) 1.2M (Activity > 20)
the replies to QAnon tweets are from left-leaning accounts).
Group QAnon 74.3k (0.72) QAnon 62.8k (5.2) Sample This suggests that QAnon get engaged in active discus-
IR&ID 376k (3.62) 300.7k (24.9) (22.60) sions with left-leaning accounts. This might also be indica-
IR-only 150.6k (1.45) 54.3k (4.5) (3.00) tive of engagement strategies by QAnon to influence liberals
ID-only 912.5k (8.78) 374k (30.98) (47.01) by “red pilling”, i.e., have their perspective transformed, il-
Neither 8.9M (85.43) 415.7k (34.42) (22.19) lustrated in a QAnon account tweet which states:
“We interact with liberals the most under realDon-
only accounts by QAnon was less than the random samples aldTrump’s most recent posts. Q gave us a challenge
(30.98 vs. 47.01), % of accounts not interacting with QAnon so I have been sharing the truths about COVID &
is higher than with random samples (34.42 vs. 22.19). nursing home deaths in hopes of redpilling any-
The interaction graph of the 1.2M active accounts (ac- one who sees. Next Trump tweet wanna help out?
tivity > 20 in the dataset) is visualized in Fig. 2. Thus, https://breitbart.com/politics/2020/06/22/exclusive-
5.2% of these accounts are QAnon accounts, as described seema-verma-cuomo-other-democrat-governors-
earlier. And 24.9% (IR&ID) are closely coupled accounts coronavirus-nursing-home-policies-contradicted-
that both influenced QAnon content and were influenced by federal-guidance/.”
it (retweeted, quoted, replied). A larger 30.98% were only
influenced (ID-only), while a small fraction of 4.5% were Fig. 3b shows distribution of inferred left/right-leaning
retweeted, quoted, or replied by QAnon, but did not engage accounts that interacted with QAnon, by tweet types.
back (IR-only). The edge weights in the interaction graph 82.17% of left-leaning in 1.2M have not retweeted/quoted
correspond to the volume of retweets, replies, or quoted QAnon accounts, but only 28.35% of right-leaning have not
tweets of the destination node by the source node, per ac- endorsed content from QAnon accounts.
count in the source node.
QAnon engagement characteristics. Next, we characterize Estimating change in QAnon activities after
interactions with QAnon accounts by inferred political lean- Twitter Action
ing and tweet types, in the active 1.2M accounts in Fig. 3a.
As one would expect, the retweeted and quoted tweet in- Twitter announced sweeping actions against the QAnon con-
teractions are mostly between right-leaning and QAnon ac- spiracy group on July 21, 2020, designating them as harm-
counts (90.06% and 73.44%), as these are more close to en- ful coordinated activity. Twitter took down more than 7,000
dorsements. Replies on the other hand are roughly equally QAnon accounts violating platform manipulation policies
distributed amongst left and right-leaning accounts (49.97% with spam, ban evasion, and operation of multiple accounts.
of replies by QAnon are towards left-leaning and 42.54% of Twitter also banned QAnon-related terms and urls from ap-Twitter Action DNC RNC Twitter Action DNC RNC
Tweet Vol (QAnon keywords) 500K
Tweet Vol (QAnon accounts)
(created after Twitter Action)
(newly created on each day)
Frac of QAnon Tweet Volume
0.003
Frac of QAnon accounts
30K
from new accounts
400K 0.02
0.002
20K
300K 0.001 0.01
10K
200K 0.0 0.0
2 7 2 7 2 7 2 7 1 6 1 6 1 6 1 5 2 2 2 2 1 1 1 1
06-2 06-2 07-0 07-0 07-1 07-1 07-2 07-2 08-0 08-0 08-1 08-1 08-2 08-2 08-3 09-0 06-2 07-0 07-1 07-2 08-0 08-1 08-2 08-3
Timeline Timeline
(a) QAnon tweets activity timeline. (Red) Total daily volume of tweets (b) QAnon accounts creation timeline. (Red) Fraction of newly cre-
from the QAnon accounts in the data collection period. (Blue) Daily ated QAnon accounts per day in the data collection period. (Bot-
volume of QAnon account tweets containing the listed QAnon key- tom) Fraction of total tweet volume from QAnon accounts that is
words. attributed to new accounts created after Twitter Action.
Figure 4: QAnon activity and account creation timeline with respect to Twitter Action banning QAnon, DNC and RNC.
pearing in trending topics and search, limiting 150,000.10 Table 8: Top 10 hashtags that declined (β < 0) in usage by
QAnon post Twitter Action, estimated by regression discon-
tinuity design in top 10K hashtags used by QAnon accounts
QAnon activities timeline. Timeline of tweet volume
(original, retweet, quote, reply) from QAnon accounts is vi- Hashtag |β| slope intercept p-value
sualized in Fig. 4a. We separately plot the total daily vol-
ume of tweets and the daily volume of tweets containing the wwg1wga 1.512 -0.047 4.951 0.002
QAnon keywords (frequently associated with QAnon listed qanon 0.901 -0.03 2.974 0.007
kag 0.411 -0.002 1.419 0.000
earlier in Table 5). As observed, although the volume of
q 0.226 -0.004 0.584 0.000
tweets with QAnon associated keywords sharply declines qarmy 0.207 -0.008 0.7 0.048
after the Twitter Action, but the overall volume of activ- wwg1gwa 0.139 -0.005 0.47 0.071
ities from these accounts is sustained even after imposed qanons 0.108 -0.004 0.42 0.031
bans and restrictions. This clearly suggests a gap in enforce- patriotstriketeam 0.087 -0.001 0.164 0.010
ment actions and desired outcomes. So we investigate eva- deepstate 0.082 -0.001 0.233 0.000
sion strategies that rendered Twitter Action ineffective. inittogether 0.067 -0.002 0.19 0.083
In Fig. 4b we inspect whether new QAnon accounts
were injected to continue activities after the Twitter Action.
Whilst a declining and small fraction of new accounts were For RDD, we consider each hashtag in the most frequent
introduced, the fraction of the total volume of QAnon ac- 10K hashtags adopted in QAnon account tweets, and fit a
count tweets attributed to new accounts created after Twitter linear regression model on the hashtag’s daily usage vol-
Action is less than 3%. Clearly, much of the volume is sus- ume during the data collection period, with an additional
tained by earlier accounts even after the ban. treatment variable assigned to the regression model to cap-
ture intervention effect. The regression model is as follows,
Evasion strategies with emerging and declining hashtags. y = mx + b + βI{x > x0 }. Here, the hashtag usage volume
Twitter restrictions attempted to make QAnon content less per day (i.e., how many times the hashtag was adopted in
visible, by banning QAnon-related content from appear- tweets from QAnon accounts), normalized by tweet volume
ing in trends and search. Therefore, we examine changes from QAnon accounts on that day, is modeled by dependent
in QAnon content through analysis of hashtag usage pat- variable y, over each day x. The slope m and intercept b
terns, that could have been employed as evasion strategies captures the trend in hashtag usage, and the coefficient β of
to sidestep Twitter restrictions. To that end, we leverage re- the treatment variable I{x > x0 } captures the discontinuity
gression discontinuity design (RDD) to estimate causal ef- at threshold x0 , selected as the end of the week that Twitter
fects of Twitter intervention, on hashtags adopted by QAnon announced and enforced its restrictions on QAnon.
accounts. RDD is a design which elicits causal effects of in- In Table 8 and 9, we list identified hashtags with highest
terventions by assigning a threshold above/below which an estimated treatment effects |β| (i.e., most change with re-
intervention is assigned (Lee and Lemieux 2010). By com- spect to Twitter’s intervention on QAnon with p-value of β
paring observations lying closely on either side of the thresh- at most 0.2) and highlighted in bold are p-value ≤ 0.05 i.e.,
old, it is possible to estimate the average treatment effect 95% confidence interval.11 In the assumed function, since a
from observed data, when randomized trials are infeasible. common slope with different intercepts (b before interven-
10 11
https://www.nbcnews.com/tech/tech-news/twitter-bans-7- The goodness of fit tests and other regression statistics, with
000-qanon-accounts-limits-150-000-others-n1234541 few illustrated examples of identified hashtags are in the Appendix.Table 9: Top 20 hashtags that increased (β > 0) in usage by retweet engagements per day per QAnon account tweet de-
QAnon post Twitter Action, estimated by regression discon- creased by 12.53%, from earlier part of the timeline to later
tinuity design in top 10K hashtags used by QAnon accounts half after Twitter action, the overall volume of retweet en-
gagements per day increased by ∼7%. This can be explained
Hashtag |β| slope intercept p-value by 22.32% increase in QAnon tweet volume per day, com-
walkawayfromdemocrats 0.138 -0.001 0.145 0.000 pensating for decrease in engagements per tweet. Similar for
saveourchildren 0.099 0.002 0.011 0.158 quoted tweets, but for reply tweets the engagements volume
huge 0.074 -0.001 0.016 0.130 declined overall by ∼6% in the later half of the timeline.
heelsupharris 0.068 0.0 0.006 0.098
vote 0.067 0.0 0.071 0.005
warroompandemic 0.065 -0.001 0.041 0.007
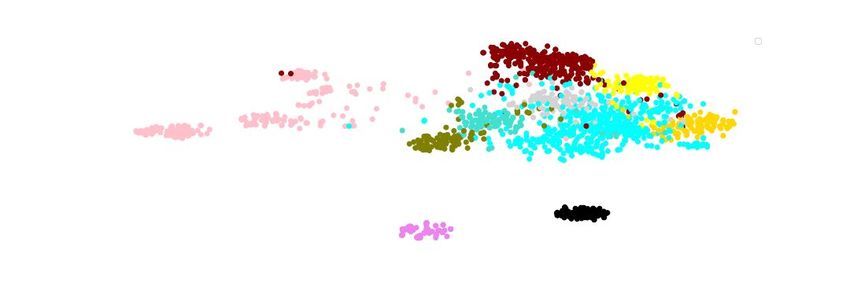
Propagation dynamics of election cascades
th3d3n 0.064 -0.001 0.016 0.002 In Fig. 5, we provide additional analysis of engagements
womenfortrump 0.061 0.0 0.086 0.133 with unreliable/conspiracy tweets by comparing cascade
thesilentmajority 0.059 0.0 0.017 0.122 propagation dynamics. The engagements with the unre-
sallyyates 0.058 -0.001 0.015 0.058
hcqworksfauciknewin2005 0.055 -0.001 0.014 0.000
liable/conspiracy tweets appeared less viral (mean time
nomailinvoting 0.053 0.0 0.014 0.000 to reach unique accounts is higher (Fig. 5d), and mean
mo03 0.051 -0.001 0.015 0.032 breadth of accounts reached at lesser depth of the propa-
trump2020victory 0.05 -0.001 0.03 0.001 gation tree is smaller (Fig. 5b)). The propagation tree cor-
hermancain 0.05 -0.001 0.016 0.003 responding to each cascade was constructed from available
bigpharma 0.05 -0.001 0.018 0.000 retweet/reply/quote links between tweets. Yet, there can be
jimcrowjoe 0.05 -0.001 0.032 0.072
bidenisapedo 0.049 -0.001 0.014 0.011 several unreliable/conspiracy cascades that do get many en-
vppick 0.049 -0.001 0.008 0.172 gagements (cascade size CCDF (Fig 5a)). The findings about
hcqzinc4prevention 0.048 -0.001 0.015 0.000 the propagation tree structure are similar to previous find-
ings on unverified information or rumor cascades (Friggeri
Table 10: % Decrease in ratio of direct engagements (reply et al. 2014). In addition, unreliable/conspiracy cascades ap-
to, retweet, quote) with QAnon accounts tweets to volume pear to have more repeated engagements (reaching fewer
of QAnon accounts tweets, before and after Twitter Action unique users for the same cascade size (Fig. 5c)), which is
also observed in (Ruchansky, Seo, and Liu 2017).
Vosoughi, Roy, and Aral (2018) studied propagation dy-
Tweet Type Vol./ Vol./ %Increase %Decrease
day day (Vol./ day) (Eng vol./ namics of false and true news (verified on fact-checking
(Before) (After) QAnon tweet) websites e.g. snopes.com) on Twitter from 2006-2017. They
QAnon 295,267 361,176 22.32 - found that fact-checked false news was more viral (diffused
RP TO 49,161 46,114 -6.2 23.32 farther, faster, deeper and more broadly) than fact-checked
RT 177,013 189,387 6.99 12.53 true news. We note that the study provides useful find-
QTD 8908 8985 0.86 17.55 ings, however, is specific to information that has been fact-
checked (e.g. PolitiFact often fact-checks statements submit-
ted by readers, and mentions that since they cannot check
tion and b + β after intervention) is used to capture the esti- all claims, they select the most newsworthy and significant
mated treatment effect, both coefficients β and m determine ones12 ) Also, the fact-checked true rumors would likely not
whether the hashtag’s usage declined or increased post in- include mainstream news articles. In comparison, our find-
tervention. For declining hashtags, β < 0, m ≤ 0 are in- ings about unreliable/conspiracy cascades being less viral
dicators of decreased intercept post intervention, whereas than reliable cascades illustrate a more general comparison,
β > 0, m ≥ 0 indicate increased intercept and increased beyond only popular false or non-mainstream true news.
hashtag usage post intervention. An error margin of ±0.001
from 0 was considered for the slope based on inspection of Discussions and Conclusions
scatter plots of data for fitted regressions that were nearly In this work, we studied the disinformation landscape
parallel to the x-axis, resulting in difference of averages on through identification of unreliable/conspiracy tweets, and
either side of the intervention as estimated treatment effects. analysis of QAnon conspiracy group and its activities. We
Declining hashtags post intervention (ordered by mag- focused on characterization of targeted topics of disinforma-
nitude |β|) included prominent tags associated with the tion, and engagements with QAnon based on political lean-
QAnon movement such as wwg1wga, qanon, q, qarmy, ing and tweet types, to understand how attempts to manipu-
deepstate (Table 8). Increasing hashtags post interven- late the discourse prior to the election were conducted. Un-
tion (Table 9) included alternate hashtags e.g. walk- fortunately, our findings also suggest that Twitter actions to
awayfromdemocrats, nomailinvoting, bidenisapedo, hcq- limit the QAnon conspiracy might not have been sufficient
worksfauciknewin2005, suggesting a disconcerting gap in and effective, and even known conspiracy groups can adapt
intended enforcement actions and their actual effectiveness. and evade imposed restrictions.
We examined the change in volume of engagements (di- The characterization of engagements based on politi-
rect engagements in the form of replies to, retweets of, cal leaning also indicates that many accounts in the ac-
quotes of) with QAnon accounts tweets, following Twit-
12
ter intervention on QAnon (Tab 10). While the volume of PolitiFact.com/How we choose claims to fact-check.1.0 Unreliable/consp. 1.0 Unreliable/consp.
(normalized by cascade size)
Reliable Reliable
0.8 0.8 0.06
Mean Breadth
0.6 0.6 0.04
CCDF
0.4 0.4 0.02
0.2 0.2 0.00
0 100 200
0.0 0.0
2.5 5.0 7.5 10.0 12.5 0 100 200 300
Cascade Size (Log-Scale) Depth
(a) (b) (c) (d)
Figure 5: Comparison of information propagation dynamics of reliable vs. unreliable/conspiracy cascades identified in election-
related tweets. (a) CCDF of cascade size. (b) Mean breadth to depth ratio. Reliable cascades run broader at shorter depths of
cascade propagation trees. (c) Avg. unique users reached at each cascade size with more repeated engagements from same
accounts in unreliable cascades. (d) Mean time to reach unique users is higher and more bursty for unreliable cascades.
tive accounts (appearing more than 20 times in collected
tweets) had interactions with QAnon account tweets, with
majority of the endorsements being from right-leaning ac-
counts. QAnon also actively engaged in discussions with
left-leaning accounts through replies. Conspiratorial and far-
right or far-left narratives can therefore potentially worsen
the ideological separation in U.S. politics. Even certain unre- Figure 6: RDD data plot for example hashtags (Left)
liable and conspiracy tweets which contain misleading infor- “wwg1wga” (Middle) “walkawayfromdemocrats” (Right)
mation and lack evidence, can get significant reshares, and “nomailinvoting” before and after Twitter action (fraction of
increase uncertainty about the truth. hashtag usage in volume of QAnon tweets ’y’ vs. day ’x’)
In conclusion, we discuss limitations of the current study.
Although we find high recall of unreliable and conspiracy
claims with the CSI model based on cross-validation over
tweets labeled using news source URLs, reducing false pos-
itives is desirable for solutions to limit disinformation, with-
out censoring free speech. Also, distorted narratives lie on
a spectrum of truth, that can be hard to assess. In addition,
here we regard right-leaning accounts that tweet pre-defined
QAnon related keywords or hashtags as QAnon accounts. Figure 7: Cascade propagation comparison only on labeled
In future work, it will be desirable to make finer distinctions set (unreliable/conspiracy vs. reliable news source labels).
to characterize conspiratorial vs. non-conspiratorial far-right
narratives in QAnon tweets, as well as to characterize tweets
that debunk QAnon conspiracies, and investigate account in- of manually selected fixed keywords. The inspected topics,
teractions based on these distinctions. We also discuss the accounts, and hashtags distributions do suggest comprehen-
limitations of causal estimation from observational data. In sive coverage of election events and disinformation.
RDD, since we do not control for confounding variables
that might be related to real-world events, it is possible that Appendix
a spike caused in a hashtag’s usage near the intervention
Regression statistics. In Table 11, goodness-of-fit tests are
might be attributed to the intervention, instead of a possi-
provided for the RDD regression function (illustrated exam-
ble unrelated confounding event. Also, given the certainty
ples in Fig 6). When comparing different degree polynomi-
of the Twitter action date, we use RDD with a hard thresh-
als as chosen functions for RDD, we found AIC and BIC
old, which is a reasonable assumption based on inspection
were lowest for degree-1 (we measured up to degree-4, since
of the results; however, extensions to fuzzy RDD could be
the results are similar we show only degree-1 and degree-2
alternatively considered (Lee and Lemieux 2010).
in the table). Degree-1 is the model used in the RDD anal-
We also discuss inherent limitations in data collection. ysis y = mx + b + βI(x > x0 ) (Lee and Lemieux 2010).
The standard API allows access to a ∼1% sample of the Adjusted R2 , f-statistic and p-values of the coefficients also
Twitter stream filtered based on tracked parameters. Since indicate degree-1 is preferred, since the p-value of coeffi-
Twitter does not allow unpaid access to historical tweets cient m2 for x2 term is not significant at 0.05. The results
older than 7 days, it is hard to do iterative/snowball sam- were also consistent when separate coefficients of dependent
pling based on keyword expansions. Therefore, we rely on variables were used on either side of the intervention.
tracking candidate mentions in tweet text/metadata instead Cascade propagation. To confirm that our findings are notYou can also read