Predicting Depression via Social Media - AAAI
←
→
Page content transcription
If your browser does not render page correctly, please read the page content below
Proceedings of the Seventh International AAAI Conference on Weblogs and Social Media

                                   Predicting Depression via Social Media
       Munmun De Choudhury                               Michael Gamon                      Scott Counts                Eric Horvitz
                                              Microsoft Research, Redmond WA 98052
                                          {munmund, mgamon, counts, horvitz}@microsoft.com

                              Abstract                                           laboratory test for diagnosing most forms of mental illness;
   Major depression constitutes a serious challenge in personal                  typically, the diagnosis is based on the patient’s self-
   and public health. Tens of millions of people each year suf-                  reported experiences, behaviors reported by relatives or
   fer from depression and only a fraction receives adequate                     friends, and a mental status examination.
   treatment. We explore the potential to use social media to                       In the context of all of these challenges, we examine the
   detect and diagnose major depressive disorder in individu-                    potential of social media as a tool in detecting and
   als. We first employ crowdsourcing to compile a set of                        predicting affective disorders in individuals. We focus on a
   Twitter users who report being diagnosed with clinical de-
                                                                                 common mental illness: Major Depressive Disorder or
   pression, based on a standard psychometric instrument.
   Through their social media postings over a year preceding
                                                                                 MDD1. MDD is characterized by episodes of all-
   the onset of depression, we measure behavioral attributes re-                 encompassing low mood accompanied by low self-esteem,
   lating to social engagement, emotion, language and linguis-                   and loss of interest or pleasure in normally enjoyable
   tic styles, ego network, and mentions of antidepressant med-                  activities. It is also well-established that people suffering
   ications. We leverage these behavioral cues, to build a sta-                  from MDD tend to focus their attention on unhappy and
   tistical classifier that provides estimates of the risk of de-                unflattering information, to interpret ambiguous
   pression, before the reported onset. We find that social me-                  information negatively, and to harbor pervasively
   dia contains useful signals for characterizing the onset of                   pessimistic beliefs (Kessler et al., 2003; Rude et al., 2004).
   depression in individuals, as measured through decrease in
                                                                                    People are increasingly using social media platforms,
   social activity, raised negative affect, highly clustered
   egonetworks, heightened relational and medicinal concerns,
                                                                                 such as Twitter and Facebook, to share their thoughts and
   and greater expression of religious involvement. We believe                   opinions with their contacts. Postings on these sites are
   our findings and methods may be useful in developing tools                    made in a naturalistic setting and in the course of daily
   for identifying the onset of major depression, for use by                     activities and happenings. As such, social media provides a
   healthcare agencies; or on behalf of individuals, enabling                    means for capturing behavioral attributes that are relevant
   those suffering from depression to be more proactive about                    to an individual’s thinking, mood, communication,
   their mental health.                                                          activities, and socialization. The emotion and language
                                                                                 used in social media postings may indicate feelings of
                          Introduction                                           worthlessness, guilt, helplessness, and self-hatred that
                                                                                 characterize major depression. Additionally, depression
Mental illness is a leading cause of disability worldwide. It
                                                                                 sufferers often withdraw from social situations and activi-
is estimated that nearly 300 million people suffer from de-
                                                                                 ties. Such changes in activity might be salient with changes
pression (World Health Organization, 2001). Reports on
                                                                                 in activity on social media. Also, social media might re-
lifetime prevalence show high variance, with 3% reported
                                                                                 flect changing social ties. We pursue the hypothesis that
in Japan to 17% in the US. In North America, the probabil-
                                                                                 changes in language, activity, and social ties may be used
ity of having a major depressive episode within a one year
                                                                                 jointly to construct statistical models to detect and even
period of time is 3–5% for males and 8–10% for females
                                                                                 predict MDD in a fine-grained manner, including ways that
(Andrade et al., 2003).
                                                                                 can complement and extend traditional approaches to diag-
   However, global provisions and services for identifying,
                                                                                 nosis.
supporting, and treating mental illness of this nature have
                                                                                    Our main contributions in this paper are as follows:
been considered as insufficient (Detels, 2009). Although
                                                                                 (1) We use crowdsourcing to collect (gold standard)
87% of the world’s governments offer some primary care
                                                                                 assessments from several hundred Twitter users who report
health services to tackle mental illness, 30% do not have
                                                                                 that they have been diagnosed with clinical MDD, using
programs, and 28% have no budget specifically identified
                                                                                 the CES-D2 (Center for Epidemiologic Studies Depression
for mental health (Detels, 2009). In fact, there is no reliable
                                                                                 Scale) screening test.

Copyright © 2013, Association for the Advancement of Artificial Intelli-
                                                                                 1
gence (www.aaai.org). All rights reserved.                                         For the sake of simplicity, we would refer to MDD simply as
                                                                                 “depression” throughout the paper.

                                                                           128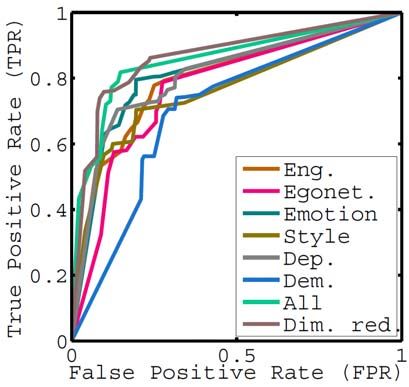
(2) Based on the identified cohort, we introduce several                 Although studies to date have improved our understand-
measures and use them to quantify an individual’s social               ing of factors that are linked to mental disorders, a notable
media behavior for a year in advance of their reported                 limitation of prior research is that it relies heavily on small,
onset of depression. These include measures of: user                   often homogeneous samples of individuals, who may not
engagement and emotion, egocentric social graph,                       necessarily be representative of the larger population. Fur-
linguistic style, depressive language use, and mentions of             ther, these studies typically are based on surveys, relying
antidepressant medications.                                            on retrospective self-reports about mood and observations
(3) We compare the behaviors of the depressed user class,              about health: a method that limits temporal granularity.
and the standard user class through these measures. Our                That is, such assessments are designed to collect high-level
findings indicate, for instance, that individuals with                 summaries about experiences over long periods of time.
depression show lowered social activity, greater negative              Collecting finer-grained longitudinal data has been diffi-
emotion, high self-attentional focus, increased relational             cult, given the resources and invasiveness required to ob-
and medicinal concerns, and heightened expression of                   serve individuals’ behavior over months and years.
religious thoughts. Further, despite having smaller                      We leverage continuing streams of evidence from social
egonetworks, people in the depressed class appear to                   media on posting activity that often reflects people’s psy-
belong to tightly clustered close-knit networks, and are               ches and social milieus. We seek to use this data about
typically highly embedded with the contacts in their                   people’s social and psychological behavior to predict their
egonetwork.                                                            vulnerabilities to depression in an unobtrusive and fine-
                                                                       grained manner.
(4) We leverage the multiple types of signals obtained thus
                                                                         Moving to research on social media, over the last few
to build an MDD classifier, that can predict, ahead of
                                                                       years, there has been growing interest in using social media
MDD onset time, whether an individual is vulnerable to
                                                                       as a tool for public health, ranging from identifying the
depression. Our models show promise in predicting
                                                                       spread of flu symptoms (Sadilek et al., 2012), to building
outcomes with an accuracy of 70% and precision of 0.74.
                                                                       insights about diseases based on postings on Twitter (Paul
   We believe that this research can enable new
                                                                       & Dredze, 2011). However, research on harnessing social
mechanisms to identify at-risk individuals, variables
                                                                       media for understanding behavioral health disorders is still
related to the exacerbation of major depression, and can
                                                                       in its infancy. Kotikalapudi et al., (2012) analyzed patterns
frame directions on guiding valuable interventions.
                                                                       of web activity of college students that could signal de-
                                                                       pression. Similarly, Moreno et al., (2011) demonstrated
               Background Literature                                   that status updates on Facebook could reveal symptoms of
Rich bodies of work on depression in psychiatry, psychol-              major depressive episodes.
ogy, medicine, and sociolinguistics describe efforts to                  In the context of Twitter, Park et al., (2012) found initial
identify and understand correlates of MDD in individuals.              evidence that people post about their depression and even
Cloninger et al., (2006) examined the role of personality              their treatment on social media. In other related work, De
traits in the vulnerability of individuals to a future episode         Choudhury et al., (2013) examined linguistic and emotion-
of depression, through a longitudinal study. On the other              al correlates for postnatal changes of new mothers, and
hand, Rude et al., (2003) found support for the claim that             built a statistical model to predict extreme postnatal behav-
negative processing biases, particularly (cognitive) biases            ioral changes using only prenatal observations. The latter
in resolving ambiguous verbal information can predict                  work highlights the potential of social media as a source of
subsequent depression. Robinson and Alloy, (2003)                      signals about likelihood of current or future episodes of
similarly observed that negative cognitive styles and stress-          depression. With the present work we: (1) expand the
reactive rumination were predictive of the onset, number               scope of social media-based mental health measures, de-
and duration of depressive episodes. Finally, Brown et al.,            scribing the relationship between nearly 200 measures and
(1986) found that lack of social support and lowered self-             the presence of depression; and (2) demonstrate that we
esteem are important factors linked to higher incidences of            can use those measures to predict, ahead of onset, depres-
depression. Among a variety of somatic factors, reduced                sive disorders in a cohort of individuals who are diagnosed
energy, disturbed sleep, eating disorders, and stress and              with depression via a standard psychometric instrument.
tension have also been found to be correlates of depressive
disorders (Abdel-Khalek, 2004).                                                                    Data
   In the field of sociolinguistics, Oxman et al., (1982)
showed that linguistic analysis of speech could classify pa-           Ground Truth Data Collection
tients into groups suffering from depression and paranoia.             We employ crowdsourcing to collect labels we take as
Computerized analysis of written text through the LIWC                 ground truth data on the presence of MDD. Crowdsourcing
program has also been found to reveal predictive cues                  is an efficient mechanism to gain access to behavioral data
about neurotic tendencies and psychiatric disorders (Rude,             from a diverse population, is less time consuming, and is
Gortner & Pennebaker, 2004).

                                                                 129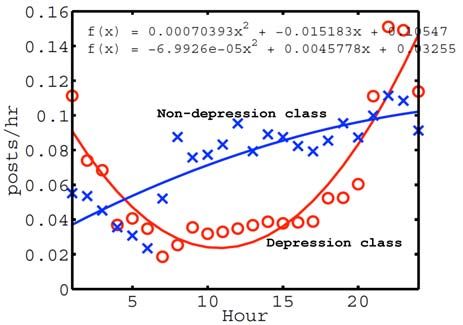
inexpensive (Snow et al., 2008). Using Amazon’s Mechan-                    Note that in order to minimize bias, we refrained from
ical Turk interface, we designed human intelligence tasks               indicating in our HITs that the two tests were depression
(HITs) wherein crowdworkers were asked to take a stand-                 screening questionnaires. Rather, we simply mentioned
ardized clinical depression survey, followed by several                 that they measure behavioral patterns. We also randomized
questions on their depression history and demographics.                 the order of the CES-D and BDI questionnaires in the HITs
The crowdworkers could also opt in to share their Twitter               to avoid biases stemming from the ordering of the surveys.
usernames if they had a public Twitter profile, with an                 Self-reported Information
agreement that their data could be mined and analyzed
                                                                        Finally, we collected information about the crowdworkers’
anonymously using a computer program. We sought re-
                                                                        depression history and experiences by assessing:
sponses from crowdworkers who were located in the Unit-
ed States, and had an approval rating on Amazon Mechani-                • Whether or not they had been diagnosed with clinical
cal Turk (AMT) greater than or equal to 90%. Each                          depression in the past. If so, when.
crowdworker was restricted to take the HIT exactly once,                • If they were clinically depressed, what was the estimated
and was paid 90 cents for completing the task.                             time of its onset.
                                                                        • If they are currently depressed, or using any anti-
Depression Screening Test
                                                                           depression medications.
We used the CES-D (Center for Epidemiologic Studies                        We also asked if crowdworkers could share their Twitter
Depression Scale)2 questionnaire as the primary tool to de-             username for research analysis purposes, should they be
termine the depression levels of the crowdworkers. The                  owners of a public Twitter profile.
CES-D is a 20-item self-report scale that is designed to
measure depressive symptoms in the general population                   Statistics of Ground Truth Data
(Radloff, 1977), and is one of the most common screening                A total of 1,583 crowdworkers completed our HITs be-
tests used by clinicians and psychiatrists for the purpose. It          tween September 15 and October 31, 2012. 637 partici-
measures symptoms defined by the American Psychiatric                   pants (~40%) agreed to provide us with access to their
Association Diagnostic and Statistical Manual (DSM-IV),                 Twitter feeds. Next we eliminated noisy respondents based
and quantifies depressive feelings and behaviors during the             on the two-step technique discussed earlier, which yielded
past week. For example, the test seeks responses to ques-               a set of 554 users. Finally, we intended to focus on indi-
tions such as: “I thought my life was a failure”; “I felt lone-         viduals with depression onset dates anytime in the last one
ly”; “I had crying spells”. Participants were asked to                  year, but no later than three months prior to the day the
choose one of the following responses to each of the ques-              survey was taken. This ensured that we could collect rea-
tions: (i) Rarely or none of the time (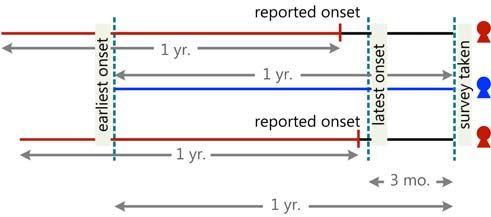
In our final dataset of 476 users, we used the responses                 In Table 1 we list several statistics of the crawled da-
to the CES-D questionnaires as our primary depression                     taset. A few samples of posts randomly selected from the
level estimation tool. With CES-D, typically three groups                 data of users in the depression class are shown in Table 2.
of depression severity are calculated (Radloff, 1977): low
(0-15), mild to moderate (16-22), and high range (23-60).                          Measuring Depressive Behavior
The literature indicates that a cut-off of 16 is prone to
yielding a high number of false-positives. Thus, several                  We first present a set of attributes that can be used to char-
studies adopt higher cut-offs (e.g., 20, 22, or 27). In this              acterize the behavioral differences of the two classes of us-
work, we used 22 as our chosen threshold (also see Park et.               ers—one of which consists of individuals exhibiting clini-
al., (2012)), to minimize Type I and Type II errors in our                cal depression, based on the year-long feed of their Twitter
subsequent prediction task.                                               postings. Note these measures are defined to be dynamic
   We obtained 171 users (~36%) who scored positive for                   measures, i.e., we calculate their values daily based on the
depression. We note that Park et. al., (2012) found a simi-               activity of users over the entire year-long period preceding
lar percentage of individuals in their study, scoring posi-               depression onset or the date survey was taken by them.
tively for depression. Two classes of users were construct-
ed in this manner: an MDD positive class of 171 users                     Engagement
scoring high for depression; and negative class of 305 us-                We define five measures of engagement motivated from
ers: ones with little or no signs of the condition.                       (De Choudhury et al., 2013): Volume, defined as the nor-
                                                                          malized number of posts per day made by the user; Propor-
Social Media Data                                                         tion of reply posts (@-replies) from a user per day indicat-
For behavioral exploration and prediction, we collected da-               ing her level of social interaction with other Twitter users;
ta from the Twitter feeds of all users. We used the Twitter               The fraction of retweets from a user per day, signaling how
Firehose made available to us via our organization’s con-                 she participates in information sharing with her followers;
tract with Twitter. Depending on the depression onset date                The proportion of links (urls) shared by each user over a
of each of the users in the positive class, we collected all of           day; and fraction of question-centric posts from a user in a
their Twitter posts in the past one year, dating back from                day, measuring the user’s tendency to seek and derive in-
the reported depression onset. For instance, for a user with              formational benefits from the greater Twitter community.
depression onset date of July 17, 2012, we collected all of               Insomnia index: Our final engagement measure quantifies
her posts made between July 17, 2011 and July 16, 2012.                   the pattern of posting made by a user during the course of a
For users in the negative class, we collected all of their                day (24 hour cycle). Literature on depression indicates that
postings in the one year prior to the date they took our                  users showing depression signs tend to be active during the
AMT survey. Figure 1 illustrates the data collection pro-                 evening and night. Hence we define a “night” window as
cess. Note that we set an allowed time range for depression               “9PM—6AM” (consequently the “day” window for the
onset (max and min), in order to ensure that we captured                  same user, in local time, would be “6:01AM-8:59PM”).
users with a sufficiently long history of clinical MDD.                   For each user, we thus define the normalized difference in
Total number of users                                       476           number of postings made between night window and day
Total number of Twitter posts                         2,157,992           window to be the “insomnia index” on a given day.
Mean number of posts per user over the entire 1          4,533.4
year period                                                               Egocentric Social Graph
Variance of number of posts per user over the en-          3,836
tire 1 year period                                                        We define a number of egocentric network measures for
Mean number of posts per day per user                       6.67          users, based on both social graph structure, as well as the
Variance of number of posts per day per user               12.42          interactions with others on Twitter (through @-replies).
                                                                          These measures can be categorized into three types: (1)
     Table 1: Statistics of Twitter data of study cohort.
                                                                          node properties (focusing on a particular user u); (2) dyad-
 Having a job again makes me happy. Less time to be depressed             ic properties (focusing on a user u and another user v with
 and eat all day while watching sad movies.                               whom she interacts through an @-reply); and (3) network
 “Are you okay?” Yes…. I understand that I am upset and hope-             properties (focusing on a user u in the context of her entire
 less and nothing can help me… I’m okay… but I am not alright             egocentric network of @-reply exchanges). For the pur-
 “empty” feelings I WAS JUST TALKING ABOUT HOW I I                        poses of this paper, we consider the egocentric social graph
 HAVE EMOTION OH MY GOODNESS I FEEL AWFUL                                 of a user to be an undirected network of the set of nodes in
 I want someone to hold me and be there for me when I’m sad.              u’s two-hop neighborhood (neighbors of the neighbors of
 Reloading twitter till I pass out. *lonely* *anxious* *butthurt*
                                                                          users in our dataset), where an edge between u and v im-
 *frustrated* *dead*
                                                                          plies that there has been at least one @-reply exchange
Table 2: Example posts from users in the depression class.                each, from u to v, and from v to u on a given day.

                                                                    131
(1) Node properties. We first define two measures that Depression Language
characterize the nature of a user’s egocentric social net- Finally we define two specialized features focused on
work as in (De Choudhury et al., 2013). The first feature is characterizing the topical language of individuals detected
the number of followers or inlinks of a user at a given day, positively with depression. While our previous measure fo-
while the second is the count of her followees or outlinks. cused on the linguistic style of depressive language, we are
(2) Dyadic properties. In this category, we define a meas- also interested in analyzing what people talk about.
ure called reciprocity, which is measured as how many (a) Depression lexicon. The first feature measures the us-
times a user u responds to another user v who had sent her age of depression-related terms, defined broadly, in Twitter
@-reply messages. It is given by the mean of the ratio of posts. For this purpose, we built a lexicon of terms that are
the number of @-replies from u to any user v, to the num- likely to appear in postings from individuals discussing de-
ber of @-replies from v to u. The second feature in this pression or its symptoms in online settings. We mined a
category is called the prestige ratio, and is given by the ra- 10% sample of a snapshot of the “Mental Health” category
tio of the number of @-replies that are targeted to u, to the of Yahoo! Answers. In addition to already being catego-
number of @-replies targeted to a user v, where v is a user rized as relevant to depression, these posts are separated in-
with whom u has a history of bi-directional @-replies. to questions and answers and are relatively short, making
(3) Network properties. In this final category, we define them well-aligned to the construction of a depression lexi-
four measures. We define graph density to be the ratio of con that can eventually be deployed on Twitter.
the count of edges to the count of nodes in u’s egocentric We extracted all questions and the best answer for each
social graph. The second feature is the clustering coeffi- of question, resulting in 900,000 question/answer pairs. Af-
cient of u’s ego network, which is a standard notion of lo- ter tokenizing the question/answer texts, we calculated for
cal density, i.e. the average probability that two neighbors each word in the corpus its association with the regex “de-
of u are neighbors of each other. The third feature, size of press*” using pointwise mutual information (PMI) and log
two-hop neighborhood is defined as the count of all of u’s likelihood ratio (LLR). We created the union of top 1% of
neighbors, plus all of the neighbors of u’s neighbors. We terms in terms of LLR and PMI. To remove extremely fre-
define the next feature embeddedness of u with respect to quent terms, we calculated the tf.idf for these terms in
her neighborhood as the mean of the ratio between the set Wikipedia and used the top 1000 words with high tf.idf.
of common neighbors between u and any neighbor v, and Thereafter we deployed this lexicon to determine frequen-
the set of all neighbors of u and v. The final feature in this cy of use of depression terms that appear in the Twitter
category is the number of ego components in u’s egonet- posts of each user, on a given day.
work, defined as the count of the number of connected (b) Antidepressant usage. The next feature measures the
components that remain when the focal node u and its inci- degree of use of names of antidepressants popular in the
dent edges are removed (De Choudhury et al., 2010). treatment of clinical depression (any possible overlap with
the above lexicon was eliminated). Individuals with de-
Emotion pression condition are likely to use these names in their
We consider four measures of the emotional state of users posts, possibly to receive feedback on their effects during
in our dataset: positive affect (PA), negative affect (NA), the course of treatment (Ramirez-Esparza et al., 2008). We
activation, and dominance. Daily measurements of PA and used the Wikipedia page on “list of antidepressants” in or-
NA per user are computed using the psycholinguistic re- der to construct a lexicon of drug names
source LIWC (http://www.liwc.net/), whose emotion cate- (http://en.wikipedia.org/wiki/List_of_antidepressants).
gories have been scientifically validated to perform well
for determining affect in Twitter (De Choudhury et al.,
2013). We use the ANEW lexicon (Bradley & Lang, 1999)
for computing activation and dominance. Activation refers
to the degree of physical intensity in an emotion (“terri-
fied” is higher in activation than “scared”), while domi-
nance refers to the degree of control in an emotion (“an-
ger” is dominant, while “fear” is submissive).
Linguistic Style
We also introduce measures to characterize linguistic
styles in posts from users (Rude et al., 2004). We again use
LIWC for determining 22 specific linguistic styles, e.g.:
articles, auxiliary verbs, conjunctions, adverbs, personal Figure 2: Diurnal trends (i.e. mean number of posts made hourly
pronouns, prepositions, functional words, assent, negation, throughout a day) for the two classes. The line plots correspond
certainty and quantifiers. to least squares fit of the trends.
132Behavioral Attributes of Depression feature vector and predicts a binary response variable (de-
pressed/not depressed), at the same time handling highly
In the light of the above measures, we present an explora- correlated and sparse inputs. In order to make better sense
tion of behavior of depressed and non-depressed classes. of the unigrams, we derived broad “themes” that would
Diurnal Activity and Depression cluster them together, using responses from crowdworkers
on Amazon’s Mechanical Turk (inter-rater agreement
Figure 2 shows the diurnal pattern of posting (in local Fleiss-Kappa: 0.66). These themes are motivated from pri-
time) from users of the two classes, measured as the mean or work in (Ramirez-Esparza et al., 2008), where the lan-
number of posts made per hour, over the entire one year guage of depression forums was analyzed.
history of Twitter data of the users. We also show polyno- We observe that words about Symptoms dominate, indi-
mial (of order 2) fits for both plots. cating details about sleep, eating habits, and other forms of
From the figure, we observe that for the non-depression physical ailment—all of which are known to be associated
class, most people are less active later in the night (i.e., with occurrence of a depressive episode (Posternak et al.,
post-midnight) and early in the morning, with activity gen- 2006). The second theme shared by the depression class is
erally increasing through the day. Evenings and early Disclosure. It appears that sufferers may turn to social me-
nights show peak, indicating that people are generally dia platforms in order to share feelings with others, receive
more likely to be using social media after the end of work- social support, or to express their emotional state—
day. On the other hand, the depression class trend shows especially feelings of helplessness and insecurity. Users al-
peaks late in the night (post 8pm), with lower activity
through the day (between 9am and 5pm). It is known from
literature that for 8 out of 10 people suffering from depres-
sion, symptoms tend to worsen during the night (Lustberg
& Reynolds, 2000). In fact, night time online activity is a
known characteristic of these individuals, which may ex-
plain the increased levels of nighttime posting on Twitter.
Aggregated Behavior of Depression Sufferers
Next we discuss the patterns of some of the behavioral
measures for both classes in Figure 3. We found marked
differences across the two classes. At an aggregate level,
for the depression class, we observe considerable decrease
in user engagement measures, such as volume (38% lower;
pso appear to discuss to some extent their therapy and unity prestige ratio also makes us conjecture that the
treatment, even dosage levels of medication e.g., 150mg, neighbors of users in the depressed class could be ones
40mg (Treatment theme), as well as generally about con- they trust and connect with on psychological issues, or
cerns in life, work and relationships (Relationships, Life through their experiences. In fact, we know from (Kawachi
theme). In this last category we observe a noticeable vol- & Berkman, 2001) that depressed individuals are known to
ume of unigrams relating to religion or religious thoughts cluster together. However given the limited availability of
(jesus, bible, church, lord). On investigation of the litera- data in our study, we cannot confirm this finding—
ture, it appears that religious involvement is often found to however constitutes an interesting topic for future research.
be comforting to individuals experiencing psychological In conjunction with the higher value of clustering coeffi-
distress or sudden bereavement (McCullough et al., 1999). cient, embeddedness, and number of ego components, we
Theme Unigrams conjecture that these observations indicate that depression
Symptoms anxiety, withdrawal, severe, delusions, adhd, sufferers typically belong to high connectivity close-knit
weight, insomnia, drowsiness, suicidal, appe- networks. This may be an indication that when depressed
tite, dizziness, nausea, episodes, attacks, sleep, individuals turn to social media, they intend to leverage the
seizures, addictive, weaned, swings, dysfunc- tool to build a closed network of trusted people, with
tion, blurred, irritability, headache, fatigue, whom they are comfortable sharing their psychological ex-
imbalance, nervousness, psychosis, drowsy
periences, seeking out social support, or gathering infor-
Disclosure fun, play, helped, god, answer, wants, leave, mation regarding their treatment and medication.
beautiful, suffer, sorry, tolerance, agree, hate,
helpful, haha, enjoy, social, talk, save, win, Egonetwork measures Depres. class Non-depres. class
care, love, like, hold, cope, amazing, discuss #followers/inlinks 26.9 (σ=78.3) 45.32 (σ=90.74)
Treatment medication, side-effects, doctor, doses, effec- #followees/outlinks 19.2 (σ=52.4) 40.06 (σ=63.25)
tive, prescribed, therapy, inhibitor, stimulant, Reciprocity 0.77 (σ=0.09) 1.364 (σ=0.186)
antidepressant, patients, neurotransmitters, Prestige ratio 0.98 (σ=0.13) 0.613 (σ=0.277)
prescriptions, psychotherapy, diagnosis, clini- Graph density 0.01 (σ=0.03) 0.019 (σ=0.051)
cal, pills, chemical, counteract, toxicity, hospi- Clustering coefficient 0.02 (σ=0.05) 0.011 (σ=0.072)
talization, sedative, 150mg, 40mg, drugs 2-hop neighborhood 104 (σ=82.42) 198.4 (σ=110.3)
Embeddedness 0.38 (σ=0.14) 0.226 (σ=0.192)
Relationships, home, woman, she, him, girl, game, men,
#ego components 15.3 (σ=3.25) 7.851 (σ=6.294)
life friends, sexual, boy, someone, movie, favorite,
jesus, house, music, religion, her, songs, party, Table 4. Average measures, along with std. dev. of the ego-
bible, relationship, hell, young, style, church, centric social graph, comparing the depression and non-
lord, father, season, heaven, dating depression classes over the year-long period of analysis.
Table 3. Unigrams from the depression lexicon that appear Predisposition of Depression. In terms of the trends of
with high frequency in the posts from the depression class. each of the behavioral measures in Figure 3, we notice a
These terms had the largest standardized β coefficients general decrease over time in some measures, e.g., volume,
based on penalized logistic regression. replies, activation, 3rd person pronoun (note the negative
In a similar manner, we further observe distinctively slope in the trend lines), while a general increase over time
higher numbers of mentions of antidepressant medication for others like NA, 1st person pronoun usage, swear word
among the depressed class, again based on a penalized lo- use, and frequency of depression terms (positive slope in
gistic regression model: serotonin (β=.32); amphetamine trend lines). We conjecture that this finding indicates indi-
(β=.28); maprotiline (β=.22); nefazodone (β=.13). viduals showing a shift in their behavior as they approach
the onset of their depression—note that the year-long
Egonetwork Characteristics. Next we present differences
trends shown in the figure precede the reported onset of
across the two classes of users based on the egocentric
depression for the users. The clinical literature reports that
network measures, as summarized in Table 4. We notice
a variety of predisposing/precipitating factors or states are
lower numbers of followers and followees for the depres-
associated with the onset of depression in people; these in-
sion class—possibly showing that these users exhibit re-
clude mood disturbances, suicidal thoughts, cognitive im-
duced desire to socialize or tendency to consume external
pairments, or self-care, attention, judgment and communi-
information and remain connected with others. They also
cation (Rabkin & Struening, 1976). Through the general
show reduced reciprocity to others’ communications, indi-
increase of NA, lowered activation or rise in use of depres-
cating decreased desire for social interaction. The lower
sive language over the period preceding depression onset,
value of the graph density of their egonetworks, and the
it seems that Twitter postings do indeed capture this.
smaller sizes of their 2-hop neighborhoods shows that the
interactions per individual in their networks are limited,
compared to the users in the other class. The prestige ratio, Predicting Depressive Behavior
however, seems to be close to unity, compared to the other Given the two classes of users and their differences in be-
class, indicating that depressed individuals and their neigh- havior, how accurately can we forecast, prior to the report-
bors typically have similar numbers of neighbors. Near ed onset of depression, whether or not a user is likely to be
134in the depressed class? In the remainder of the paper, we and the corresponding p-values are given in the table. Note
propose and evaluate a model for the purpose. that we have 188 feature variables; hence to counteract the
problem of multiple comparisons, we adopt Bonferroni
Constructing Feature Vectors correction. We choose a significance level of α=0.05/188=
For each set of behavioral measures, we obtained daily 2.66e-4. In Table 5, we report the features for which we
measurements per user, which helped us construct one time have at least one of mean, variance, momentum or entropy
series per measure per user, over the entire one year of values to be statistically significant.
Twitter history. Next, we developed a series of numbers Mean Variance Momentum Entropy
from each of these time series for a given user, to be used volume 15.21*** 14.88*** 14.65*** 17.57***
eventually in constructing feature vectors for the depres- replies 22.88*** 13.89 29.18*** 19.48***
sion prediction framework. Note that these time series fea- questions 8.205 7.14 23.06*** 10.71
tures take into account the aggregated value over the year- PA 14.64 10.94 13.25 17.74***
long period (given by mean), as well as its trend of change. NA 16.03*** 19.01*** 17.54*** 15.44***
*** ***
activation 19.4 17.56 22.49*** 17.84***
• Mean frequency: the average measure of the time series dominance 20.2 *** 18.33*** 24.49*** 12.92
signal of a feature over the entire period of analysis. #followees 28.05*** 14.65 25.95*** 16.85***
• Variance: the variation in the time series signal over the reciprocity 5.24 *** 5.35 7.93 *** 6.82 ***
entire time period. Given a time series Xi(1), Xi(2), …, clust. coeff. 12.33*** 10.92 15.28*** 11.91
Xi(t), …, Xi(N) on the ith measure, it is given as: #ego comp. 7.29 6.91 *** 9.04 *** 8.56
(1/N)∑t(Xi(t) −µi)2. antidepress 8.68 10.13 10.17*** 5.73
*** ***
• Mean momentum: relative trend of a time series signal, depr. terms 22.29 16.28 22.16*** 18.64***
1st pp. 25.07*** 15.26*** 24.22*** 19.77***
compared to a fixed period before. Given the above time ***
2nd pp. 13.03 12.43 20.36*** 11.49
series, and a period length of M (=7) days, its mean mo- 3rd pp. 20.34*** 14.60 21.47*** 16.96***
mentum is: (1/N)∑t(Xi(t)-(1/(t-M))∑(M≤k≤t-1)Xi(k)). article 9.75 14.41 16.68*** 7.60
• Entropy: the measure of uncertainty in a time series sig- negate 8.42 6.33 16.7 *** 12.13
nal. For the above time series it is: −∑tXi(t)log(Xi(t)). swear 12.91 6.12 20.8 *** 18.99***
***
Besides these features, we also used the self-reported in- p ≤ α, after Bonferroni correction df=474
formation on age, gender, education level, and income of
Table 5: Statistical significance (t-statistic values) of the
the users as another set of features. This yields four num-
mean, variance, momentum and entropy measures of se-
bers per measure for each user in our dataset; a total of 188
lected dynamic features, comparing the depression and
features (there are 43 dynamic features in all; 4 demo-
non-depression classes.
graphic features). We represent each user as such a 188-
item feature vector, with the vector being standardized to The results align with our findings described earlier.
zero mean and unit variance. Across the feature types, certain stylistic, engagement,
emotion measures, and use of depression terms and men-
Prediction Framework tions of antidepressant medication bear distinctive markers
We now pursue the use of supervised learning to construct across the two classes. In general, momentum seems to be
classifiers trained to predict depression in our two user a feature that shows statistical significance across a number
classes. To avoid overfitting, we employ principal compo- of measures, demonstrating that not only is the absolute
nent analysis (PCA), although we report results for both all degree of behavioral change important (indicated by the
dimension-inclusive and dimension-reduced cases. We mean), but the trend of its change over time bears useful
compare several different parametric and non-parametric markers of distinguishing depressive behavior.
binary classifiers to empirically determine the best suitable Now we utilize our proposed classification framework to
classification technique. The best performing classifier was examine how well we can predict, whether or not an indi-
found to be a Support Vector Machine classifier with a ra- vidual is vulnerable to depression, ahead of its onset. In or-
dial-basis function (RBF) kernel (Duda et al., 2000). For der to understand the importance of various feature types,
all of our analyses, we use 10-fold cross validation on the we trained a number of models.
set of 476 users, over 100 randomized experimental runs. We present the results of these prediction models in Ta-
ble 6. The results indicate that the best performing model
Prediction Results (dimension-reduced features) in our test set yields an aver-
age accuracy of ~70% and high precision of 0.74, corre-
We now focus on prediction of future episodes of depres- sponding to the depression class. Note that a baseline mar-
sion. We first present some results of statistical signifi- ginal model would yield accuracy of only 64%, i.e., when
cance of the behavioral features, as measured through their all data points are labeled per the majority class which is
mean, variance, momentum, and entropy values over the the non-depressed class. Good performance of this classifi-
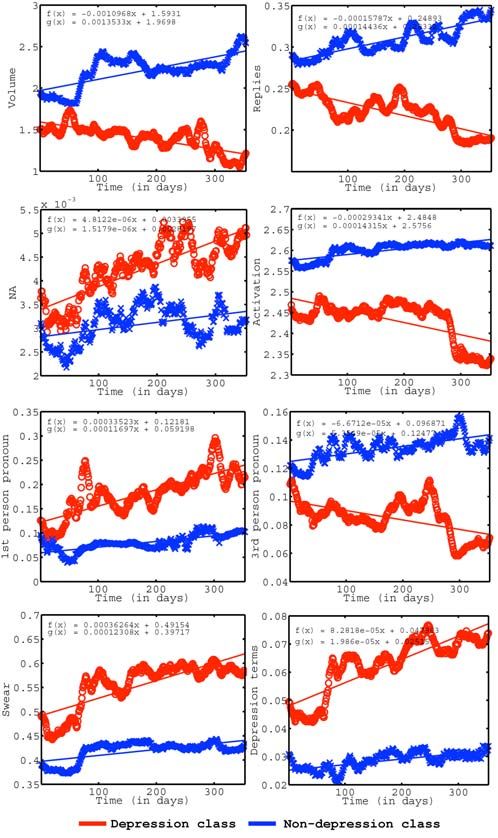
one year period of analysis (Table 5). We use independent er is also evident from the receiver-operator characteristic
sample t-tests, where df=474: the values of the t-statistic (ROC) curves in Figure 4. The dimension-reduced feature
135model gives slightly greater traction compared to the one
that uses all features; demonstrating utility of reducing fea-
ture redundancy.
precision recall acc. (+ve) acc. (mean)
engagement 0.542 0.439 53.212% 55.328%
ego-network 0.627 0.495 58.375% 61.246%
emotion 0.642 0.523 61.249% 64.325%
linguist. style 0.683 0.576 65.124% 68.415%
dep. language 0.655 0.592 66.256% 69.244%
demographics 0.452 0.406 47.914% 51.323%
all features 0.705 0.614 68.247% 71.209%
dim. reduced 0.742 0.629 70.351% 72.384%
Table 6. Performance metrics in depression prediction in
posts using various models. Third column shows the mean
accuracy of predicting the positive class.
We also observe better performance of the model that
uses the linguistic style features alone. Results in prior lit- Figure 4. Receiver Operating Characteristic (ROC) curves
erature suggest that use of linguistic styles such as pro- in predicting labels of users. Each curve corresponds to a
nouns and articles provide information about how individ- model trained on a particular feature type.
uals respond to psychological triggers (Rude et al., 2004; forthcoming extreme changes surpass a threshold, they
Ramirez-Esparza et al., 2008). Next, we note that, one of could be warned or engaged, and information might be
the main characteristics of depression is disturbed cogni- provided about professional assistance and/or the value of
tive processing of information as indexed by disturbed star- social and emotional support from friends and family.
tle reflex modulation, as well as a reduced sense of interest
Privacy Considerations. Concerns regarding individual
or motivation in day-to-day activities (Billings et al., 1984; privacy, including certain ethical considerations, may arise
Oxman et al., 1982). Hence we observe better performance with this form of analyses of social media as they ultimate-
of depression language features in the prediction task. Fi- ly leverage information that may be considered sensitive,
nally the better performance of ego-network features given their focus on behavioral and emotional health. As
shows that the network in which depressed individuals are we mentioned earlier, we collected data from crowdwork-
embedded, serving as a proxy to their social and behavioral ers on AMT whose Twitter profiles were public, and par-
environment, bears key information in light of their condi- ticipants could opt out of sharing their data. For users who
tion. In essence, we conclude that social media activity opted in, the AMT study obtained their consent that it
provides useful signals that can be utilized to classify and would be okay to use their data anonymously in an auto-
predict whether an individual is likely to suffer from de- mated setting, without active human intervention, in doing
pression in the future.
research analyses.
Discussion
Conclusion and Future Work
Implications. The ability to illustrate and model individual
behavior using their social media data, that can predict de- We have demonstrated the potential of using Twitter as a
pression before their estimated onset, shows promise in the tool for measuring and predicting major depression in indi-
design and deployment of next-generation wellness facili- viduals. First we used crowdsourcing to collect gold stand-
tating technologies. We envision privacy-preserving soft- ard labels on a cohort’s depression, and proposed a variety
ware applications and services that can serve as early of social media measures such as language, emotion, style,
warning systems providing personalized alerts and infor- egonetwork, and user engagement to characterize depres-
mation to individuals. These tools perhaps can enable ad- sive behavior. Our findings showed that individuals with
juvant diagnosis of depression and other mental illness, depression show lowered social activity, greater negative
complementary to survey approaches (e.g., CES-D, BDI). emotion, high self-attentional focus, increased relational
Beyond monitoring behavioral trends in real-time, social and medicinal concerns, and heightened expression of
media-based measures, such as volume, NA, activation, religious thoughts. They also appeared to belong to highly
use of depression language etc. can serve as a diary-type clustered close-knit networks, and were typically highly
narrative resource logging “behavioral fingerprints” over embedded with their audiences, in terms of the structure of
extended periods of time. The application might even as- their egonetworks. Finally, we leveraged these distinguish-
sign an “MDD risk score” to individuals based on predic- ing attributes to build an SVM classifier that can predict,
tions made about forthcoming extreme changes in their be- ahead of the reported onset of depression of an individual,
havior and mood. In operation, if inferred likelihoods of his/her likelihood of depression. The classifier yielded
promising results with 70% classification accuracy.
136Among future directions, we hope to understand how Kotikalapudi, R.; Chellappan, S.; Montgomery, F.; Wun-
analysis of social media behavior can lead to development sch, D.; & Lutzen, K. 2012. Associating depressive symp-
of scalable methods for automated public health tracking toms in college students with internet usage using real In-
ternet data. IEEE Technology and Society Magazine.
at-scale. We are also interested in harnessing the potential
of social media in tracking the diffusion of affective disor- Lustberg L; & Reynolds CF 2000. Depression and insom-
ders in populations in a nuanced manner; for identifying nia: questions of cause and effect. Sleep Medicine Reviews
the incidence and impact of trauma on individuals during 4 (3): 253–262.
crisis events, and for modeling of help-seeking behavior, McCullough, Michael E.; & Larson, David B. 1999. Reli-
health risk behaviors, and risk of suicide. gion and Depression: A Review of the Literature. Twin Re-
search, 2(2), 126-136.
References Moreno, M.; Jelenchick, L.; Egan, K.; Cox, E. et al. 2011.
Feeling bad on Facebook: depression disclosures by col-
Abdel-Khalek, A. M. 2004. Can somatic symptoms predict
lege students on a social networking site. Depression and
depression? Social Behavior and Personality: an interna-
Anxiety 28(6):447–455.
tional journal, 32(7), 657-666.
Oxman T.E.; Rosenberg S.D.; & Tucker G.J. 1982. The
Andrade L, Caraveo-A. 2003. Epidemiology of major de-
language of paranoia. American J. Psychiatry 139:275–82.
pressive episodes: Results from the International Consorti-
um of Psychiatric Epidemiology (ICPE) Surveys . Int J Park, M.; Cha, C.; & Cha, M. 2012. Depressive Moods of
Methods Psychiatr Res.12(1):3–21. Users Captured in Twitter. In Proc. ACM SIGKDD Work-
shop on Healthcare Informatics (HI-KDD).
Beck, A. T.; Steer, R. A.; & Brown, G. K. 1996. Manual
for the Beck depression inventory-II. San Antonio, TX: Paul, M., J.; & Dredze, M. 2011. You are What You
Psychological Corporation, 1, 82. Tweet: Analyzing Twitter for Public Health. In Proc. IC-
WSM ’11.
Billings, A.; Moos, Rudolf H. 1984. Coping, stress, and
social resources among adults with unipolar depression. Posternak MA; Solomon DA; Leon AC. 2006. The
Journal of Personality & Social Psych., 46(4), 877-891. naturalistic course of unipolar major depression in the
absence of somatic therapy. J. Nerv & Mental Disease
Bradley, M.M.; & Lang, P.J. 1999. Affective norms for
194(5):324–29.
English words (ANEW). Gainesville, FL. The NIMH Cen-
ter for the Study of Emotion and Attention. Rabkin, J. G.; & Struening, E. L. 1976. Life events, stress,
and illness. Science, 194(4268), 1013-1020.
Brown, G. W.; Andrews, B.; Harris, T.; Adler, Z.; &
Bridge, L. 1986. Social support, self-esteem and depres- Radloff, L.S. 1977. The CES-D scale: A self-report depres-
sion. Psychological medicine, 16(4), 813-831. sion scale for research in the general population. Applied
Psychological Measurement 1: 385-401.
Cloninger, C. R.; Svrakic, D. M.; & Przybeck, T. R. 2006.
Can personality assessment predict future depression? A Ramirez-Esparza, N.; Chung, C. K.; Kacewicz, E.; &
twelve-month follow-up of 631 subjects. Journal of affec- Pennebaker, J. W. 2008. The psychology of word use in
tive disorders, 92, 35-44. depression forums in English and in Spanish: Testing two
text analytic approaches. In Proc. ICWSM 2008.
De Choudhury, M.; Mason, W. A.; Hofman, J. M.; &
Watts, D. J. 2010. Inferring relevant social networks from Robinson, M. S.; & Alloy, L. B. 2003. Negative cognitive
interpersonal communication. In Proc. WWW 2010. styles and stress-reactive rumination interact to predict de-
pression: A prospective study. Cognitive Therapy and Re-
De Choudhury, M.; Counts, S.; and Gamon, M. 2012. Not
search, 27(3), 275-291.
All Moods are Created Equal! Exploring Human Emotion-
al States in Social Media. In Proc. ICWSM ‘12. Rude, S. S.; Valdez, C. R.; Odom, S.; & Ebrahimi, A.
2003. Negative cognitive biases predict subsequent depres-
De Choudhury, M.; Counts, S.; & Horvitz, E. 2013. Pre-
sion. Cognitive Therapy and Research, 27(4), 415-429.
dicting Postpartum Changes in Behavior and Mood via So-
cial Media. In Proc. CHI 2013, to appear. Rude, S.; Gortner, E.; & Pennebaker, J. 2004. Language
use of depressed and depression-vulnerable college stu-
Detels, R. 2009.The scope and concerns of public health.
dents. Cognition and Emotion, 1121-1133.
Oxford University Press.
Sadilek, A.; Kautz, H.; & Silenzio, V. 2012. Modeling
Duda, Richard O.; Hart, Peter E.; & Stork, David G. 2000.
Spread of Disease from Social Interactions. In Proc.
Pattern Classification. 2nd Edition, Wiley.
ICSWM ’11.
Kawachi, I.; and Berkman, L. S. 2001. Social ties and men-
Snow, R.; O’Connor, B.; Jurafsky, D.; & Ng, A. Y. 2008.
tal health. Journal of Urban Health, 78(3), 458-467.
Cheap and fast—But is it good?: Evaluating non-expert
Kessler, R.C.; Berglund, P.; Demler, O. et al. 2003. The annotations for natural language tasks. In Proc.
Epidemiology of Major Depressive Disorder: Results from EMNLP’08.
the National Comorbidity Survey Replication. Journal of
World Health Organization. 2001. The world health report
the American Medical Association 289 (23): 3095-3105.
200—Mental Health: New Understanding, New Hope.
137You can also read