China in Latin America: Lessons for South-South Cooperation and Sustainable Development
←
→
Page content transcription
If your browser does not render page correctly, please read the page content below
Global Economic Governance Initiative

China in Latin America:
Lessons for South-South Cooperation and Sustainable Development

   Rebecca Ray
   Kevin P. Gallagher
   Andres Lopez
   Cynthia Sanborn
Boston University’s Global Economic Governance Initiative (GEGI) is a research program of the
                        Frederick S. Pardee School of Global Studies, the Frederick S. Pardee Center for the Study of the
Global Economic         Longer-Range Future, and the Center for Finance, Law & Policy. GEGI was founded in 2008 to
Governance Initiative   advance policy-relevant knowledge about governance for financial stability, human development,
                        and the environment. www.bu.edu/gegi

                        The Center for Transformation Research (CENIT) is a private foundation created in 1990 that
                        analyzes the possibilities and alternatives of economic and social transformation in Argentina
                        and Latin America. CENIT’s research generates valuable lessons for the adoption of policies and
                        strategies aimed at promoting structural change with a view of fostering sustainable and inclusive
                        economic growth based on knowledge and innovation. www.fund-cenit.org.ar

                        The Research Center of the University of the Pacific (CIUP) was founded in 1972 as an
                        interdepartmental, interdisciplinary center involving university faculty and associate scholars and
                        policy analysts. Its mission is to support the development and democratization of Peru, within a
                        diverse and increasingly interconnected global context. It does so through applied research on key
                        challenges facing this country and the region, incidence in public debates and public policymaking,
                        and the training of professionals and leaders with a vocation for excellence and social responsibility.
                        www.up.edu.pe/ciup

                        The Global Development And Environment Institute (GDAE) is a research institute at Tufts
                        University dedicated to promoting a better understanding of how societies can pursue their
                        economic and community goals in an environmentally and socially sustainable manner. GDAE
                        pursues its mission through original research, policy work, publication projects, curriculum
                        development, conferences and other activities. www.gdae.org

                        ©2015 Boston University, Centro de Investigación para la Transformación, Tufts University, and
                        Universidad del Pacífico.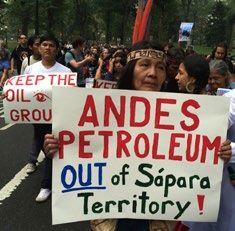
Table of Contents
                          		page

                          Section 1    Executive Summary                                                                2
                          Section 2 China as a Driver of Social and Environmental Change in Latin America              4
                                       2.1   Employment Creation                                                        6
                                       2.2   Environmental Impacts                                                      7
                                       2.3   Rising to the Challenge: Social and Environmental Safeguard Innovations   11
                                       2.4   Progress under Fire: Challenges to Existing Protections                   11
                          Section 3 The Performance of Chinese Investors in Latin America                              12
                                       3.1   Incentives from Home: the Role of Lender Oversight                        13
                                       3.2   The Importance of Community Engagement                                    15
                                       3.3   Government-Firm Relations: the Importance of Outreach and Learning        18
                          Section 4 Lessons for Policy                                                                 20
                                       4.1   Latin American Governments                                                20
                                       4.2 China and Chinese Investors                                                 21
                                       4.3 Civil Society                                                               22
                          References			                                                                                23
                          Acknowledgements                                                                             25

                          Tables and Figures
                          Figure 1:    China’s Share of LAC Exports, by Sector                                         4
                          Figure 2:    Agricultural and Extractive Exports as a share of LAC GDP, by Market            4
                          Figure 3:    LAC Export Basket Composition, by Market                                         5
                          Figure 4:    Sector Distribution of FDI Inflows to LAC, 2008-2012                             6
                          Figure 5:    Jobs Supported by Overall LAC Economic Activity and Exports                      7
                          Figure 6:    Environmental Impact of Overall LAC Economic Activity and Exports                7
                          Figure 7:    LAC “Balance of Payments” in Water with China                                    8
                          Figure 8:    LAC “Balance of Payments” in Greenhouse Gas Emissions with China                 9
                          Figure 9:    High Biodiversity Areas, Indigenous Territory, and Chinese Investment           10
                          Figure 10: Bolivia: Biodiversity Hotspot, Indigenous Territory, and Chinese Mines            15
                          Figure 11:   Peru: Biodiversity Hotspot, Indigenous Territory, and Chinese Mines             16
                          Figure 12: Chinese Oil Concessions, Biodiversity, and Indigenous Territory, Ecuador          18

                          Image 1:     Tacobamba, Bolivia Residents Rejected the Presence of a Processing Plant        16
                          Image 2:     Morococha (left) and Nueva Morococha (right), Peru                              17
                          Image 3:     Kichwa and Sápara Leaders Protest Andes Petroleum in New York City, 2014        19

                          Table 1:     Chinese Investors Profiled in Case Studies                                      12
                          Table 2:     Chinese and Multilateral Regulations Compared                                   14

China in Latin America The Social and Environmental Dimension     |    bu.edu/gegi   |    04/2015                           1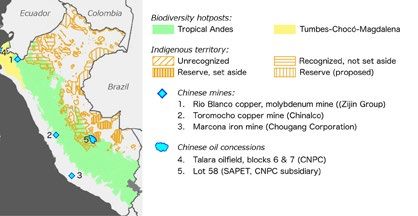
Section 1: EXECUTIVE SUMMARY
                      Latin America’s recent commodity boom accentuated environmental degradation and social conflict across
                      the Americas. The Latin American commodity boom was largely driven by new trade and investment
                      with China, and concentrated in the petroleum, mineral extraction, and agricultural sectors — sectors
                      endemic to environmental degradation and often the source of social conflict over rights and working
                      conditions. Though with some notable exceptions, Latin American governments fell short of mitigating the
                      social and environmental costs of trade and investment of the China-led commodity boom. While China
                      should not be blamed for the bulk of Latin America’s environmental and social problems, as China ‘goes
                      global’ it is important to mitigate the social and environmental impacts of its global activities in order to
                      maintain good relations with host countries and to reduce the potential risks associated with overseas
                      investment. Although some Chinese firms have demonstrated an ability to adhere to best practices in the
                      social and environmental arena, by and large and Chinese firms operating in Latin America thus far lack
                      the experience or policies in place to lessen the impacts of their investments in the region. As the Latin
                      American economies slow down there is increasing pressure on governments to ‘streamline’ approvals
                      for the relatively few opportunities for Chinese trade and investment, and to dampen the voice of civil
                      society organizations working to hold governments and foreign firms accountable for their actions. It is in
                      the interests of the Latin American and Chinese governments, as well as Chinese firms, to put in place the
                      proper social and environmental policies in order to maximize the benefits and mitigate the risks of China’s
                      economic activity in Latin America.

                      These are the findings of the Working Group on Development and Environment in the Americas, a
                      multi-university effort coordinated by the Center for Transformation Research (CENIT) in Argentina,
                      the Research Center of the University of the Pacific (CIUP) in Peru, Boston University’s Global Economic
                      Governance Initiative (GEGI), and Tufts University’s Global Development and Environment Institute
                      (GDAE). Comprised of eight country studies conducted by university-based researchers from across
                      the hemisphere, the study asked two research questions. First, to what extent has China independently
                      driven environmental and social change in Latin America? Secondly, to what extent do Chinese firms
                      perform differently from their domestic and foreign counterparts when they invest in Latin America?

                      From the country case studies and our own aggregate analysis we find that Chinese trade and investment
                      in Latin America since the turn of the 21st century was a major driver of environmental degradation in
                      the region, and was also a source of significant social conflict:
                      •   L atin American exports to China, as well as Chinese investment in the region, have been much more
                           concentrated in primary commodities — especially extractive commodities — than Latin American
                           economic relations with the rest of the world.
                      •    rimary-sector exports and investment — especially in extractive commodities — support far fewer
                          P
                          jobs than manufactured or agricultural exports. As a result, Latin America’s exports to China support
                          about 20% fewer jobs per US$1 million than the region’s overall exports. As China continues to grow as
                          a share of Latin American exports, this will necessarily drive down the employment benefits of exports
                          overall.
                      •   L atin American exports to China are responsible for using about twice as much water and emit
                           upwards of 12 percent more net greenhouse gas emissions per dollar, compared to overall exports.
                           Furthermore, the Chinese-financed infrastructure investments (like dams and railways to get the
                           products to port) pose extremely serious threats for deforestation in some of South America’s most
                           biodiverse areas.

                      That said, we find some cases of best practices in responding to these risks by Chinese investors, Latin
                      American governments, and civil society that can be built upon:

China in Latin America The Social and Environmental Dimension    |    bu.edu/gegi    |    04/2015                                2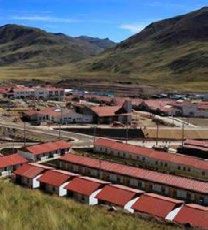
•   L atin American governments have set and enforced social and environmental standards, and
                           elicited compliance from Chinese firms and firms exporting to China. For example, Ecuador’s labor
                           law requires foreign oil companies to hire local workers and eliminates disparity between direct and
                           subcontracted workers. Together, these laws address the most common sources of labor conflict for
                           Chinese investors in our case studies. Peru has become a regional leader in transparency, joining the
                           Extractive Industries Transparency Initiative (requiring detailed, online reporting of revenue flows
                           between governments and extractive companies) and working with Chinese investors so that they,
                           too, join this effort.
                      •    hina has developed important new guidelines for outbound investors, including environmental
                          C
                          and social safeguards. However, these guidelines are still lacking relative to their counterparts in the
                          world economy, especially in terms of transparency and enforcement.
                      •    e find some cases where Chinese companies have exceeded local standards and outperformed
                          W
                          their peers, in case studies including Andes Petroleum in Ecuador, Chinalco in Peru, and Golden
                          Dragon Afilliates in Mexico.
                      •   L atin American civil society has proven itself capable of holding governments and companies
                           accountable. Non-governmental organizations (NGOs) have organized, demanded safeguards and
                           oversight mechanisms, and mounted global campaigns against the most symbolic cases to create
                           awareness and hold actors accountable.
                      •    GOs, academia, and other civil society actors have begun collaborating with governments and
                          N
                          Chinese firms to learn from experience and prevent (or mitigate) conflicts.

                      Major challenges still exist, and are likely to become more acute as the initial surge of Chinese
                      investment ebbs, commodity prices fall, and Latin American governments have less bargaining power
                      over conditions for future investments. Specifically, we find:
                      •   L atin American governments face pressure to relax existing environmental and social protections,
                           as mining and hydrocarbons ministries have become more powerful during this boom. In order to
                           preserve the progress they have made, they will need to resist demands for deregulation.
                      •    hina’s social and environmental safeguards for outbound investment are groundbreaking for a
                          C
                          middle-income country, but they lack important enforcement power and transparency. They could be
                          greatly enhanced through including formal reporting and grievance mechanisms, which would allow
                          Latin American governments and civil society to assist in the difficult task of managing investment
                          abroad.
                      •    hinese investors show an ability to exceed local standards, but their performance varies widely
                          C
                          across different regulatory regimes and between more experienced and newer firms. There is an
                          important role for Latin American governments and civil society to raise the performance level
                          across the board, through holding firms accountable and facilitating learning between firms.
                      •   L atin American civil society groups are responsible for many of the recent policy advances in the
                           region. Like Latin American governments, they will need to hold the line against pressure to erode
                           these protections. Furthermore, there is tremendous room for them to work constructively with the
                           Chinese government to enhance oversight of investors. But to do so they will first need to establish
                           constructive working relationships with Chinese and Latin American governments. For that, they
                           need to develop stronger local and transnational networks, gain greater influence in national policy
                           debates, and work constructively with governments where there are opportunities to do so.

                      China has pledged to invest upwards of $250 billion in Latin America over a decade. Governments,
                      companies, and civil society will need to work hard to ensure that such investment brings profits
                      while also raising living standards and protecting the environment.

China in Latin America The Social and Environmental Dimension    |    bu.edu/gegi    |    04/2015                               3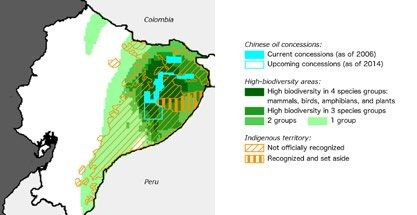
Section 2: CHINA AS A DRIVER OF SOCIAL AND
                                  ENVIRONMENTAL CHANGE IN LATIN AMERICA
                                  China has recently grown into a major export destination for the LAC region, second only to the United
                                  States. In 1993, China consumed less than 2% of LAC exports, but by 2013 it accounted for 9%.
                                  However, that importance was quite uneven across different export sectors. As Figure 1 shows, over
                                  the last decade China has tripled its market share of total LAC exports, more than tripled its share of
                                  extractive exports, and doubled its share of agricultural exports. But its demand for manufactured LAC
                                  exports has barely moved, staying at about 2% of LAC’s manufactured exports.

                                  FIGURE 1: China’s Share of LAC Exports, by Sector
                                                                                                                                                                             15%
                                                                   16%                                                                                                       15%
                          China Share of LAC Exports, by Sector

                                                                                                                                                           Extraction
                                                                   12%
                                                                                                                                                           Agriculture

                                                                                                                        7%                                                   9%
                                                                   8%
                                                                                                                                                           Total Exports

                                                                                                                       4%
                                                                   4%
                                                                                                                        3%
                                                                                                                        2%                                 Manufacturing 2%
                                                                    0
                                                                         1993             1998                         2003                     2008                       2013

                                  Source: Authors’ calculations based on UN Comtrade data.

                                  FIGURE 2: Agricultural and Extractive Exports as a share of LAC GDP, by Market
                                                                   4%                                                   7%
                         Share of LAC GDP Represented by Exports

                                                                           AGRICULTURE                                             EXTRACTION
                                                                                                                        6%
                                                                   3%
                                                                                            Exports to R.o.W.           5%
                                                                                                                                                       Exports to R.o.W.
                                                                                                                        4%
                                                                   2%
                                                                                                                        3%

                                                                                                                        2%
                                                                   1%
                                                                                            Exports to China                                           Exports to China
                                                                                                                        1%

                                                                    0                                                    0
                                                                         1993            2003                   2013             1993            2003                      2013

                                  Source: Authors’ calculations based in UN Comtrade and IMF data.

China in Latin America The Social and Environmental Dimension                                      |     bu.edu/gegi         |      04/2015                                  4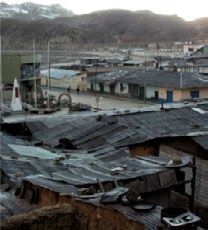
In fact, China has been an important driver in the expansion of LAC export of agriculture and
extraction. As Figure 2 shows, while agricultural and extractive exports to China from LAC have been
rising as a share of GDP, those exports to the rest of the world have been stagnant or even falling
overall for the last decade. Not only did Latin America’s extractive and agricultural sectors boom due
2% 2% 7%
12% to China’s demand, but Chinese demand also played a role in increasing the general price level of
20%
major commodities during2% the period, significantly increasing the terms
6% of trade across the Americas.
17% 18% 22%
31% 1% 7% 16% Agriculture
1%
As a result, LAC exports to China have become increasingly concentrated
36% 8% in extraction and
56% 29% 44% 19% 69% Extraction
47% 46% agriculture. As49%
Figure 3 shows, from 1999 to 2003, LAC
77% exports to China were fairly balanced
58%
between the three major sectors,
22%but a decade later they 85% Manufacturing
were dramatically different, with extraction
25%
accounting for over half9 of all LAC-China
31% exports. They were9 –vastly different from overallOther LAC
19
19
19
9– –2
9
9
9
2003 003 2003
0
04 exports, which are 0fairly
04 balanced despite the growth of0extractive
04 goods. Nor do they reflect the
2
2
2
–2 0 – 0 33% –2 0
20 08 overall 0 0 of 2Chinese
composition 08 2 imports, which manufactured
20 0goods
8 dominate. But this increasing
09 9– 09
–2 2 –2
013 concentration in extractive
0 13 goods does reflect China’s increasing
013 thirst for minerals, which rose from
8% to 22% of its imports over the same time period.
LAC Exports to China All LAC Exports All China Imports
FIGURE 3: LAC Export Basket Composition, by Market
2% 2% 7%
12%
20%
2% 6%
17% 18% 22%
31% 1% 7% 16% Agriculture
1%
36% 8%
56% 29% 44% 19% 69% Extraction
47% 46% 77%
49%
58% 85% Manufacturing
25% 22%
Other
19
19
19
9– 9– 31% 9–
9
9
9
2003 2003 2003
0 0 0
04 04 04
2
2
2
–2 0 –2 0 33% –2 0
20 08 00 08 20 08
2
09 9– 09
–2 20 –2
013 13 013
LAC Exports to China All LAC Exports All China Imports
Source: Authors’ calculations based on UN Comtrade data.
2% 2% 7%
12%
Chinese investment in LAC 2%
has been20%similarly concentrated in primary sectors. Figures 4 shows the
6%
17% sector distribution of FDI inflows18%from mergers and acquisitions (M&As) and 22%greenfield projects,
31% 1% 7% 16% Agriculture
1%
respectively. Most Chinese direct investment into LAC has been through
36% 8% M&As, and over four-fifths
56% 44% 19% 69%
47%
29% 46% of this investment
49%
has been in extraction, with 70%77% in oil and gas. In contrast, only 15% Extraction
of overall
58% 85% Manufacturing
M&A inflows to the region have22% been in that sector. Among greenfield FDI (GFDI) projects, China’s
25%
difference is most visible in agriculture. Food and tobacco comprise a quarter of ChineseOther into
GFDI
19
19
19
9– 9– 31% 9–
9
9
9
2003 2003 2003
0
04 LAC, but only 4% of 0 overall GFDI inflows.
0 0
0
2
2
2
–2 0 4– 4–
20 08 00 200 33% 20 200
8 8
2
09 9– 09
–2 20 –2
013 13 013
LAC Exports to China All LAC Exports All China Imports
China in Latin America The Social and Environmental Dimension | bu.edu/gegi | 04/2015 5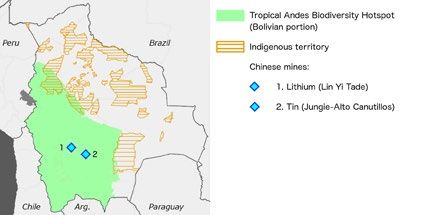
FIGURE 4: Sector Distribution of FDI inflows to LAC, 2008-2012

                     M&A Inflows                                                    GFDI Inflows
100%           4%                                                                                    4%                     Food, Beverage, Tobacco
                                      10%
                                                                         24%                                                Extraction
                                                                                                     31%                    Manufacturing
                                      27%
 75
                                                                                                                            Services
                                       6%                                30%                                                Other

               83%                                                                                   27%
 50

                                      49%                                 26%
 25                                                                                                  29%

               2%                                                         18%
                     9%                                                                               9%
               2%                      8%                                     1%
  0
       Inflows from China         All Inflows                    Inflows from China              All Inflows
            (US $31b)             (US $731b)                           ($24b)                     ($512b)

                          Source: Authors’ calculations using DeaLogic (M&As), fDIMarkets (GFDI) data. Note: food, beverages, and tobacco includes
                          food product production. Extraction includes oil, natural gas, mining, and basic metal processing. Percentages may not add to
                          100 due to rounding.

                          2.1 Employment Creation
                          Exports to China support fewer jobs than Latin America’s exports to the rest of the world. Because
                          the LAC-China export basket is so different from overall LAC exports, the employment impact of
                          LAC-China exports are also different. Specifically, because of the heavy concentration in extractive
                          industries, LAC exports to China support fewer jobs per $1 million USD. Figure 5 shows the labor
                          intensity of LAC overall economic activity, exports, and specifically LAC exports to China. Over the
                          last decade, total economic activity has supported far more jobs than exports. This is largely due
                          to the extremely labor-intensive nature of peasant agriculture, which is pervasive in the region but
                          absent from production for export. Total exports support fewer jobs, but the labor intensity has
                          remained fairly stable: falling from 59 to 56 jobs per US$1 million. Exports to China, however, have
                          fallen by over a third in the number of jobs they support for every US$1 million: from nearly 70 in
                          2002 to fewer than 45 in 2012.1

China in Latin America The Social and Environmental Dimension             |        bu.edu/gegi   |     04/2015                                       6
FIGURE 5: Jobs Supported by Overall LAC Economic Activity and Exports
150
126 126 All Economic Activity
124 121
Jobs per $1 Million Real (2002) USD
118
125 114 113 115 112 110 109
100
67 68 68 67 All Exports
75 65
60 57 56
54 53 54
59 59 63 60 60 57
50 53
47 44 47 44
Exports to China
25
0
2002 2003 2004 2005 2006 2007 2008 2009 2010 2011 2012
Source: Ray (2015a, forthcoming).
2.2 Environmental Impacts
LAC exports to China are also more environmentally sensitive than LAC exports to the rest of the
world. Exports to China are more carbon intensive, more water intensive, and often located in highly
biodiverse areas inhabited by indigenous peoples. The disproportionate, and growing, concentration
in extractive and agricultural products of LAC exports to China give them a distinctly different
environmental footprint than other exports. This section looks more closely at two environmental
impacts, one global (net greenhouse gas emission) and one local (water use).
FIGURE 6: Environmental Impact of Overall LAC Economic Activity and Exports
3.5 3.3
GHG Intensity (kg CO2 equivalent per USD)
3.0
Water Intensity (cubic meters of H2O per USD)
2.5
1.9
2.0
1.7 1.6
1.5
1.1
1.0
0.5 0.3
0.0
Total Economic Activity All LAC Exports LAC Exports to China
Sources: Ray (2015b, forthcoming).
China in Latin America The Social and Environmental Dimension | bu.edu/gegi | 04/2015 7As Figure 6 shows, LAC-China exports cause more net greenhouse gas (GHG) emissions and use
more water per dollar of output than other exports, and much more than overall economic activity.
The data in Figure 6 are from 2004, the last year of directly-measured data on each indicator.
However, as Figures 2 shows, LAC exports to China have continued to become more and more
concentrated in a few sectors since that time. Figure 7 applies the 2004 intensities to the changing
trade basket composition to create a water “balance of payments” between China and LAC. It shows
a positive balance of 100.4 billion cubic meters of water in 2012, meaning that LAC sent China much
more water in its exports than what was embedded in imports. For reference, the volume of Lake
Nicaragua is approximately 108 billion cubic meters. In other words, if LAC had not traded with
China in 2012 (by producing domestically everything it imported from China, and consuming locally
everything it exported to China), it would have saved roughly 90% of the volume of Lake Nicaragua.
This has major ramifications not only environmentally but also socially, as the case studies in this
project show that competition for water is a frequent source of social conflict between communities
practicing peasant agriculture or small-scale ranching and large-scale plantations and mines.
FIGURE 7: LAC “Balance of Payments” in Water with China
200
Water embedded in LAC exports to China 181
169 166
175
150 133 130
124
125 109
Water “balance of payments” with China
95 100
87 91
100 83 103
76 77 79
69 73
75 59 56 76 81
45
66
50 30 51
45 44
36 Water embedded in LAC imports from China
25 26
15 16 22
0
2002 2003 2004 2005 2006 2007 2008 2009 2010 2011 2012
Source: Ray (2015b, forthcoming).
Figure
300 8 shows a similar environmental “balance of payments,” but forin GHG
GHG embedded emissions.
LAC imports LAC exports
from China
to China are responsible for far fewer GHG emissions than Chinese exports to LAC. Of course, 241 the
250
impacts of GHG emissions are global rather than local. It makes little difference to216
climate change
187
200
whether those emissions originate from LAC or from China. However, the scale is still very interesting.
As much as LAC exports to China (and their embedded147 GHG emission) GHG haveembedded
risen in the last decade,
in LAC
150 124 125
the GHG emissions embedded in LAC imports
98 from China have risen at exports
an eventofaster
China pace.
100 71 115
60 92 100
41 45 86
50 59 67
42 45 51
25 36
0
GHG “balance of payments” with China
–16 –9 –19
-50 –27
–47 –39
–64
-100 –81
–95
China in Latin America The –115
-150Social and Environmental Dimension | bu.edu/gegi | 04/2015 –126 8
2002 2003 2004 2005 2006 2007 2008 2009 2010 2011 2012FIGURE 8: LAC “Balance of Payments” in Greenhouse Gas Emissions with China
300 GHG embedded in LAC imports from China
241
250 216
187
200
147
150 124 125 GHG embedded in LAC
98 exports to China
100 71 115
60 92 100
41 45 86
50 59 67
42 45 51
25 36
0
GHG “balance of payments” with China
–16 –9 –19
-50 –27
–47 –39
–64
-100 –81
–95
–115
-150 –126
2002 2003 2004 2005 2006 2007 2008 2009 2010 2011 2012
Source: Ray (2015b, forthcoming).
Chile, China, and Solar Panels Sometimes, the environmental impact of the LAC-China relationship can be felt more
acutely on the import rather than export side. This is the case in Chile, where imports of Chinese photovoltaic (PV)
panels have had a major impact on greening the Chilean energy matrix. In the mid-2000s, Chile lost its main source of
low-emissions energy when Argentina restricted its exports of natural gas and eventually closed its pipeline to Chile
altogether. But China was experiencing a major oversupply of PV panels at the same time. The concurrence of these
two events gave Chile an opening to rapidly expand its use of solar power. In 2013, Chile imported US$40.9 million
in Chinese PV panels, more than half of its total PV imports. While solar power is still a small share of total energy
generation in the country, it is poised to expand rapidly: over half of the 10,000 megawats of new power projects with
approved environmental are solar (Borregaard et al. 2015).
In terms of deforestation, Figures 6 and 8 actually understate the GHG emissions from LAC’s
relationship with China, because while they account for deforestation directly linked to exports, they
do not account for the most important cause of deforestation: roads, canals and railroads to get
those products to ports. Research by Philip Fearnside (the author of the Brazil case study in this
project) and others (2013) show that access roads are the most important cause of Amazonian
deforestation, as they open the forest to human settlements and interrupt animal migration patterns.
Thus, in order to adequately account for the GHG impact of the “China boom” in Latin America, it is
important to include not just exports to China but also Chinese-financed roads, canals, and railroads
designed to get those products to ports, as well as dams to provide power to mines and oil fields.
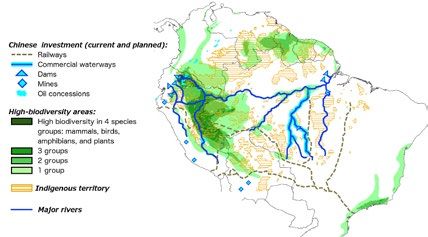
Figure 9 shows South America’s most biodiverse areas and indigenous territories, with Chinese-
financed infrastructure and Chinese FDI projects added. The biodiversity of these areas is reflected
in the various shades of green: the darkest green patches (present only in eastern Ecuador and the
northern extreme of Peru) represent areas with the highest biodiversity in four different groups of
species: mammals, birds, amphibians, and plants. The second-darkest shade of green, present near
the border of Peru and Brazil, indicates areas with the highest biodiversity in three of the four species
groups, and so forth. Indigenous territories are reflected in the various tan patterns.
China in Latin America The Social and Environmental Dimension | bu.edu/gegi | 04/2015 9As Figure 9 shows, two major Chinese investments may pose serious risks to highly biodiverse
areas and indigenous territories: the western half of the transcontinental railway and oil fields in
eastern Ecuador. The transcontinental railway is still in its planning stage, so it does not yet have a
finalized path. Two possibilities exist for the route of its western end: one through Piura in northern
Peru and another through Puno in southern Peru. The northern route crosses into Brazil through an
area with extremely high biodiversity in three out of the four species groups shown here (mammals,
birds, amphibians, and plants), shown in dark green in Figure 9. The southern route largely avoids
this environmentally sensitive region. The final choice of route for this railway will be crucial in
determining its environmental impact.
Figure 9: High Biodiversity Areas, Indigenous Territory, and Chinese Investment
Source: Compiled from Bass et al. (2010), Cruz Fiestas (2014), Fearnside and Figeiredo (2015), International Rivers et al.,
Ministério dos Transportes (2009), Ministerio de Transportes y Comunicaciones, and Red Amazónica de Información
Socioambiental Georreferencial.
Note: Mines and some oil concessions are already in operation. Railway locations are approximate, as most plans are not
yet final. High biodiversity is defined as the top 6.4% of South American land area for species richness. Indigenous territory
includes lands with and without official state recognition.
The other major Chinese investment in a highly biodiverse area is oil development in eastern
Ecuador, much of which also occupies traditional indigenous territory. The southernmost two
Chinese oil concessions in Ecuador are new and their contracts have not yet been finalized. If these
concessions do in fact go through, the terms of their contracts will be extremely important for both
their social and environmental impacts.
China in Latin America The Social and Environmental Dimension | bu.edu/gegi | 04/2015 102.3 Rising to the Challenge: Social and Environmental Safeguard
Innovations
In the face of this tremendous growth in sectors intrinsically linked to high environmental impacts
and risks for social conflicts, we find that several Latin American countries have developed
important policy responses to minimize these risks. Three of the most innovative of these responses
are Brazil’s new environmental oversight measures, Ecuador’s new labor standards, and Peru’s
transparency measures and indigenous protections.
Brazil dramatically enhanced the enforcement power of its environmental regulations in 2008,
without changing current environmental laws themselves. Instead, Brazil’s Central Bank changed
its rules to no longer allow public bank loans to operations with unpaid fines for environmental
irregularities reported by government agencies. Public-agency fines for environmental violations can
be postponed through appeals, but this more proactive approach has immediate effect.
Ecuador enacted a series of labor protections in 2008 and 2010 that form one of the most
progressive packages of labor protection in the region for the Ecuadorean petroleum sector. In 2008,
Ecuador strictly curtailed the use of subcontracted labor, limiting it to “complimentary” work such
as security and custodial services. The 2010 Hydrocarbon Law further boosted labor protections in
the oil and gas sector, by requiring foreign investors to hire Ecuadorean workers for 95% of unskilled
and 90% of skilled jobs. Moreover, it required profit sharing with all employees, including contract
workers. Taken together, these laws eliminated two of the most important sources of labor conflicts
facing Chinese (and other international) investment projects across the LAC region: the use of
foreign laborers and differences in the labor conditions between directly-hired and subcontracted
employees working at the same project.
Peru has made important strides in transparency and indigenous rights over the last decade. Peru
joined the Extractive Industries Transparency Initiative (EITI) in 2007 and in 2011 became the first
country in the Americas to be declared compliant within that framework. Also in 2011 it became the
first LAC country to enact legislation to implement ILO Convention 169, which grants indigenous
communities the right to prior consultation on any state policies that directly affect them, including
concessions and permits for extractive projects within their traditional territories. To comply with
its EITI commitments, the Peruvian government and participating companies publish detailed
reports of revenue flows related to the extractive industries, available online for concerned citizens
and civil society. Furthermore, the Peruvian government assigned staff from the Ministry of Energy
and Mining to the EITI process, including working with non-participating companies to encourage
participation. Starting in 2014, three Chinese companies confirmed their involvement in the process:
Shougang, China MinMetals and CNPC. These two measures put Peru in a leadership position
regionally for public participation in the resource boom.
2.4 Progress Under Fire: Challenges to Existing Protections
The LAC-China export boom has been supported by high world prices for the commodities involved,
which has boosted the value of minerals reserves and increased bargaining power for countries
interested in enacting social and environmental standards for their use. However, the same
phenomenon has boosted the power of sectors associated with the boom, which have incentives to
resist these standards.
Within governments, the extractive boom has prioritized mining and hydrocarbons ministries, as
executive branches face pressure to speed up the process of beginning new investment projects. To
China in Latin America The Social and Environmental Dimension | bu.edu/gegi | 04/2015 11that end, Peru has recently curtailed the authority of the Environment Ministry over the approval
and supervision of extractive projects. The objective is to streamline the process of getting new
extractive investments under way and accelerate production in the face of flagging world prices,
but this change has not incorporated safeguards to prevent conflicts of interest from corrupting the
process and diminishing the power of environmental oversight (Saravia López and Rua Quiroga,
2015; Sanborn and Chonn, 2015).
In Brazil, the China boom has also had major impact on the agricultural sector. There, Chinese
demand has enriched and empowered the “ruralist” voting block, representing large landholders
in Congress. This newly strengthened voting block has exerted powerful influence on the current
administration’s environmental stances (Santilli, 2014; Smeraldi, 2014). For example, it has
mounted an effort to roll back the new Central Bank rules cited above, which have proven useful in
strengthening enforcement of environmental safeguards.
Section 3: THE PERFORMANCE OF CHINESE
INVESTORS IN LATIN AMERICA
Our research shows that Chinese firms do not perform significantly worse relative to domestic or
other international firms. In fact, despite relatively weaker levels of regulation at home in China, and a
fledgling set of guidelines for overseas companies, our case studies found some instances of Chinese
firms outperforming their competitors, especially with proper incentives from governments and
civil society. Table 1 lists the Chinese firms associated with each case study and the members of the
Working Group that performed the case studies (with the exception of Brazil and Chile, where the case
studies involved Brazilian firms exporting to China and Chilean imports from China, respectively). This
section explores lessons from each of these case studies. Overall, they show that Chinese firms are
Table 1: Chinese Investors Profiled in Case Studies
Country Authors Sector Firms
Argentina Andrés López, Julian Donaubauer, Daniela Ramos, Petroleum China National Offshore Oil Corporation
Center for Transformation Research, (CNOOC) and China Petroleum and
University of Buenos Aires Chemical Corporation (Sinopec)
Bolivia Alejandra Saravia López, Universidad Mayor de San Mining Jungie Mining
Simon-Cochabamba, Adam Rua Quiroga
Brazil Philip Fearnside, Instituto Nacional de Pesquisas da Agriculture Soy and Iron exports
Amazônia; Adriano M.R. Figueiredo, Universidade and mining
Federal de Mato Grosso do Sul
Chile Nicola Borregaard y Annie Dufey, Fundación Chile Energy (solar) Solar panels imports
Colombia Guillermo Rudas and Mauricio Cabrera Leal, Coal and Sinopec and Sinochem
Javeriana and Externado Universities of Colombia petroleum
Ecuador Rebecca Ray, Boston University; Adam Chimienti, Petroleum Sinopec and China National Petroleum
Institute of China Asia Pacific Studies, National Sun Corporation (CNPC)
Yat-sen University in Taiwan
Mexico Claudia Schatan, Diana Piloyan, Manufacturing Golden Dragon Affiliates
Universidad Iberoamericana
Peru Cynthia Sanborn and Victoria Chonn Ching, Mining Shougang, Aluminum Corporation of
Universidad del Pacífico China (Chinalco), and Zijin Mining Group
China in Latin America The Social and Environmental Dimension | bu.edu/gegi | 04/2015 12flexible, able to adapt to new environments and perform up to local standards. However, several of the
cases show that as these investments continue to expand, major challenges still lie ahead.
Among these Chinese firms is one that our case studies examine in three different Latin American
countries: Sinopec. The case studies show that Sinopec has had very different experiences under
different regulatory regimes and with different incentives. Sinopec’s labor relations in Argentina and
environmental performance in Ecuador have been more positive than either in Colombia.
• Sinopec’s labor challenges in Colombia have involved the local community action boards, which
are common in rural Colombia and control the hiring of oil workers. Allegations abound of
powerful local figures trading employment for favors or even fees, or unfairly favoring workers
from other areas over local workers, but the regional Labor Ministry officials state that these
complaints have not been formalized for fear of endangering the very employment positions
they involve. The Colombian national government is considering removing hiring authority from
community action boards, but the proposal faces vigorous opposition by the boards themselves,
unsurprisingly. In contrast, Sinopec faces no such issues in Argentina or Ecuador, because of the
regulatory framework in each country. In Argentina, Sinopec has signed an agreement with the
local government ensuring that all workers will have had residency in the Santa Cruz province
for at least two years prior to their hiring. In Ecuador, subcontracted labor is tightly regulated, as
discussed above.
• Environmentally, Sinopec has a better record in Ecuador than most of its competitors, with fewer
local protests over spills than most of its competitors, either foreign or domestic. This record is
partly due to the incentives it faces there: it bought oil concessions that were initially owned by
Chevron and therefore receive a great deal of attention. Sinopec’s ability to maintain a low profile
has been key to its ability to continue operations for nearly a decade. In contrast, the Comptroller
General of Colombia cited Sinopec in 2014 for never paying the US$500,000 investment in
conservation required by law and pledged in 2008. These two cases show the importance of
establishing — and enforcing — an effective regulatory framework for international investment.
Fortunately, Colombia appears to be taking this to heart, as its 2014 environmental finding and
the recent proposed change in labor regulation show.
Other positive outcomes in the case studies show that Chinese investors are capable of living up
to high standards, especially when the proper incentives are in place. These case studies show
the importance of cooperation between governments, investors, local communities, and Chinese
regulators in creating those incentives. Areas where this cooperation can be especially helpful
include oversight by lenders, community engagement at the outset of projects, and training investors
in compliance with local laws.
3.1 Incentives from Home: the role of lender oversight
China should be credited for enacting guidelines for its overseas economic activities. When
Western countries were at middle-income status such guidelines were not on government radar
screens. Other middle-income countries (like Brazil, discussed above) prevent public lending to
domestic projects with outstanding environmental fines, and multilateral lenders have long required
borrowers to meet environmental performance standards. But these kinds of standards for outbound
international investment sets China ahead of its middle-income country peers. Nonetheless, China is
a relative newcomer to international investment, and its environmental and social safeguards still lag
behind those of the traditional multilateral lenders.
China in Latin America The Social and Environmental Dimension | bu.edu/gegi | 04/2015 13There are three levels of safeguards for Chinese outbound investment. First, the Ministry of
Commerce (MOFCOM) has published voluntary “Guidelines for Environmental Protection in Foreign
Investment and Cooperation” for all investors, regardless of whether they are public or private, or
how they are financed. While these are not binding, they carry moral authority for state-owned
enterprises (Tao 2013). For projects that are bank-financed, China Banking Regulatory Commission
(CBRC) has set “Green Credit Guidelines” for all Chinese banks that finance investment projects
abroad, which include requiring investments to meet host country and international environmental
laws. Finally, the China Development Bank (CDB) and the Export-Import Bank of China (China Ex-
Im Bank), state-owned “policy banks” that fund overseas investments in the name of the Chinese
government, have developed safeguard practices for projects within their portfolios.
Table 2 compares Chinese guidelines to those of major multilateral lenders: the World Bank, the
International Finance Corporation, and the Inter-American Development Bank. While the Chinese
lenders and regulators have fewer requirements than the multilateral lenders, there is one notable
exception: only the Chinese policy banks require ex-post environmental impact assessments.
Table 2: Chinese and Multilateral Regulations Compared
Multilateral lenders Chinese banks and regulators
World Bank IFC IDB MOFCOM* CBRC CDB Ex-Im Bank
Ex-ante environmental impact X X X X X X
assessments
Project review of environmental X X X X X
impact assessments
Industry-specific social and X X
environmental standards
Require compliance with host X X X X X X
country environmental regulations
Require compliance with int’l X X
environmental regulations
Public consultations with affected X X X X X
communities
Grievance mechanism X X
Independent monitoring and review X
Establishing covenants linked to X X X X
compliance
Ex-post environmental impact X X
assessments
Note: *MOFCOM policies are voluntary in nature.
Source: CBRC 2012; Gallagher et al. 2012; Leung and Zhao 2013; State Forestry Administration 2010.
The regulations shown in Table 2 demonstrate a major step forward for Chinese lenders, but
those lenders still face steep challenges in enforcement. For example, without a grievance policy,
lenders may not know about violations of other requirements like compliance with international
environmental laws. Furthermore, even requiring compliance with host country law — arguably the
least challenging of the requirements in Table 2 to enforce — can be challenging if local governments
China in Latin America The Social and Environmental Dimension | bu.edu/gegi | 04/2015 14are not enforcing their own laws. For example, in the Sinopec case in Colombia discussed above, the
Comptroller General cited not only Sinopec but also the national environmental licensing agency,
for not enforcing its own regulations sufficiently. In a situation like that one, it is not clear that
MOFCOM has the grounds to claim that Sinopec is in violation of their guidelines. Latin American
civil society groups have begun educating communities about the Green Credit Directives and other
environmental and social safeguards attached to Chinese lending, but without a formal method for
receiving and investigating complaints, banks have little immediate incentive to follow up on any
communication they receive. Given the difficulty in policing investor behavior abroad, it could be
extremely helpful for Chinese lenders to approach Latin American civil society and governments as
partners in holding investors accountable to these guidelines, perhaps through introducing a formal
grievance mechanism.
3.2 The Importance of Community Engagement
Our case studies show that an investor’s willingness and ability to work with governments and
local communities from the outset is paramount for successful project completion. Three examples
highlight this lesson particularly well: the Toromocho copper mine owned by Chinalco in Peru, the
Jungie tin mine in Bolivia, and Andes Petroleum in Ecuador. Each case illustrates the importance of
government incentives and assistance in the negotiation process.
In Bolivia, China’s Jungie Mining and the local Alto Canutillos mining cooperative formed a joint
venture to mine tin in Tacobamba in 2010. While the mine does not appear in the extremely
biodiverse areas shown in Figure 9, it does lie within threatened land: the Tropical Andes Biodiversity
Hotspot.2 Figure 10 shows the Bolivian segment of the Tropical Andes Biodiversity Hotspot in green,
and indigenous territory in orange.
Figure 10: Bolivia: Biodiversity Hotspot, Indigenous Territory, and Chinese Mines
Source: Compiled from Red Amazónica de Información Socioambiental Georreferencial and Zador et al. 2015.
Note: Indigenous territory includes lands with and without official state recognition.
Before operations could begin, surveys showed that the local community was opposed to the
establishment of a processing plant and tailings dam in Tacobamba. In response, the state-owned
COMIBOL mining company donated land over 25 miles away for the facility, in Agua Dulce, Villa de
China in Latin America The Social and Environmental Dimension | bu.edu/gegi | 04/2015 15Yocalla, where a public consultation showed that the community accepted its presence. This move
took cooperation between the investors, the government, and the local community, and prevented a
major potential source of conflict (Saravia López and Rua Quiroga 2015).
Image 1: Tacobamba, Bolivia residents rejected the presence of a processing plant
… so COMIBOL donated land for the plant, over 25 miles away from the mine.
Source: Saravia López and Rua Quiroga (2015).
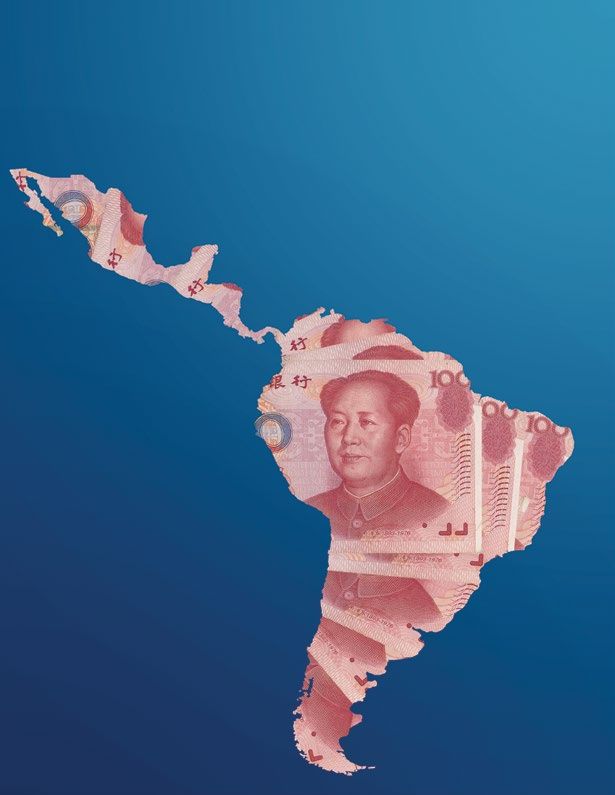
In Peru, Chinese SOE Chinalco’s Toromocho mine also borders the Tropical Andes Biodiversity
Hotspot, as Figure 11 shows.3
Figure 11: Peru: Biodiversity Hotspots, Indigenous Territory, and Chinese Mines
Source: Compiled from Red Amazónica de Información Socioambiental Georreferencial and Zador et al. 2015.
China in Latin America The Social and Environmental Dimension | bu.edu/gegi | 04/2015 16In 2007, Chinalco inherited a commitment to relocate the 5,000 residents of the existing city of
Morococha to make way for the mine construction. Morococha is a former mining camp and its
water and soil has been badly contaminated from decades of nearby mining operations. Prior to
Chinalco’s purchase of this project, the Peruvian government was expected to build a new town
for the residents, but Chinalco took on the obligation as part of the investment. While the old
Morococha had communal latrines and a limited water supply, “Nueva Morococha” promises a
modern water and sanitation system. Perhaps most importantly, the move was largely voluntary and
the product of dialogue and negotiation between community members, their elected authorities,
the central government and the investor — considered the first example of voluntary, participatory
community relocation in modern Peruvian history. While it has not been without problems (for
example, Chinalco offered each moving family a title to their new homes, but the municipality has
been delayed in issuing them) and their continue to be a number of holdouts, it represents a step
forward in Peruvian mining community relations (Sanborn and Chonn 2015).
Image 2: Morococha (left) and Nueva Morococha (right), Peru
Source: Ojos Propios, 2013 (left); Ministerio de Energía y Minas, 2013 (right).
The community consultation process has not gone so smoothly in Ecuador, where Andes Petroleum
(a joint venture between Chinese SOEs Sinopec and CNPC) won two new concessions in early 2014.
As shown Figure 9, Ecuador is the only South American country where major Chinese investments
exist in an area with extremely high biodiversity in four different species groups as well as traditional
indigenous territory (the map below shows this situation in more detail). So its respect for social
and environmental safeguards are especially important, perhaps more so than any other Chinese
investments in this project. Until now, Andes has had better community relations than most of its
competitors (including Ecuadorean SOEs), with fewer protests due to contamination or unfulfilled
social obligations. But its real challenge lies ahead, as its current expansion is beginning under
acrimonious conditions, without the proper community consultation.
China in Latin America The Social and Environmental Dimension | bu.edu/gegi | 04/2015 17Figure 12: Chinese Oil Concessions, Biodiversity, and Indigenous Territory, Ecuador
Source: Ray and Chimienti 2015.
Ecuadorean law requires the Secretary of Hydrocarbons (SHE) to seek majority approval within the
affected community, and in particular among the Sápara and Kichwa indigenous nations, whose
authority over developments in their traditional territory Ecuador enshrined when it signed onto ILO
Convention 169. However, SHE circumvented these obligations by getting the approval of the Sápara
president instead of seeking the majority approval of the Sápara and Kichwa communities. SHE also
opened temporary outreach offices in the affected area, and claims that 16,469 people participated
in workshops or submitted comments — a number equal to about one-fourth of the local adult
indigenous population, or about one-eight of the total adult population in the new concession blocks.
Sápara and Kichwa community leaders have responded by mounting an international struggle to
reclaim authority over their traditional lands and reject all oil development there. The possibilities for
Andes Petroleum to establish a positive relationship with the local community are extremely slim at
this point, because good-faith negotiations involving the government and the local community are
almost impossible. (Ray and Chimienti 2015).
3.3 Government-Firm Relations: the Importance of Outreach and Learning
Another important venue for cooperation between investors, governments, and civil society is in
training new arrivals on local environmental and social regulations, customs, and available local
resources. Recent examples in Peru, Argentina, and Mexico show that this is a promising area that
Latin American governments are just beginning to bring to explore.
In March 2014, Chinalco’s Toromocho mine project in Peru (noted above for its community
relocation process) suffered a major setback when the Organism for Environmental Evaluation and
Fiscalization (OEFA), within the Ministry of the Environment, ordered it to halt operations following a
leak of acid wastewater. The problem was generated by unexpectedly heavy rainfall, which Chinalco
had apparently not taken into account. After the cleanup, which happened in a period of a few days
after rapid action by regulators and Chinalco, the Association of Chinese Companies in Peru asked
the Environment Ministry to organize a series of conferences for all of their members about Peru’s
environmental regulations. This was an opportunity for the government to address environmental
China in Latin America The Social and Environmental Dimension | bu.edu/gegi | 04/2015 18Image 3: Kichwa and Sápara Leaders Protest concerns in a proactive way as well as to form working
Andes Petroleum in New York City, 2014 relationships with environmental safety personnel at the investing
firms, and to lay the groundwork for future cooperation.
Argentina is a unique case: negotiations over oil royalties and
environmental and social commitments happen at the provincial
level. This arrangement has important drawbacks, in that it
creates an incentive for provincial government negotiators
to treat short-term royalties and long-term environmental
commitments as tradeoffs. But it also creates an opportunity
for local civil society groups, which have much more access to
the negotiators than they would if negotiations happened at
the national level. This has allowed for small business groups
to successfully press for foreign oil companies to develop more
linkages with local suppliers. For example, Pan American Energy
(CNOOC’s joint entity with BP) has developed the “SMEs of Golfo
San Jorge” program to build capacity for local small businesses
and incorporate them into PAE’s supply chain. This kind of
cooperation requires the presence of the provincial government
Left: Leonardo Cerda, Kichwa leader; Center: Gloria officials to help recently arrived foreign investors connect with
Ushigua, President of the Association of Sápara Women; local organizations. Another important opportunity for training
People’s Climate March, New York, 21 September 2014. and capacity building in Argentina involves facilitating learning
between more experienced and more recent investors: in this
Source: Amazon Watch.
case, CNOOC and Sinopec. Our case study shows that CNOOC
has a better environmental record than Sinopec, partly because CNOOC partners with BP, which
has a long history of pursuing foreign investment and receiving global scrutiny for its environmental
record. Even though both CNOOC and Sinopec are Chinese SOEs, one benefits from its cooperation
with more experienced investors while the other does not. Argentina can help bridge these
differences by facilitating training for foreign investors, where new arrivals can learn from their more
experienced peers.
The Mexico case study is another situation where training may be very useful. Generally speaking,
the Golden Dragon copper tube manufacturing company has abided by environmental and labor
law, and has even introduced important new energy efficiency innovations. Nonetheless, it has run
into labor difficulty due to cultural barriers. One major obstacle springs from the fact that the firm’s
Chinese employees do not speak Spanish, the Mexican employees do not speak Chinese, and very
few members of either group of employees speak a common third language such as English. Another
important stumbling block has come from Chinese managers’ unfamiliarity with Mexican customs.
Chinese minimum wages are quite low, and workers compensate by working extremely long hours.
In contrast, Mexican workers tend to be less willing to work on weekends and holidays. Golden
Dragon has a history of requiring workers to work on those days, and not compensating them
appropriately for their overtime, largely because they are not accustomed to workers expecting that
time off. These cultural differences between Golden Dragon’s Chinese and Mexican workers are
unlikely to be resolved without being specifically addressed, because the two groups of workers do
not speak the same languages or socialize together. But they are the types of misunderstandings
that can be addressed rather straightforwardly with training to ensure that Mexican labor laws
protect workers and Chinese investors need to respect Mexican labor laws.
China in Latin America The Social and Environmental Dimension | bu.edu/gegi | 04/2015 19Section 4: LESSONS FOR POLICY
Our study has shown that the China-led commodity boom in Latin America has accentuated
environmental and social conflict in the region. Although Latin American governments, Chinese
firms, and civil society can be credited for some innovations during the China boom, by and large
the benefits of China-led trade and investment have come with significant environmental and social
costs. These costs can be reduced by concerted action by Latin American governments, the Chinese
government and Chinese firms, and by civil society in Latin America, China, and across the world.
4.1 Latin American Governments
For Latin America to truly benefit from this commodity-led growth, Latin American governments
will need to capture and invest more of the windfall into social and environmental protections.
Civil society organizations in the region will need to hold governments more accountable. Our
case studies found numerous examples of Latin American governments developing innovative
policy responses to the China boom. Ecuador’s labor laws, Bolivia’s implementation of community
consultation, and Peru’s leadership on transparency stand out as particularly important policy
steps. There is tremendous room for Latin American civil society groups to take advantage of these
examples to push for higher standards everywhere.
Chinese oil companies have shown in Ecuador that they are capable of operating with almost
entirely Ecuadorean staff. Bolivia has shown that it is possible for Chinese mining companies and
local SOEs to collaborate to honor communities’ decisions about where processing plants should —
and should not — be located. Peru has shown that Chinese mining and oil companies are capable
of reaching high levels of transparency. Latin American civil society and governments can push for
these standards to be adopted in countries that do not yet have them, knowing that these standards
are not only reasonable, but that Chinese investors are perfectly capable of reaching them.
This progress is being threatened, however, by the very sectors enriched by the China boom, such
as mining ministries and large landowner voting blocs. For example, regulatory reforms in Peru
are cutting back the Environment Ministry’s oversight of extractive projects, without putting in
place safeguards to prevent conflicts of interest in the approval process. In Brazil, the progress in
environmental law enforcement faces strong resistance from the “ruralist” landowner voting bloc
that has benefited so much from China’s demand for soy. Proposed labor law protections for oil
workers in Colombia may not go through because of pressure from the community action boards
that have been the target of so many abuse complaints. It is crucial for Latin American governments
to hold the line against these deregulation efforts. It is paramount that LAC governments strike a
better balance between short-term economic benefits and longer run economic and ecological
costs — even if that leads to the rejection of certain projects in the immediate future.
Specifically, we recommend that Latin American governments prioritize:
• Enforcement and upgrading of existing environmental and social protections.
• efend and strengthen the capacity of environmental and social ministries to enforce and upgrade
D
laws, such as with the Ombudsman program in Peru.
• Joining the Extractive Industries Transparency Initiative, and encouraging Chinese firms to participate.
• I mplementing ILO Convention 169 (which most Latin American governments have signed), by
enacting and enforcing requirements for prior consultation of indigenous peoples regarding state
policy measures that affect their interests and welfare.
•
Requiring foreign investors to hire local workers wherever possible, perhaps through quotas or
floors, and limiting the use of subcontracted labor.
China in Latin America The Social and Environmental Dimension | bu.edu/gegi | 04/2015 20You can also read