Chinese E-Romance: Analyzing and Visualizing 7.92 Mil- lion Alibaba Valentine's Day Purchases
←
→
Page content transcription
If your browser does not render page correctly, please read the page content below
Chinese E-Romance: Analyzing and Visualizing 7.92 Mil-
                                         lion Alibaba Valentine’s Day Purchases
                                         Yongzhen Wang1,* , Xiaozhong Liu2,* , Yingnan Ju3 , Katy Börner3 , Jun Lin4 , Chang-
                                         long Sun4 , Luo Si4

                                         1 WISE Lab, Institute of Science of Science and S&T Management, Faculty of Hu-
                                         manities and Social Sciences, Dalian University of Technology, Dalian 116024, China
                                         2 Computer Science Department, Worcester Polytechnic Institute, Worcester, MA
                                         01609, USA
                                         3 School of Informatics, Computing and Engineering, Indiana University, Bloom-
                                         ington, IN 47408, USA
arXiv:2002.03060v6 [cs.CY] 20 Aug 2021

                                         4 Alibaba DAMO Academy, Hangzhou 310030, China
                                         * yongzhenwang@dlut.edu.cn (YW) xliu14@wpi.edu (XL)

                                         Abstract: The days that precede Valentine’s Day are characterized by extensive gift
                                         shopping activities all across the globe. In China, where much shopping takes place
                                         online, there has been an explosive growth in e-commerce sales during Valentine’s
                                         Day over the recent years. This exploratory study investigates the extent to which each
                                         product category and each shopper group can exhibit romantic love within China’s e-
                                         market throughout the 2 weeks leading up to 2019 Valentine’s Day. Massive data from
                                         Alibaba, the biggest e-commerce retailer worldwide, are utilized to formulate an in-
                                         novative romance index (RI) to quantitatively measure e-romantic values for products
                                         and shoppers. On this basis, millions of shoppers, along with their millions of prod-
                                         ucts purchased around Valentine’s Day, are analyzed as a case study to demonstrate
                                         their love consumption and romantic gift-giving. The results of the analysis are then
                                         illustrated to help understand Chinese e-romance based on the perspectives of differ-
                                         ent product categories and shopper groups. This empirical information visualization
                                         also contributes to improving the segmentation, targeting, and positioning of China’s
                                         e-market for Valentine’s Day.

                                         Keywords: Valentine’s Day, love consumption, romantic gift-giving, Alibaba, e-romance,
                                         e-commerce

                                         1   Introduction

                                         Valentine’s Day on February 14th is a perfect time for lovers to express their affec-
                                         tion with intimacies and gifts. In China, Valentine’s Day has become an increasingly
                                         popular date for romantic business, and Chinese lovebirds on this day of the year
                                         are becoming even more generous than their Western counterparts. According to the
                                         research by MasterCard and National Retail Federation, Chinese consumers spent an
                                         average of $274 on 2018 Valentine’s Day versus $144 for American ones (Wang & Tung,

                                                                                   1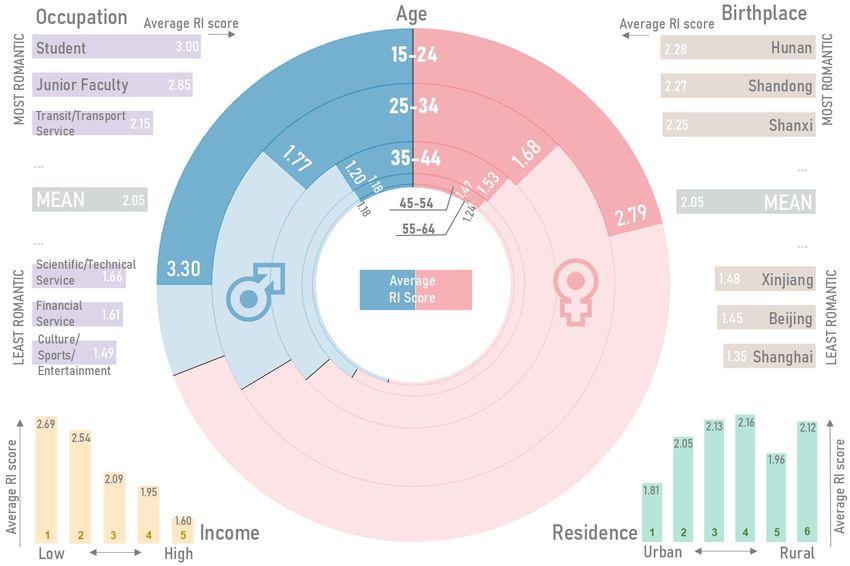
2019). In addition, the previous study also indicates that compared with Westerners,
individuals embedded in East Asian cultures are more likely to use gift-giving as a
mode of expressing romantic love (Liang & Murshed, 2015). China, the world’s top
retail market with an estimated sales volume of $5.6 trillion in 2019 (Davidson, 2019),
provides a natural arena to investigate love consumption and romantic gift-giving on
Valentine’s Day.

Along with the e-commerce era’s progress, gift-givers hoping to woo their love in-
terests have been turning to online shopping venues. Between 2013 and 2014, e-
commerce sales during Valentine’s Day experienced a sharp increase of 8% based on
the IBM Digital Analytics Benchmark (Heller, 2014). More recently, the National Re-
tail Federation released data that indicate e-commerce sales around Valentine’s Day
had boomed in 2018 when 29% of shoppers made their festival purchases via online
stores — an approximate 2% annual growth (Wolinsky, 2019). In China, where 35.3%
of the retail sales occur online (Clark, 2019), all major e-commerce platforms show a
roaring demand for Valentine’s Day gifts. For example, Tmall.com launched about
500,000 new products from 20,000 brands ahead of 2019 Valentine’s Day, includ-
ing customized items, limited-edition lipsticks, and gift boxes from various suppliers
such as Givenchy, Jo Malone, Longines, and Adidas. As another example, throughout
the time leading up to 2019 Valentine’s Day, the gross merchandise volume of fresh
flowers on Taobao.com soared by 69% year-on-year, especially with roses increasing
to 220%. These observations demonstrate not only the extensive popularity of Valen-
tine’s Day in China’s e-market but also the commercial value of mining China’s e-
commerce trends in love consumption and romantic gift-giving. Furthermore, while
considerable consumer research is focused on expressing emotions in general (Gaur,
Herjanto, & Makkar, 2014), studies on conveying romantic love are surprisingly sparse
in marketing literature.

In this study, our goal is to explore Chinese e-romance from a practical point of
view, which attempts to understand the love consumption and romantic gift-giving
of China’s online shoppers by analyzing the massive Valentine’s Day purchase-data
on Alibaba for 2019. Alibaba, the biggest e-commerce company worldwide, is leading
China’s e-market with 53.3% of the online retail sales and 758 million active users
(Blystone, 2021). The latest market survey by KPMG and Mei.com suggests that Al-
ibaba is the most popular e-commerce platform in China, with 44% of the millennials
choosing it as their favorite online shopping channel (Mehra, 2017). For these rea-
sons, we select Alibaba as our testbed to probe into the extent to which each product
category and each shopper group can exhibit romantic love within China’s e-market
over the Valentine’s Day period. First, we tracked 1.07 million shoppers and their
7.92 million products purchased around Valentine’s Day. Next, we formulated an in-
novative romance index (RI) to measure products’ and shoppers’ e-romantic values
quantitatively. Finally, we visualized the RI analysis results to help illustrate Chinese
e-romance from the perspectives of different product categories and shopper groups.
In addition, this empirical information visualization also contributes to improving the

                                           2
segmentation, targeting, and positioning of China’s market for Valentine’s Day.
2 Literature Review
In this section, we briefly review the studies on love consumption and romantic gift-
giving in literature.
Along with booming online commercial events, gift shopping has become a critical
factor in improving e-commerce sales (Ye, Gai, Youssef, & Jiang, 2019). Valentine’s
Day, featuring many deals and promotions, is an important occasion of gift shopping
for consumers who are enthusiastic about expressing romantic love. One of the typical
researches on love consumption was that of Close and Zinkhan (2006), who analyzed
Valentine’s rituals, themes, and meanings to understand consumer behavior for this
holiday. With further research, Close and Zinkhan (2009) aimed to uncover the at-
titude and behavior of anti-consumption and alternative consumption on Valentine’s
Day to advance resistance theories. Recently, Zayas, Pandey, and Tabak (2017) indi-
cated that as Valentine’s Day neared, both roses and chocolates would be evaluated
more positively in the United States. Moreover, they investigated how attachment
style influenced love consumption across various contexts, from movies, books, and
greeting cards to romantic gaming and online dating (Mende, Scott, Garvey, & Bolton,
2019). Despite these successful practices, few studies have been devoted explicitly to
an exploration of love consumption within China’s retail market.
The importance of gift-giving lies in its ability to help forge and reinforce emotional
bonds between givers and recipients (Belk & Coon, 1993). This notion is particularly
true for intimate relationships, where gifts can serve as signals to convey romantic
love, caring, and trust (Cheal, 1987). One of the early researches on romantic gift-
giving stemmed from a study by Netemeyer, Andrews, and Durvasula (1993), which
compared three behavioral intention models for Valentine’s Day gift-giving in terms
of their capabilities to predict and explain business intelligence. Later, Otnes, Ruth,
and Milbourne (1994) examined the questions of what males believed about the pur-
pose of Valentine’s Day, what they liked the most and least about this day, and why
they did or did not participate in gift-giving activities. Similarly, Rugimbana Donahay,
Neal, and Polonsky (2003) made attempts to figure out the motivation of gift-giving
by young males on Valentine’s Day and showed that individual motivation might have
deeper manifestations in the perceived social power relationship. More recently, Lai
and Huang (2013) explored consumer decision to purchase fresh flowers as Valentine’s
Day gifts based on relationship stage, affection, and satisfaction with the relationship.
In general, the majority of existing studies focus on Western cultures, leaving many
questions about China’s romantic gift-giving unanswered.
In this study, the proposed approach leverages massive data pertaining to Alibaba
Valentine’s Day purchases to investigate the love consumption and romantic gift-
3giving in China. To our knowledge, we make the first attempt to address e-commerce
romance by utilizing extensive purchase records, and the practice of romantically in-
dexing products and shoppers in e-commerce environments, followed in this paper,
is also less explored. In addition, this study is launched on a large-scale real-world
dataset with up to 1.07 million Alibaba users to make the research findings more con-
vincing.
3 Methodology
2.1 Data Collection
The dataset used in this study includes 1.07 million Alibaba users’ 7.92 million pur-
chase records throughout the 2 weeks between 02-01-2019 and 02-14-2019. Mean-
while, 10.07 million purchase records from the same Alibaba users over 14 random
ordinary shopping days of 2019 are collected for comparisons. All selected users are
active, i.e., each of them made at least three purchases in 2019. For each user, we can
retrieve and determine six of the individual’s demographic features, including gen-
der, age, birthplace, occupation, income, and residence, as summarized in Table 1.
Here, the gender, age, and birthplace are parsed from user registration information;
the occupation is self-reported by users; the income and residence are two Alibaba-
dependent ratings inferred by algorithms based on payment history and shipping ad-
dress, respectively. Providing more detailed information, we go on to state that there
are a total of 707,349 female and 362,196 male users, and their age distribution is
371,838 in 15∼24, 394,305 in 25∼34, 216,146 in 35∼44, 72,637 in 45∼54, and 14,619
in 55∼64. Note that those users who are under 15 years or above 64 years of age
are excluded from this study. In addition, after de-duplicating all available purchase
records, we obtain 6.38 million unique products in total.
Since Alibaba takes concerns of data privacy seriously, we would like to emphasize
that none of the purchase records in this study’s database permits specific identifica-
tion with a particular individual, and that the database retains no information about
the identity, IP address, or specific physical location of any user.
4Table 1
The Demographic Features of Our Dataset
Feature Name Collection Method Description
gender parsed from registration female and male
information
age parsed from registration 5 age groups, including 15∼24,
information 25∼34, 35∼44, 45∼54, and 55∼64
birthplace parsed from registration 31 provinces of China mainland,
information including Anhui, Beijing, Chongqing,
Fujian, Gansu, Guangdong, Guangxi,
Guizhou, Hainan, Hebei, Hei-
longjiang, Henan, Hubei, Hunan,
Inner Mongolia, Jiangsu, Jiangxi,
Jilin, Liaoning, Ningxia, Qing-
hai, Shaanxi, Shandong, Shanghai,
Shanxi, Sichuan, Tianjin, Tibet,
Xinjiang, Yunnan, and Zhejiang
occupation self-reported by users 14 employment types, includ-
ing agriculture/forestry/animal
husbandry/fishery, business ser-
vice, culture/sports/entertainment,
education, financial service, free-
lance/other service, government,
information technology, junior fac-
ulty, manufacturing, medical/health
service, scientific/technical service,
student, and transit/transport service
income inferred by algorithms 5 levels from low to high: 1∼5
residence inferred by algorithms 6 levels from urban to rural: 1∼6
2.2 Data Analysis
First of all, we seek to formalize the definition of “e-romantic products” around Valen-
tine’s Day. In China, the terminology for gifts is 礼物, in which the first token 礼 refers
to the expectation of following a rule of social interactions (Ye, Gai, Youssef, & Jiang,
2019). According to this implication, we retrieve all products containing keywords
about romantic relationships (e.g., lover, couple, boyfriend/girlfriend, and associated
synonyms) in their titles, descriptions, or customer reviews as the candidates for re-
search. This practice considerably eliminates those purchase records irrelevant to love
consumption and romantic gift-giving. On the other hand, it alleviates the impact of
some other online commercial events on Valentine’s Day purchases to a significant
degree. For instance, the 2 weeks ahead of 2019 Valentine’s Day cover the Chinese
Spring Festival on February 5th , and this festival may also inspire gift-giving activities
among families, friends, and relatives.
5Next, we can calculate the RI score for a specific product, as shown in Eq. (1), where
I ∈ N+ denotes the number of total products; PV(Pi ) ∈ [0, 1] and PO(Pi ) ∈ [0, 1] repre-
sent two probabilities that a shopper buys the product Pi within the 2 weeks ahead of
2019 Valentine’s Day and within the 14 random ordinary shopping days, respectively.
Both probabilities are estimated by dividing the number of purchase records within
the corresponding period by the number of total shoppers. In this manner, a higher
RI(Pi ) ∈ R+ indicates that Pi gains more popularity over the 2019 Valentine’s Day pe-
riod than over the ordinary shopping period and consequently has a closer correlation
to Chinese e-romance. In practice, only those products having RI scores above 1.20
are defined as e-romantic products; this indicates that the sales volume per capita is
at least 20% higher within the 2 weeks ahead of 2019 Valentine’s Day than within
the 14 random ordinary shopping days. Note that the threshold 1.20 was determined
empirically. As for the non-e-romantic products, we simply specify their RI scores
to 1.00 for convenience. On this basis, we will be able to compute the RI score for
a particular shopper, as shown in Eq. (2), where J ∈ N+ denotes the number of to-
tal shoppers; E~j = [Ej1 , Ej2 , · · · , EjI ] represents the purchase record of the shopper Sj
around Valentine’s Day; RI(P~ ) = [RI(P1 ), RI(P2 ), · · · , RI(PI )] indicates the RI scores of
all products; and ⊗ refers to the Hadamard multiplication. More concretely, Eji = 1 if
Sj has bought Pi , otherwise Eji = 0. Note that we choose the statistical function Max(·)
instead of Mean(·) because most shoppers pick up one major gift rather than multiple
minor ones for significant others.
PV(Pi )
RI(Pi ) = ∀i ∈ {1, 2, · · · , I} (1)
PO(Pi )
RI(Sj ) = Max E~j ⊗ RI(P~ ) ∀j ∈ {1, 2, · · · , J} (2)
Both kinds of RI scores are then normalized between 1 and 100, with 1 denoting the
least e-romantic and 100 representing the most e-romantic. However, a low RI score
does not necessarily mean that either a product or a shopper is not romantic on all
occasions, and it merely indicates that a product or a shopper has a limited impact on
2019 Valentine’s Day at Alibaba. Fig. 1 illustrates the flow diagram of our data anal-
ysis, in which the numbers of available products, candidate products, and e-romantic
products are presented, individually. We observe that a total of 15,212 e-romantic
products are finalized, and they account for less than 1% of the available ones. We
also find that only 9.04% of the users in the dataset have bought an e-romantic prod-
uct over the 2019 Valentine’s Day period via Alibaba services and define them as “e-
romantic shoppers” accordingly. Although the definitions of e-romantic products and
e-romantic shoppers can miss some true love consumption and romantic gift-giving,
they greatly support the empirical analysis for Chinese e-romance with the help of
million Valentine’s Day purchases.
6Figure 1. The flow diagram of our data analysis. RI, romance index
4 Results and Visualization
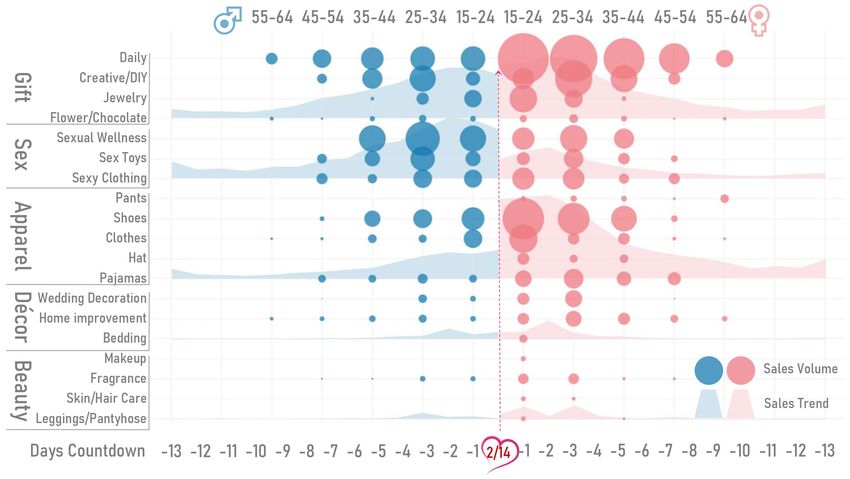
Fig. 2 visualizes the analysis results of e-romantic products in terms of sales volume
per capita and associated sales trends throughout the 2 weeks leading up to 2019
Valentine’s Day at Alibaba. Note that large and small-sized circles indicate high and
low sales volumes per capita, respectively; the rise and fall of sales trends per capita
are depicted as well. All e-romantic products are organized into five product cat-
egories, and these are gift, sex, apparel, décor, and beauty. For instance, apparel-
oriented items consist of pants, shoes, clothes, hats, and pajamas.
Considering all 2019 Valentine’s Day gifts sold via Alibaba, gift-oriented items are
the top buying option, whereas beauty-oriented gifts are the least popular. Except
for décor and beauty, the other product categories start increasing 9∼10 days ahead
of 2019 Valentine’s Day and reach their peaks 2∼3 days before that. As might be ex-
pected, female shoppers make more purchases than their male counterparts during
2019 Valentine’s Day at Alibaba, which is consistent with the common understanding
that women are more deeply involved in gift shopping activities than men. Mean-
while, there is a gender difference that female shoppers buy more apparel-oriented
items, while male shoppers buy more sex-oriented ones. In addition, a majority of
2019 Valentine’s Day purchases at Alibaba occur in the shopper group aged between
715 and 44. One reasonable explanation for this outcome is that young generations
may have a greater viscosity to e-commerce sites than older ones due to their broader
exposure to internet applications.
Interestingly, compared with jewelry and flower/chocolate (i.e., iconic Valentine’s Day
gifts), both daily (e.g., mugs and electric toothbrushes) and creative/DIY (e.g., person-
alized cellphone cases and customized puzzles) oriented items report a higher sales
volume per capita over the 2019 Valentine’s Day period at Alibaba. From the view-
point of showing romantic love, selecting and buying daily oriented items (especially
for personal use) as love consumption often conveys the longing that givers wish to
link and live with recipients. Mugs, as one typical example, are a symbol of life-
long engagement in China because the terminology for them is 杯子, which shares a
similar pronunciation to 一辈子 (i.e., a lifetime of love). As for creative/DIY-oriented
items, the prior research indicates that consumers’ need for uniqueness is increasingly
affecting Chinese consumption mode (Ye, Gai, Youssef, & Jiang, 2019). Under this cir-
cumstance, e-commerce platforms play a natural channel for new businesses to sell
original and exclusive products not readily available at offline retailers.
Figure 2. The analysis results of e-romantic products in terms of sales volume per
capita and sales trend per capita.
8Figure 3. The analysis results of e-romantic shoppers in terms of gender, age, birth-
place, occupation, income, and residence. RI, romance index.
Fig. 3 visualizes the analysis results of e-romantic shoppers in terms of gender, age,
birthplace, occupation, income, and residence around 2019 Valentine’s Day at Al-
ibaba. Note the following in the middle part — the wide and narrow diameter of
circles indicates the large and small number of shoppers; and the high and low ratio
of blue to red is proportional to the gender ratio of males to females. Specifically, our
main findings are summarized as follows:
Overall, the average RI score of shoppers decreases with aging, which aligns with the
observation in Fig. 2 that the majority of 2019 Valentine’s Day purchases at Alibaba
are made by younger generations. Furthermore, on average, male shoppers aged 15
to 34 have a higher RI score than their female counterparts, while female shoppers
aged 35 to 64 have a higher RI score than the same age male ones. One plausible ex-
planation for this outcome can be marriage status. In China, the average age at first
marriage has been postponed to 26 years old (Peng, 2018), and this figure is notably
higher for urban areas (e.g., 30 and 28 years old for male and female residents in
Shanghai). The recent study suggests that for unmarried Chinese lovers, women not
only take greater control over selections of partners but also wield greater decision-
making power within love relationships than men, owing to China’s imbalanced gen-
der ratio of 48.47% females to 51.53% males (Blair & Madigan, 2016; Ritchie & Roser,
2019). However, such an initial dominant-inferior setup often changes after marriage
as women want love, but men want wives (Singh, 2013).
9Table 2
The RI Scores of Shoppers in Different Occupations
Occupation RI Score of Shoppers
No
Name Annual Wage Average Standard Error
1 student N/A 3.00 0.03
2 junior faculty ¥83,412 2.85 0.09
3 transit/transport service ¥80,225 2.15 0.02
4 medical/health service ¥89,648 2.00 0.04
5 education ¥83,412 1.96 0.03
6 freelance/other service ¥50,552 1.95 0.02
7 business service ¥81,393 1.89 0.02
8 information technology ¥133,150 1.85 0.12
9 manufacturing ¥64,452 1.83 0.04
10 government ¥80,372 1.75 0.04
11 agriculture/forestry/animal ¥36,504 1.71 0.21
husbandry/fishery
12 scientific/technical service ¥107,815 1.66 0.15
13 financial service ¥122,851 1.61 0.07
14 culture/sports/entertainment ¥87,803 1.49 0.13
1. The occupations with uncertain and volatile income are marked in grey color.
2. The data on annual wage is referred from the China Statistical Yearbook 2018.
3. RI, romance index.
Obviously, different occupations exhibit different average RI scores over the 2019
Valentine’s Day period at Alibaba. To elucidate, student is the most e-romantic occu-
pation, followed by junior faculty (e.g., postdoctoral researchers, lecturers, and assis-
tant professors) and transit/transport service, whereas scientific/technical service, fi-
nancial service, and culture/sports/entertainment are the three least e-romantic ones.
More information about the average RI scores of shoppers in different occupations
is listed in Table 2. In particular, student and junior faculty contain comparatively
younger shoppers than the rest of occupations, which again sustains the observation
made for the age distribution of e-romantic shoppers in Fig. 2. After excluding free-
lance/other service and agriculture/forestry/animal husbandry/fishery, namely the
two occupations with uncertain and volatile income, we notice that in the remain-
ing table, the top and bottom halves’ average annual wages are $12,385 (¥83,618) and
$14,723 (¥99,407), respectively. This outcome, to a certain degree, keeps pace with the
correlation between RI and income — the average RI score of shoppers monotonously
decreases as their income levels increase. Possibly, high-income individuals possess
more budgets to enjoy brick-and-mortar products and services regarding love con-
sumption and romantic gift-giving.
10Table 3
The RI Scores of Shoppers in Different Birthplaces
Birthplace RI Score of Shoppers
No
Name GDP per Capita Average Standard Error
1 Hunan $8,001 2.28 0.05
2 Shandong $11,525 2.27 0.04
3 Shanxi $6,850 2.25 0.06
4 Hebei $7,219 2.24 0.05
5 Jiangxi $7,168 2.23 0.06
6 Henan $7,579 2.22 0.04
7 Anhui $7,210 2.17 0.04
8 Inner Mongolia $10,322 2.15 0.07
9 Jilin $8,404 2.11 0.07
10 Guangdong $13,058 2.08 0.04
11 Liaoning $8,766 2.06 0.05
12 Heilongjiang $6,539 2.05 0.06
13 Guizhou $6,233 2.04 0.06
14 Sichuan $7,387 2.03 0.04
15 Shaanxi $9,593 2.02 0.06
16 Fujian $13,781 2.00 0.05
17 Tianjin $18,241 1.99 0.11
18 Chongqing $9,964 1.98 0.06
19 Guangxi $6,270 1.94 0.05
20 Yunnan $5,612 1.90 0.06
21 Jiangsu $17,404 1.89 0.04
22 Zhejiang $14,907 1.86 0.04
23 Ningxia $8,175 1.85 0.14
24 Hainan $7,851 1.83 0.11
25 Hubei $10,067 1.80 0.04
26 Gansu $4,735 1.71 0.06
27 Qinghai $7,207 1.65 0.16
28 Tibet $6,564 1.53 0.34
29 Xinjiang $7,476 1.47 0.08
30 Beijing $21,188 1.44 0.08
31 Shanghai $20,398 1.35 0.07
1. The five autonomous regions are marked in gray color.
2. The data on GDP per capita is referred from the Statistical Communiqué of the
People’s Republic of China on the 2018 National Economic and Social Development.
3. RI, romance index.
11Surprisingly, among the 31 provinces and municipalities in China mainland, Hunan,
Shandong, and Shanxi are the three most e-romantic birthplaces, whereas Xinjiang,
Beijing, and Shanghai are the three least e-romantic ones, during the time leading up
to 2019 Valentine’s Day at Alibaba. More information about the average RI scores of
shoppers in different birthplaces is listed in Table 3. Note that five autonomous re-
gions, including Xinjiang, Tibet, Gansu, Ningxia, and Guangxi — the highest level
of minority autonomous entity in China with a comparably higher population of a
particular minority ethnic group, all contain shoppers with low RI scores on aver-
age. After excluding these regions, we notice that in the remaining table, the top and
bottom halves’ average GDPs per capita are $8,390 (¥55,520) and $13,329 (¥88,204),
respectively. This outcome is roughly consistent with the correlation between RI and
residence — shoppers in urban zones have a lower average RI score than ones in rela-
tively rural zones.
5 Conclusion, Limitations and Implications
In this paper, we investigate Chinese e-romance by leveraging massive data pertaining
to Alibaba Valentine’s Day purchases. To this end, 6,381,729 products and 1,069,545
shoppers are romantically indexed to enable ranking their e-romantic values around
Valentine’s Day. To our knowledge, we make the first attempt to address e-commerce
romance by utilizing extensive purchase records. The analysis results of both e-romantic
products and e-romantic shoppers are visualized to help illustrate Chinese e-romance
from the perspective of different product categories and shopper groups. In general,
the proposed approach not only matches some past findings from existing literature
on consumer research but also uncovers many novel phenomena about love consump-
tion and romantic gift-giving in e-commerce environments.
The research findings should be interpreted with caution as this study is limited to Al-
ibaba, one of several major e-commerce platforms in China. Second, Valentine’s Day
may not be representative of other Chinese occasions when love consumption and
romantic gift-giving are made, such as Qixi Festival on July 7th of the Lunar calendar
and Single’s Day on November 11st . Third, this study exclusively covers products con-
taining romantic keywords in their titles, descriptions, or customer reviews; products
containing romantic keywords in other text sources are not included. Last but not
least, the definitions of e-romantic products and e-romantic shoppers presume that
Valentine’s Day purchases are made online — which may not always be the case.
Practically, the research findings will benefit practitioners in China’s e-market in the
aspects of love consumption and romantic gift-giving by providing them with a unique
understanding of market segmentation, targeting, and positioning over Valentine’s
Day period. Theoretically, these findings will benefit scholars, researchers, and other
academics interested in Chinese e-romance by making them familiar with some salient
aspects that characterize China’s lovebirds’ online shopping behavior.
12Acknowledgments
Yongzhen Wang was supported by the Fundamental Research Funds for the Central
Universities of China, No. DUT21RC(3)068. We thank Alibaba Group for providing
this study with the e-commerce data on Valentine’s Day purchases, and reviewers and
editors for their thoughtful comments and suggestions.
References
Belk, R. W., & Coon, G. S. (1993). Gift giving as agapic love: An alternative to the exchange
paradigm based on dating experiences. The Journal of Consumer Research, 20(3), 393-417.
https://doi.org/10.1086/209357
Blair, S. L., & Madigan, T. J. (2016). Dating attitudes and expectations among young Chinese
adults: An examination of gender differences. The Journal of Chinese Sociology, 3(1), 12.
https://doi.org/10.1186/s40711-016-0034-1
Blystone, D. (2021, January 18). Understanding the Alibaba business model.
Retrieved from https://www.investopedia.com/articles/investing/062315/understanding-
alibabas-business-model.asp
Cheal, D. (1987). Showing them you love them: Gift giving and the dialectic of intimacy. The
Sociological Review, 35(1), 150-169.
https://doi.org/10.1111/j.1467-954X.1987.tb00007.x
Clark, D. (2019, January 23). 2019: China to surpass US in total retail sales.
Retrieved from https://www.emarketer.com/newsroom/index.php/2019-china-to-surpass-
us-in-total-retail-sales
Close, A., & Zinkhan, G. (2006). A holiday loved and loathed: A consumer perspective of
Valentine’s Day. ACR North American Advances, 33, 356-365.
Retrieved from https://www.acrwebsite.org/volumes/12416/volumes/v33/NA-33
Close, A. G., & Zinkhan, G. M. (2009). Market-resistance and Valentine’s Day events. Journal
of Business Research, 62(2), 200-207.
https://doi.org/10.1016/j.jbusres.2008.01.027
Davidson, P. (2019, January 23). China to top U.S. as world’s no. 1 retail market in 2019: Report.
Retrieved from https://www.usatoday.com/story/money/2019/01/23/china-top-us-largest-
retail-market-2019-report-says/2651447002
Gaur, S. S., Herjanto, H., & Makkar, M. (2014). Review of emotions research in marketing,
2002–2013. Journal of Retailing and Consumer Services, 21(6), 917-923.
https://doi.org/10.1016/j.jretconser.2014.08.009
Heller, L. (2014, February 18). Valentine’s Day mobile shopping grows 40% in 2014.
Retrieved from https://www.fierceretail.com/operations/valentine-s-day-mobile-shopping-
grows-40-2014
Lai, Y., & Huang, L. (2013). The effect of relationship characteristics on buying fresh flowers
as romantic valentine’s day gifts. HortTechnology, 23(1), 28-37.
https://doi.org/10.21273/HORTTECH.23.1.28
Liang, B., & Murshed, F. (2015). Culture, expressions of romantic love, and gift-giving. Journal
of International Business Research, 14(1), 68-84.
Retrieved from https://search.proquest.com/docview/1693335517?pq-origsite=gscholar &fro-
13mopenview=true
Mehra, N. (2017, December 12). China’s retail sector transforms, millennials are key drivers, finds
KPMG and Mei.com survey.
Retrieved from https://home.kpmg/cn/en/home/news-media/press-releases/2017/12/china-
retail-sector-transforms.html
Mende, M., Scott, M. L., Garvey, A. M., & Bolton, L. E. (2019). The marketing of love: How
attachment styles affect romantic consumption journeys. Journal of the Academy of Marketing
Science, 47(2), 255-273.
https://doi.org/10.1007/s11747-018-0610-9
Netemeyer, R. G., Andrews, J. C., & Durvasula, S. (1993). A comparison of three behavioral in-
tention models: The case of valentine’s day gift-giving. ACR North American Advances, 20(1),
135-141.
Retrieved from https://www.acrwebsite.org/volumes/7426
Otnes, C., Ruth, J. A., & Milbourne, C. C. (1994). The pleasure and pain of being close: Men’s
mixed feelings about participation in valentine’s day gift exchange. ACR North American
Advances, 21(1), 159-164.
Retrieved from https://www.acrwebsite.org/volumes/7578/volumes/v21/NA-21/full
Peng, Y. (2018, March 13). Across China: Chinese cities see rising marriage age.
Retrieved from http://www.xinhuanet.com/english/2018-03/13/c 137036066.htm
Ritchie, H. & Roser, M. (2019). Gender ratio.
Retrieved from https://ourworldindata.org/gender-ratio
Rugimbana, R., Donahay, B., Neal, C., & Polonsky, M. J. (2003). The role of social power
relations in gift giving on valentine’s day. Journal of Consumer Behaviour: An International
Research Review, 3(1), 63-73.
https://doi.org/10.1002/cb.122
Singh, S. (2013). Women want love, men want wives: The discourse of romantic love in young
adults’ future marriage goals. Agenda (Durban, South Africa) 27(2), 22-29.
https://doi.org/10.1080/10130950.2013.808798
Wang, J., & Tung, M. (2019, February 15). What China is loving this Valentine’s Day.
Retrieved from https://www.alizila.com/what-china-is-loving-this-valentines-day
Wolinsky, J. (2019, February 19). The top buying trends of Valentine’s Day.
Retrieved from https://www.valuewalk.com/2019/02/top-buying-trends-valentines-day
Ye, L., Gai, L., Youssef, E., & Jiang, T. (2019). Love consumption at the digital age: Online
consumer reviews and romantic gift giving. Journal of Global Marketing, 32(5), 335-355.
https://doi.org/10.1080/08911762.2018.1564161
Zayas, V., Pandey, G., & Tabak, J. (2017). Red roses and gift chocolates are judged more
positively in the US near Valentine’s Day: Evidence of naturally occurring cultural prim-
ing. Frontiers in Psychology, 8, 355.
https://doi.org/10.3389/fpsyg.2017.00355
14You can also read