Citi Asia Pacific Property Conference - 23 June 2021 - OUE Commercial REIT ...
←
→
Page content transcription
If your browser does not render page correctly, please read the page content below

Citi Asia Pacific Property Conference
23 June 2021
Important Notice

This presentation is for information purposes only and does not constitute an invitation, offer or solicitation of any offer to acquire, purchase or subscribe for units in
OUE Commercial REIT (“Units”). The value of Units and the income derived from them, if any, may fall or rise. The Units are not obligations of, deposits in, or
guaranteed by, OUE Commercial REIT Management Pte. Ltd. (the “Manager”), DBS Trustee Limited (as trustee of OUE Commercial REIT) or any of its affiliates. An
investment in the Units is subject to investment risks, including the possible loss of the principal amount invested. The past performance of OUE Commercial REIT is
not necessarily indicative of the future performance of OUE Commercial REIT.

This presentation may contain forward-looking statements that involve risks and uncertainties. Actual future performance, outcomes and results may differ materially
from those expressed in forward-looking statements as a result of a number of risks, uncertainties and assumptions. These forward-looking statements speak only as
at the date of this presentation. Past performance is not necessarily indicative of future performance. No assurance can be given that future events will occur, that
projections will be achieved, or that assumptions are correct. Representative examples of these factors include (without limitation) general industry and economic
conditions, interest rate trends, cost of capital and capital availability, competition from similar developments, shifts in expected levels of property rental income,
changes in operating expenses (including employee wages, benefits and training costs), property expenses and governmental and public policy changes. You are
cautioned not to place undue reliance on these forward-looking statements, which are based on the Manager’s current view of future events.

Investors should note that they will have no right to request the Manager to redeem their Units while the Units are listed on the Singapore Exchange Securities
Trading Limited (the “SGX-ST”). It is intended that Unitholders may only deal in their Units through trading on the SGX-ST. Listing of the Units on the SGX-ST does
not guarantee a liquid market for the Units.

The information and opinions contained in this presentation are subject to change without notice.

                                                                                                                                                                              2
Agenda

▪    Overview
▪    Financial Summary and Capital Management
▪    Commercial Segment
▪    Hospitality Segment
▪    Value - Enhancing Portfolio Management
▪    Looking Ahead
▪    Appendices

                                                3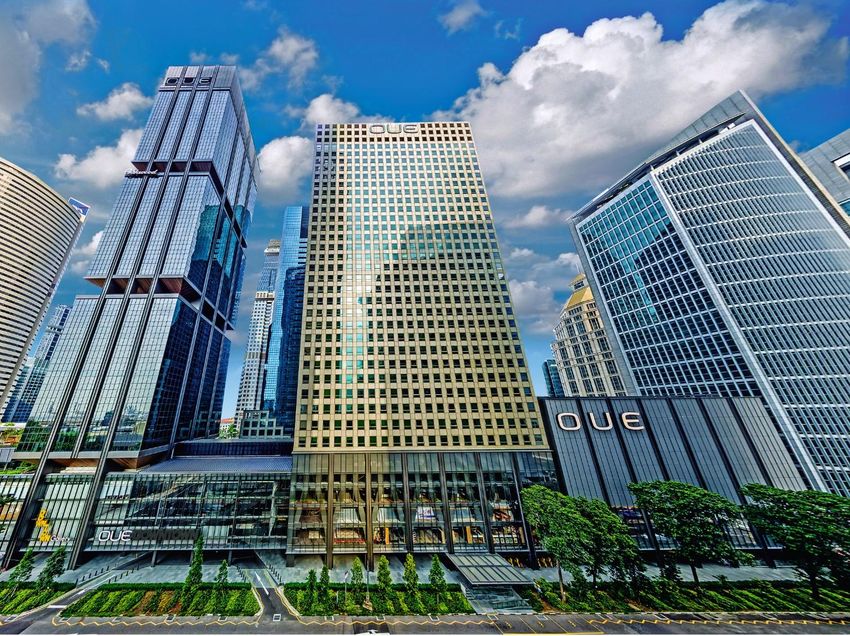
Overview
Overview of OUE C-REIT
One of the
Largest Diversified
Total Assets
7 7 High quality
prime assets
SGX-listed REITs S$ 6.8 billion(1)
High quality prime assets
3
6 properties in Singapore and 1 Asset classes
property in Shanghai
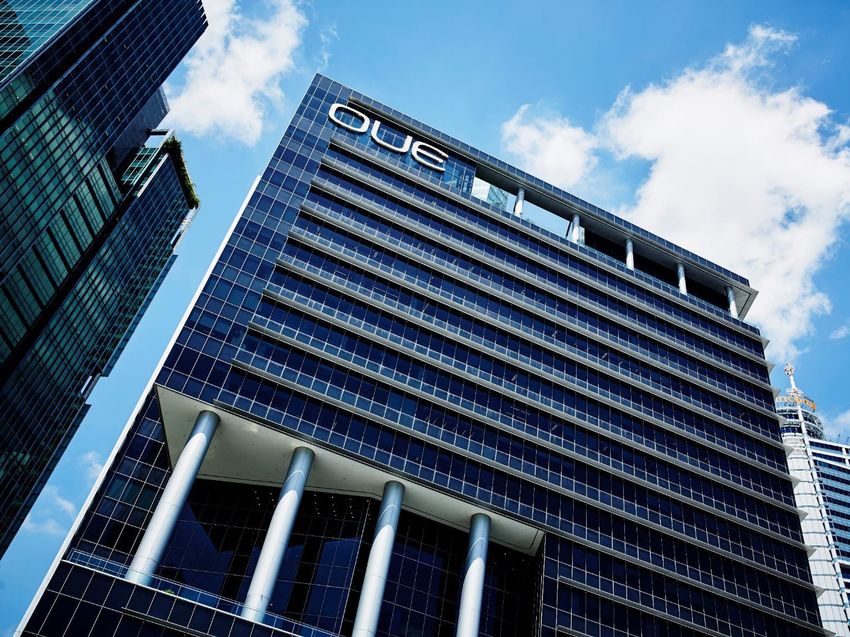
OUE Bayfront One Raffles Place OUE Downtown Office Lippo Plaza Mandarin Gallery Mandarin Orchard Singapore Crowne Plaza Changi Airport
Strong Support Investment Mandate
OUE Group
More than
in net lettable area 2.0 mil sq ft
✓ Commercial
48.0% stake (2)
1,640 upscale
hotel rooms
✓ Hospitality / Hospitality-related
(1) As at 31 December 2020
(2) As at 31 March 2021 5
Milestones Since Listing

                             ▪ Maiden acquisition                                                           ▪ Merger with OUE Hospitality Trust by                                       ▪ Asset
                               of One Raffles                                                                 way of a trust scheme of arrangement                                         recycling via
                               Place (67.95%                                                                  (effective 4 Sep 2019)                                                       divestment of
                               effective interest)                                                                                                                                         50% interest
                                                                                                            ➢ Total assets of S$6.9 billion
                             ➢ Total assets of                                                                                                                                             in OUE
                               S$3.5 billion                                                                                                                                               Bayfront
                                                                                                                                                                                            at 7.3% premium to book
                             ▪ Established S$1.5 billion                                                                                                                                    value and 26.1%
                               Multi-Currency Debt Issuance                                                                                                                                 premium to purchase
                               Programme                                                                                                                                                    consideration

   2014                                     2015                                        2018                                       2019                                        2020                        2021

                                                                     ▪ Acquisition of                                                           ▪ Re-branding of
                                                                       OUE Downtown                                                               Mandarin Orchard
                                                                       Office                                                                     Singapore to Hilton
                                                                    ➢ Total assets of                                                             Singapore Orchard
▪ Listed on SGX-ST
  with two assets –                                                   S$4.6 billion                                                             ▪ Established S$2.0 billion Multi-Currency Debt
  OUE Bayfront and                                                                                                                                Issuance Programme, and issued S$100 million
  Lippo Plaza                                                                                                                                     4.0% fixed rate notes due 2025
                                                                                                                                                ▪ Obtained S$1.0 billion of new facilities(1) for
➢ Total assets of
                                                                                                                                                  2020 and 2021 refinancing requirements
  S$1.7 billion
(1) Comprising S$100 million of medium term notes and S$900 million facilities. The S$900 million facilities were upsized to S$978 million upon exercise of greenshoe option in March 2021                            6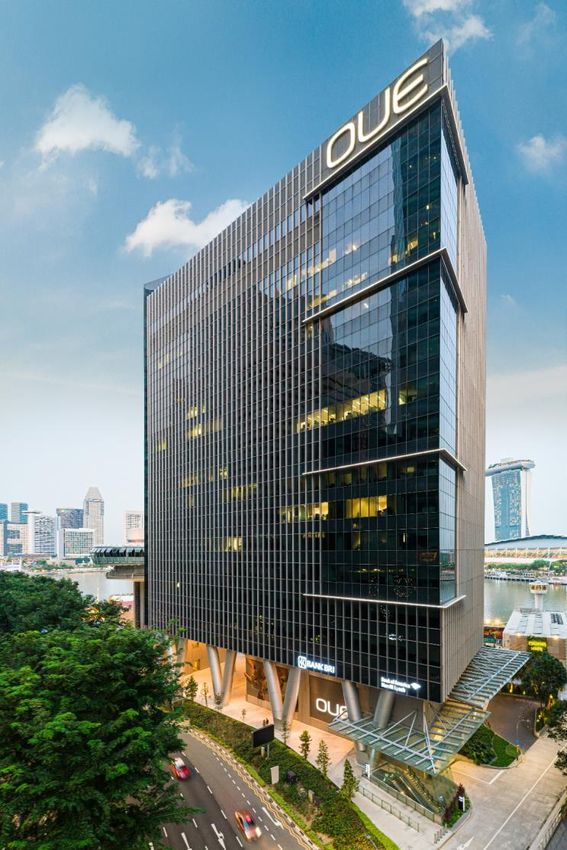
Quality Portfolio
                                    Strategically Located Assets in Prime Business Districts
                                                 Singapore                                                                    Shanghai

          OUE Bayfront                        One Raffles Place                  OUE Downtown Office                        Lippo Plaza

▪ Commercial assets situated in the three key office submarkets in Singapore of Marina Bay, Raffles            ▪ Benefits from Shanghai’s
  Place and Shenton Way, where medium term supply is limited                                                     dominant position as a major
▪ Delivered resilient performance in a challenging operating environment, underpinning OUE C-REIT’s              financial and service hub in
  revenue contribution                                                                                           China
         Mandarin Gallery               Mandarin Orchard Singapore            Crowne Plaza Changi Airport

                                                                                                                 Legend
▪ Strategically located assets along the prime Orchard Road belt and within the Changi Airport vicinity
  are well-positioned to benefit from the authorities’ focus on Singapore as a key business and leisure               Commercial (Office and/or retail)
  destination
                                                                                                                      Hospitality
▪ Hospitality assets to benefit from continued investment in tourism infrastructure across the city, as well
  as government support for the sector
                                                                                                                                                          7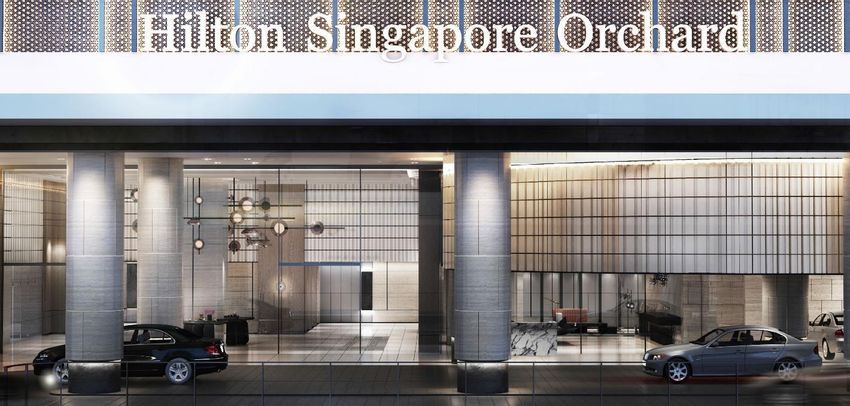
Portfolio Composition

                    Crowne Plaza
                    Changi Airport                                                           Crowne Plaza
                        7.2%                                                                 Changi Airport                                                                                         Hotel master lease
         Mandarin                                                                                7.5%                                                                                               agreements provide
          Gallery                            One Raffles                                                                                                                                            minimum rent of
                                                                               Lippo Plaza                               One Raffles
           7.2%                                Place                              8.1%
                                                                                                                                                                                                    S$67.5 million
                                                                                                                           Place                                  Retail
                                               27.5%                                                                       25.2%                                                                    per annum(3)
                                                                                                                                                                  14.9%            Hospitality
Lippo Plaza                                                                 Mandarin                                                                                                22.6%
   8.5%                                                                      Gallery
                                                                              8.4%
                             By                                                                        By                                                                By
                            Asset                                                                   Revenue                                                           Segment
                           Value(1)                                                               Contribution(2)                                                   Contribution(2)
  OUE
Downtown                                                                 Mandarin
  Office                                                                  Orchard
 13.8%                                                                   Singapore
                                                 OUE Bayfront              15.1%                                             OUE Bayfront                            Office
                                                   18.1%                                                                       20.4%                                 62.5%

                    Mandarin
                                                                                                   OUE
                     Orchard
                                                                                                 Downtown
                    Singapore
                                                                                                   Office
                      17.7%
                                                                                                  15.3%

    ◼   91.5% of assets under                                           ◼   No single asset contributes more                                         ◼   62.5% of 1Q 2021 revenue
        management in Singapore                                             than 25.2% to total revenue                                                  underpinned by the office segment

Commercial segment comprises the office and/or retail contribution from OUE Bayfront, One Raffles Place (67.95% effective interest), OUE Downtown Office, Lippo Plaza (91.2% strata interest) and Mandarin Gallery
(1) Based on independent valuations as at 31 December 2020 and assuming SGD:CNY exchange rate of 1:4.843 as at 31 March 2021
(2) For 1Q 2021
(3) Mandarin Orchard Singapore and Crowne Plaza Changi Airport’s master lease agreements are subject to a minimum rent of S$45.0 million and S$22.5 million per annum respectively, totalling S$67.5 million per annum
                                                                                                                                                                                                                         8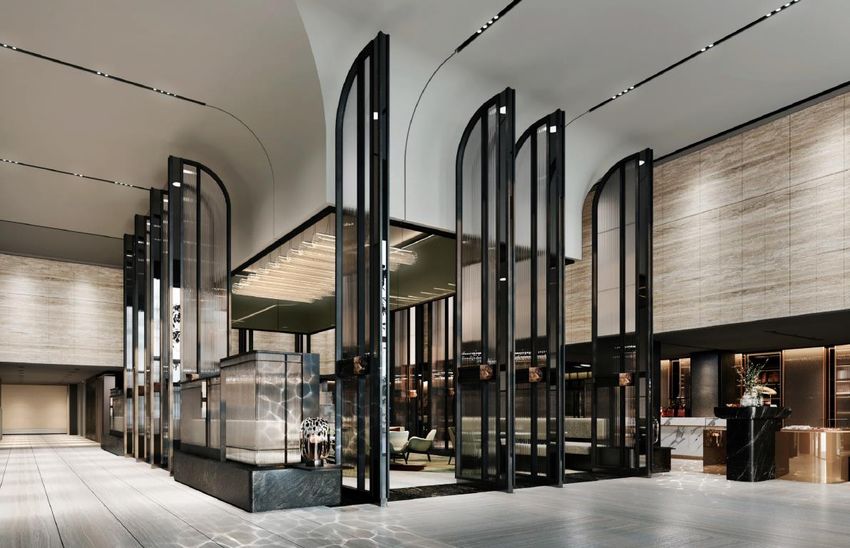
Tenant Base and Lease Expiry Profile –
                                                        All Segments
                                                 Others
                                      Maritime & 1.8% Pharmaceuticals
                                       Logistics        & Healthcare
                               Services 2.3%               1.4%
                                3.5%
                  IT, Media &                                                                                                                 Office     Retail (1)   Hospitality
              Telecommunications                                                 Hospitality
                      3.7%                                                        22.7%
           Manufacturing &
             Distribution                                                                                                                                                                       21.9%
                4.1%
              Legal                                                                                                                   18.3%
              4.3%

  Real Estate &                                                                                                                                        13.2%
                                                                                                                      12.2%
Property Services
     4.7%                                                                                                                                                                 9.2%
                                                                                                                                                                                         7.6%
   Food & Beverage
        4.9%                                                                                                                                                4.2%                             5.1%
                                                                                                                            3.2%          3.3%
                                                                                                                                                                               1.8%
            Energy &
           Commodities                                                                 Banking, Insurance
              5.3%                                                                     & Financial Services                2021          2022              2023                2024    2025 and beyond
                                                                                             20.8%

                          Retail
                                                                                                                             WALE(2) of 3.3 years by Gross Rental Income
                          9.6%
                                                        Accounting &
                                                     Consultancy Services                  As of Mar 2021                                                                             As at 31 Mar 2021
                                                            10.9%

            Note: Tenant by trade sector is based on gross rental income excluding any provisions of rental rebates
            (1) Refers to contribution from Mandarin Gallery and all other retail components within OUE C-REIT’s portfolio
            (2) “WALE” refers to the weighted average lease term to expiry. Based on committed tenancies and excludes turnover rent                                                                       9
Sustainability Commitment

                            Stewarding the                                                                                 Strengthening Social Fabric
                             Environment
                                                                                ▪ Committed to the health and safety of all stakeholders, a fair and
   ▪ Committed to improving energy                                                inclusive workplace for employees and leveraging on technology
     efficiency of portfolio to align with                                        to improve service quality and enhance the visitor experience
     low carbon emissions strategy, as
     well as exploring renewable                                                         ✓ Adopted new innovations, as well as smart and contactless technology
     energy options to support the                                                         to meet the increased focus on a clean and safe environment and to
     transition to a net-zero economy                                                      better serve tenants’ needs

            ✓ Green mark rating achieved for                                             ✓ 75% of employees in senior management are women
              all commercial properties and
              Mandarin Orchard Singapore
                                                                                                                                       Building Trust
            ✓ Continued to achieve
              reductions1 in portfolio intensity
                                                                               ▪ Committed to conducting our business ethically with good corporate
              levels of energy consumption,
              greenhouse gas emissions and                                       governance standards
              water usage compared to base                                              ✓ Ranked #10 out of 45 in the Singapore Governance and Transparency
              year 2017                                                                   Index 2020 – REITs and Business Trust Category(2)

(1) FY 2020 reductions in energy and water consumption levels may be partially attributed to decreased business activities due to the COVID-19 pandemic
(2) The Singapore Governance and Transparency Index (SGTI) is a joint initiative of CPA Australia, NUS Business School’s Centre for Governance and Sustainability and Singapore Institute of Directors. The SGTI
    assesses companies on their corporate governance disclosures and practices as well as the timeliness, accessibility and transparency of financial results announcements                                        10
Financial Summary & Capital Management
Key Highlights

1Q 2021             Revenue                                 Net Property Income                         Amount Available for                      As at 31 Mar 2021
Financial                                                                                               Distribution                              NAV per Unit
Highlights
                    S$74.7 m                               S$61.1 m                                     S$37.1 m                                  S$0.58
                         3.9% YoY                                1.6% YoY                                     2.7% YoY                          31 Dec 2020: S$0.59

                    Commercial Segment(1)                                  Singapore Office                                              Portfolio WALE
1Q 2021
                    Committed Occupancy                                    Rental Reversions                                             by Gross Rental Income
Portfolio
Performance
                    91.7 %                                                 0.8 % - 7.2 %                                                  3.3 years

Capital             Aggregate Leverage                                     Weighted Average Cost of Debt                                 Average Term of Debt
Management
as at
31 March 2021
                    40.4 %                                                  3.1 % p.a.                                                    2.8 years
                    4Q 2020: 41.2%                                         4Q 2020: 3.0% p.a.                                             4Q 2020: 2.3 years

                (1) Commercial segment comprises OUE Bayfront, One Raffles Place (67.95% effective interest), office components of OUE Downtown (“OUE Downtown Office”), Lippo Plaza
                    (91.2% strata interest) and Mandarin Gallery                                                                                                                       12
Capital Management
▪ In 1Q 2021, refinanced a loan due in 2022 ahead of expiry with a new five-year facility. Consequently, average term of
debt increased to 2.8 years as at 31 March 2021
▪ In June 2021, issued S$150 million 3.95% notes due 2026 for refinancing requirements in 2H 2021. Pro forma average
term of debt as at 31 March 2021 expected to increase to 3.1 years
Debt Maturity Profile as at 31 March 2021
As at 31 Mar 2021 As at 31 Dec 2020 S$ million
Aggregate Leverage 40.4% 41.2% 23
Total debt S$2,335m(1) S$2,664m(2) 265
150
150
Weighted average cost of debt 3.1% p.a. 3.0% p.a.
645
422
Average term of debt 2.8 years 2.3 years 250 317
163
100
% fixed rate debt 72.1% 68.1%
2021 2022 2023 2024 2025 2026
Interest coverage ratio(3) 2.6x 2.7x SGD Loan Share of OUB Centre Limited's SGD Loan MTN RMB Loan Share of BPH Propco LLP's SGD Loan
(1) Based on SGD:CNY exchange rate of 1:4.843 as at 31 March 2021 and includes OUE C-REIT’s share of OUB Centre Limited’s loan and BPH PropCo LLP’s loan
(2) Based on SGD:CNY exchange rate of 1:4.912 as at 31 December 2020 and includes OUE C-REIT’s share of OUB Centre Limited’s loan
(3) Interest coverage ratio as prescribed under Appendix 6 of the Monetary Authority of Singapore’s Code on Collective Investment Schemes (last revised on 16 April 2020) 13Commercial Segment
Office Segment Occupancy
Singapore
▪ OUE Bayfront’s committed office Chart Title
occupancy as at 31 March 2021 was 100%
98.7%
98.7%, ahead of the wider market 96.7%
95%
▪ One Raffles Place’s committed office 92.4%
91.7%
90%
occupancy declined 0.4 ppt QoQ to 91.7%
▪ OUE Downtown Office’s committed 85%
3Q13
4Q13
1Q14
2Q14
3Q14
4Q14
1Q15
2Q15
3Q15
4Q15
1Q16
2Q16
3Q16
4Q16
1Q17
2Q17
3Q17
4Q17
1Q18
2Q18
3Q18
4Q18
1Q19
2Q19
3Q19
4Q19
1Q20
2Q20
3Q20
4Q20
1Q21
occupancy increased 0.3 ppt QoQ to
92.4% OUE Bayfront One Raffles Place OUE Downtown Office Singapore Core CBD Office
Shanghai
100%
▪ Lippo Plaza’s committed office occupancy 95%
decreased 3.3 ppt QoQ to 83.2% due to 90%
85.1%
intense leasing competition amidst an 85%
83.2%
80%
increase in supply
75%
3Q13
4Q13
1Q14
2Q14
3Q14
4Q14
1Q15
2Q15
3Q15
4Q15
1Q16
2Q16
3Q16
4Q16
1Q17
2Q17
3Q17
4Q17
1Q18
2Q18
3Q18
4Q18
1Q19
2Q19
3Q19
4Q19
1Q20
2Q20
3Q20
4Q20
1Q21
Lippo Plaza Shanghai CBD Grade A Office
Source: CBRE, Colliers Shanghai
15Committed and Average Office Rents
▪ Committed office rents for 1Q 2021 remained healthy. Rental reversions for Singapore office properties ranged from
0.8% to 7.2%
Average Expired Comparable Sub-market Rents
1Q 2021 Committed Rents(1) Sub-market
Rents Colliers(2) Savills(3)
Singapore
New Downtown/
OUE Bayfront S$10.86 S$11.00 – S$12.70 S$11.21 S$12.27
Marina Bay
One Raffles Place S$9.98 S$9.30 – S$11.10 Raffles Place S$9.75 S$9.57
Shenton Way/
OUE Downtown Office S$7.53 S$7.50 – S$8.30 S$10.02 S$8.46 – S$8.65
Tanjong Pagar
Shanghai
Lippo Plaza RMB10.75 RMB8.76 – RMB10.00 Puxi RMB8.54 RMB9.40(4)
(1) Committed rents for renewals and new leases
(2) Source: Colliers Singapore Office Quarterly 1Q 2021 for Singapore comparable sub-market rents; Colliers Shanghai Office Market Overview 1Q 2021 for Shanghai comparable sub-market rents
(3) Source: Savills Singapore Office Briefing 1Q 2021 for Singapore comparable sub-market rents; Savills Shanghai Office Market in Minutes Report 1Q 2021 for Shanghai comparable sub-market rents
(4) Shanghai Grade A office rent for prime districts of Nanjing Road West, Huaihai Middle Road and Lujiazui as defined by Savills
Note: For reference, CBRE Research’s 1Q 2021 Grade A Singapore office rent is S$10.40 psf/mth. Sub-market rents are not published 16Average Office Passing Rents
S$ psf/mth
11.98 12.03 12.09 12.26 12.25 12.31
11.75 11.85 11.43 11.60
10.40 10.58 10.26 10.28 9.92 9.99
▪ Higher YoY average passing
9.92 9.88 9.90
9.45 9.68 9.69
7.93
rents for Singapore office
7.92
7.44
6.94 7.27 7.31 7.39 properties due to positive rental
Singapore reversions in past consecutive
(Office)
quarters
(1)
2013 2014 2015 2016 2017 2018 2019 1Q20 2Q20 3Q20 4Q20 1Q21
OUE Bayfront One Raffles Place OUE Downtown Office
RMB psm/day
9.97
9.89 9.79 9.81 9.86 9.75 9.65 9.70 9.64 9.54
▪ Average passing office rent for
9.45 9.39
9.06 9.14 9.17 Lippo Plaza declined to
Shanghai RMB9.17 psm/day as landlords
(Office) continue to compete for tenants
amidst increasing supply
(1)
2013 2014 2015 2016 2017 2018 1Q19 2Q19 3Q19 4Q19 1Q20 2Q20 3Q20 4Q20 1Q21
Lippo Plaza
(1) Pro forma average passing rents as at 30 September 2013 as disclosed in OUE C-REIT’s Prospectus dated 17 January 2014 17Mandarin Gallery
Committed Occupancy(1)
96.8% 99.1% 100.0% 99.5% 98.2% 98.3% 97.8%
94.4% 93.9%
▪ Including short-term leases to support tenants’ space
91.1% 91.6%
requirements, committed occupancy is 97.1%
▪ The Manager continues to adopt flexible leasing
strategies to sustain occupancy in view of continued
headwinds facing the prime retail segment
1%
3Q18 4Q18 1Q19 2Q19 3Q19 4Q19 1Q20 2Q20 3Q20 4Q20 1Q21
4%
5%
Average Passing Rents 7%
S$ psf/mth
9%
Tenant Mix 59%
24.60 by GRI
23.60 23.60 23.60
22.50 22.30 22.47 22.62 22.42 22.45 15%
21.70 21.95 21.95 22.02
As of Mar 2021
Fashion & Accessories Food & Beverage Hair & Beauty
Travel Watches & Jewellery Living & Lifestyle
2014 2015 2016 2017 2018 1Q19 2Q19 3Q19 4Q19 1Q20 2Q20 3Q20 4Q20 1Q21 Services
(1) Excludes short-term leases 18Top 10 Tenants – Commercial Segment
Top 10 Tenants
6.0%
By Gross Rental Income 27.0%
5.0%
4.8%
2.2%
1.9%
1.7%
1.5%
1.3% 1.3% 1.3%
(1)
Deloitte & Bank of Luxury Allen & Overy Aramco Asia Virgin Active Hogan Lovells OUE Limited Aviva Ltd Professional
Touche LLP America Merrill Ventures LLP Singapore Pte. Singapore Pte Lee & Lee Investment
Lynch Ltd. Ltd Advisory
Services Pte
Ltd
As of Mar 2021
(1) Including the hotel master lease arrangements for Mandarin Orchard Singapore and Crowne Plaza Changi Airport, where OUE Limited is the master lessee, OUE Limited’s contribution
to the portfolio by gross rental income is 23.7%
19Hospitality Segment
RevPAR Performance - 1Q 2021
(S$)
71.3% 44.4% 57.1%
141
121
110
78
52
32
Mandarin Orchard Crowne Plaza Changi Hospitality Segment
Singapore Airport
1Q 2021 1Q 2020
▪ With major renovation works underway to re-brand Mandarin Orchard Singapore to Hilton Singapore Orchard,
demand was mainly driven by locals for staycations. RevPAR declined to S$32 in 1Q 2021, 71.3% lower YoY
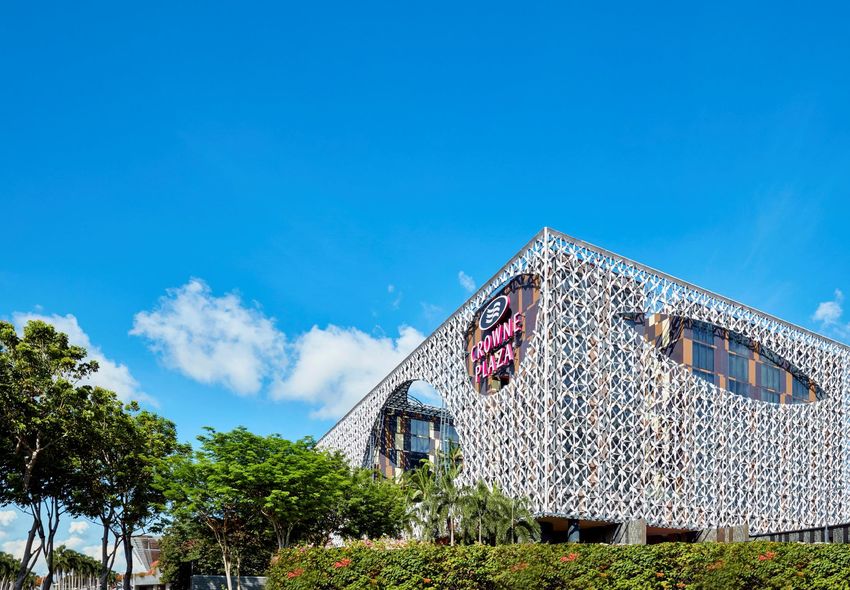
▪ Crowne Plaza Changi Airport reopened in February 2021 after temporarily closing in January as a precautionary
measure to facilitate investigations by the Ministry of Health. Consequently, RevPAR of S$78 was 44.4% lower YoY.
The hotel continues to serve the aviation sector and remains a key beneficiary of further progress of travel
arrangements with other countries
21Value - Enhancing Portfolio Management
Re-branding of Mandarin Orchard Singapore to
Hilton Singapore Orchard
▪ Transformational re-branding with addition of new income-
generating spaces to drive growth in sustainable returns
and value
▪ Re-branding will allow the hotel to leverage on Hilton’s
strong brand recognition and global sales & distribution
network
New Lobby Lounge on Level 5
▪ Re-branded hotel set to become Hilton’s flagship in
Singapore and the largest Hilton hotel in Asia-Pacific
Level 1 drop off and arrival
Income assurance for Unitholders - Downside
protection from master lease throughout phased
renovation and ramping-up period
Note: Images are artist impressions and are subject to changes. 23Divestment of 50% Interest in OUE Bayfront to
Fund Managed by Allianz Real Estate
▪ Partial divestment of OUE Bayfront property to Allianz Real Estate-managed
fund (“ARE”) completed on 31 March 2021. OUE C-REIT and ARE each hold a
50% interest in BPH Propco LLP, the limited liability partnership holding the
property
▪ Agreed value of S$1,267.5 million or S$3,170 per sq ft represents
➢ 7.3% premium over book value
➢ 26.1% premium over purchase consideration in 2014
▪ Net divestment proceeds of S$262.6 million
➢ S$155.0 million to redeem convertible perpetual preferred units to
optimise OUE C-REIT’s capital structure
➢ S$15.0 million to share divestment gains with Unitholders
➢ Balance of proceeds applied towards other value-enhancing options to
drive returns for Unitholders
24Looking Ahead
Navigating Through 2021

                         Proactive Asset                                                              Preserving Cash                                                            Capitalise on
                         Management &                                                                 Flow & Financial                                                         Value-Enhancing
                       Tenant Engagement                                                                 Flexibility                                                            Opportunities

▪    Sustaining occupancy remains a key                                   ▪     Focus on cost management and cash                                   ▪    Transformational re-branding of
     focus:                                                                     conservation                                                             Mandarin Orchard Singapore to Hilton
        ✓ Continue to monitor business                                                                                                                   Singapore Orchard to reposition the hotel
                                                                          ▪     Proactive and prudent capital                                            and capitalise on the eventual recovery in
          environment closely to recalibrate                                    management including optimising capital
          leasing strategies as suited                                                                                                                   the hospitality sector
                                                                                structure and proactive refinancing
        ✓ Exercise flexibility in lease                                                                                                                     ✓ Property on track to re-open in
          management and terms to support                                 ▪     Rental collections for portfolio remain                                       January 2022 as the largest Hilton
          occupiers’ space requirements                                         healthy at 94%                                                                hotel in Asia-Pacific and its flagship
        ✓ Remain supportive of retail tenants                                                                                                                 in Singapore
                                                                          ▪     Rent deferments(1) manageable at
          as challenges remain. Approximately                                   S$0.3 million
          S$2.6 million of rental rebates
          extended in 1Q 2021
▪    Quality office space in the three major
     Singapore office submarkets to meet
     occupiers’ different needs

    (1) Includes tenants who have invoked the Notice of Relief under the COVID-19 (Temporary Measures Act), as well as those under flexible repayment schemes as at 31 March 2021                      26
Appendices ▪ OUE C-REIT’s Portfolio ▪ Singapore Office Market ▪ Shanghai Office Market ▪ Singapore Hospitality Market ▪ Hotel Master Lease Details
Premium Portfolio of Assets

                             Strategically-located assets in the prime business districts of Singapore and Shanghai

                                                                           OUE Downtown                                                                  Mandarin Orchard            Crowne Plaza
                      OUE Bayfront            One Raffles Place                                          Lippo Plaza            Mandarin Gallery                                                                 Total
                                                                               Office                                                                       Singapore                Changi Airport
Description       A landmark Grade A        Iconic integrated           Grade A office space, a     Grade A commercial         Prime retail landmark    A world class             Award-winning hotel at         NLA:
                  office building located   development with two        mixed-used                  building located along     on Orchard Road –        hospitality icon in       Singapore Changi         Office: 1,875,610
                  at Collyer Quay           Grade A office towers       development with            Huaihai Zhong Road         preferred location for   Singapore since           Airport and close to      Retail: 308,359
                  between the Marina        and a retail mall           offices, retail and         within the established     flagship stores of       1971, Mandarin            Changi Business Park     Overall: 2,183,969
                  Bay downtown and          located in Singapore’s      serviced residences at      commercial district of     international brands     Orchard Singapore is      with seamless
                  Raffles Place             CBD at Raffles Place        Shenton Way                 Huangpu in Puxi,                                    the largest hotel         connectivity to Jewel
                                                                                                    Shanghai                                            along Orchard Road        Changi Airport           1,640 hotel rooms

Attributable      Office: 378,714           Office: 605,301             Office: 530,594             Office: 361,007            Retail : 126,283           1,077 hotel rooms          563 hotel rooms
NLA (sq ft)       Retail: 21,132            Retail: 99,370                                          Retail: 61,575

Occupancy(1)      Office: 98.7%             Office: 91.7%               Office: 92.4%               Office: 83.2%              Retail: 91.6%                       -                         -              Office: 91.7%
                  Retail: 96.6%             Retail: 95.9%                                           Retail: 82.8%                                                                                           Retail: 91.8%
                  Overall: 98.6%            Overall: 92.4%                                          Overall: 83.2%                                                                                          Overall: 91.7%

Valuation as      S$1,181.0m                S$1,799.7m(2)               S$900.0m                    RMB2,680.0m /              S$473.0m                 S$1,157.0m                S$468.5m                    S$6,524.8m
at 31 Dec         (S$2,954 psf)             (S$2,554 psf)               (S$1,696 psf)               RMB45,795 psm GFA          (S$3,746 psf)            (S$1.1m / key)            (S$0.8m / key)
2020

(1) Committed occupancy as at 31 March 2021
(2) Based on OUB Centre Limited’s 81.54% interest in One Raffles Place. OUE C-REIT has an indirect 83.33% interest in OUB Centre Limited held via its wholly-owned subsidiaries
                                                                                                                                                                                                                             28
Singapore Office Market
▪ Core CBD Grade A occupancy increased 0.6 ppt QoQ to 96.7% in 1Q 2021 on an uptick in leasing momentum and
positive net absorption. Supported by the tighter vacancy, core CBD Grade A office rents remained stable QoQ at
S$10.40 psf/mth after four quarters of correction
▪ Employment gains and a gradual recovery of the economy amidst a tight supply pipeline are expected to support future
demand, although Grade A market is expected to be main beneficiary of flight-to-quality trend
Singapore CBD Grade A Rents and Occupancy Office Supply Pipeline in Singapore (CBD and Fringe of CBD)
('000 sq ft)
11.40 11.55
11.20 11.30 11.15 11.45 11.50 1,400
10.90 11.15
10.95 10.80 11.30 10.70 40
10.60 10.40 10.45 10.40 10.40
10.25 10.10 97.6% 1,200
9.75 9.90
9.50 9.70 97.1%
96.6% 96.7%
96.1% 95.8%
9.30
9.10 9.10 9.40 96.5%
1,000
95.7% 95.9% 8.95 8.95 96.8%
95.8% 96.2% 95.2% 95.8% 95.6% 96.1% 96.1% 96.1%
95.7% 94.8%
95.2% 95.2% 94.1% 95.2% 800
95.1% 93.8%
94.6% 140
94.1% 94.1%
92.5% 600 1258
961
400 781
635
200
0
4Q13 2Q14 4Q14 2Q15 4Q15 2Q16 4Q16 2Q17 4Q17 2Q18 4Q18 2Q19 4Q19 2Q20 4Q20 2021 2022 2023 2024
Grade A rents (S$ psf/mth) Core CBD Occupancy Marina Bay Raffles Place Shenton Way / Robinson Road Fringe CBD
Note: Excluding strata-titled office
Source: CBRE Research 29Singapore Office
Demand and Supply vs Office Rental
Island-wide Office Demand, Supply and Office Rents
('000 sq ft) (S$ psf/mth)
7,000 20
6,000 18
16
5,000
14
4,000
12
3,000 10
2,000 8
1,000 6
4
0
2
-1,000
0
-2,000 -2
-3,000 -4
1990 1992 1994 1996 1998 2000 2002 2004 2006 2008 2010 2012 2014 2016 2018 2020
Demand (LHS) Supply (LHS) Prime Office Rental (RHS) Prime Grade A Office Rental (RHS)
Source: URA statistics, CBRE Research
2Q 2011 was the last period where CBRE provided Prime Office Rental data. Prime Grade A office rental data not available prior to 1Q 2002
30Shanghai Office Market
Shanghai
100.0%
9.90 10.1010.3010.30
10.5010.4010.4010.30
10.1510.21 10.26
10.3610.3510.3510.32
10.27 10.2010.10
11.00
▪ Shanghai CBD Grade A office occupancy
9.49 9.70 96.0% 9.68
95.0% 93.8% 94.0% 92.8% 9.28 9.09
9.00 8.88
10.00
remained stable at 85.1% in 1Q 2021.
95.0% 9.00
90.0%
92.6% 90.2% 89.4% 89.7% 8.00
However, rents declined 1.3% QoQ to
87.6% 87.6% 87.5%
89.8%
86.1% 86.5% 90.0%
88.4% 87.6% 85.4% 85.3% 85.1% 7.00
RMB8.88 psm/day
85.0%
87.1%
86.1% 85.4% 85.1% 6.00
80.0% 5.00
75.0%
4.00
▪ Puxi Grade A office occupancy declined
3.00
70.0% 2.00
0.1 ppt to 85.3% as at 1Q 2021, while
1Q15 3Q15 1Q16 3Q16 1Q17 3Q17 1Q18 3Q18 1Q19 3Q19 1Q20 3Q20 1Q21 rents corrected 1.2% QoQ to RMB8.54
CBD Grade A Rents (RMB psm/day) Shanghai CBD Grade A Occupancy
psm/day
Puxi
100.0%
9.0 9.1 9.3 9.4 9.5
96.3%
9.4 9.6 9.5 9.3 9.2 9.14 9.14 9.31
9.46 9.51 9.54 9.55 9.54 9.56 9.46
9.15
8.83 8.73 8.64
10.0
▪ Prospects for rental growth are expected
8.54 9.0
95.0%
92.8% 94.9% 8.0
to remain subdued given the significant
90.7% 91.5%
90.0%
90.9%
92.2%
93.6% 90.0% 92.5% 89.7% 90.2% 7.0 office supply pipeline in the CBD and
91.9%
88.5%
87.2%
85.3% 86.2%
90.4% 86.9% 86.8%
85.3% 6.0 decentralised market over the medium
85.0% 87.6%
85.7% 86.7%
85.4%
5.0
term
4.0
80.0%
3.0
75.0% 2.0
1Q15 3Q15 1Q16 3Q16 1Q17 3Q17 1Q18 3Q18 1Q19 3Q19 1Q20 3Q20 1Q21
Puxi Grade A Average Rent (RMB psm/day) Puxi CBD Grade A Office Occupancy
Source: Colliers International 31Shanghai CBD
Demand, Supply and Vacancy
Grade A Office Net Absorption, New Supply and
Vacancy Rate Office Supply Pipeline in Shanghai CBD
('000 sq m) ('000 sq m)
1,000 16.0% 700 649
900 14.0% 564
600
800
12.0%
700 500
600 10.0%
400 340
500 8.0% 311
400 300
6.0%
300 200
4.0%
200
100 2.0% 100 60
- 0.0% -
2009 2010 2011 2012 2013 2014 2015 2016 2017 2018 2019 2020 YTD 2021 2022 2023 2024 2025
2021
Zhuyuan Old Hongqiao & Gubei
Net Demand (LHS) New Supply (LHS) Vacancy rate (RHS) Xujiahui Nanjing Road West
The Bund Huaihai Middle Road & Xintiandi
Zhongshan Park Jing'an (Other)
▪ Shanghai CBD Grade A office supply expected to
abate after 2022
Source: Colliers International
32Singapore Hospitality Market
▪ Singapore visitor arrivals declined 85.7% YoY to 2.7 million for 2020 due to restrictions on inbound short-term visitors to
stem the spread of COVID-19. YTD May 2021 arrivals were down 95.9% YoY
▪ In the latest survey of the UNWTO Panel of Tourism Experts, nearly half of the experts do not see a return to 2019
international tourism levels before 2024 or later(1). The Singapore Tourism Board expects international travel to take
three to five years to return to pre-pandemic levels
▪ New hotel supply expected to be limited over the next three years
Visitor Arrivals in Singapore Singapore Hotel Supply
(million) (No. of Hotel Rooms)
Total No. of Rooms Net Increase/Decrease in Supply New Supply
Visitor Arrivals YTD May 2021 80,000
70,000
18.5 19.1 60,000
SARS Sub-Prime 17.4 COVID-19
16.4
15.6 15.1 15.2 50,000
14.5
13.2
11.6 40,000
9.8 10.3 10.1 9.7
8.3 8.9 30,000
6.1
20,000
2.7
10,000
0.1
-
2003 2004 2005 2006 2007 2008 2009 2010 2011 2012 2013 2014 2015 2016 2017 2018 2019 2020 2021
2015 2016 2017 2018 2019 2020 2021F 2022F 2023F
(10,000)
Source: Singapore Tourism Board, International Visitor Arrival Statistics, JLL Industry Sources
1) UNWTO: “Tourist numbers down 83% but confidence slowly rising”, 2 June 2021 URL:https://www.unwto.org/news/tourist-numbers-down-83-but-confidence-slowly-rising 33Hotel Master Lease Details
Property Mandarin Orchard Singapore Crowne Plaza Changi Airport
No. of Guestrooms 1,077 563
Master Lease Variable Rent Comprising Sum of: Variable Rent Comprising Sum of:
Rental (i) 33.0% of MOS GOR(1) ; and (i) 4% of Hotel F&B Revenues;
(ii) 27.5% of MOS GOP(2); (ii) 33% of Hotel Rooms and Other Revenues not related to F&B;
subject to minimum rent of S$45.0 million(3) (iii) 30% Hotel GOP; and
(iv) 80% of Gross Rental Income from leased space;
subject to minimum rent of S$22.5 million(3)
Master Lessee ▪ OUE Limited ▪ OUE Airport Hotel Pte. Ltd. (OUEAH)
Tenure ▪ First term of 15 years to expire in July 2028 ▪ First term of Master Lease to expire in May 2028
▪ Option to renew for an additional 15 years on the same ▪ Option to renew for an additional two consecutive 5-year terms
terms and conditions
FF&E Reserve Capital Replacement Contribution
▪ 3% of GOR ▪ Aligned with hotel management agreement between OUEAH and IHG
▪ Generally at 3% of GOR
(1) GOR: Gross operating revenue
(2) GOP: Gross operating profit
(3) The rental under the master lease will be the minimum rent if the amount of variable rent for that operating year is less than the amount of minimum rent
34Thank You
You can also read