City of Flagstaff Public Works-Solid Waste Section 2021 Solid Waste Plan
←
→
Page content transcription
If your browser does not render page correctly, please read the page content below
City of Flagstaff
   Public Works-
   Solid Waste Section
   2021 Solid Waste Plan

                                                               Authors and Editors
                                                               Todd Hanson, Solid Waste Director
                                                               Daniel Logan, Solid Waste Manager
Overview
                                                               Jeff Ely, Solid Waste Manager
The Solid Waste Plan provides Leadership with a general
                                                               Josh Roubik, Solid Waste Supervisor
overview of the Solid Waste program along with justification
for capital expenditures over the next five-years.             Matt Morales, P.E., Project Manager
                                                               Ken Fergason, R.G., Project Manger

                                                               2/17/2021
                                                    i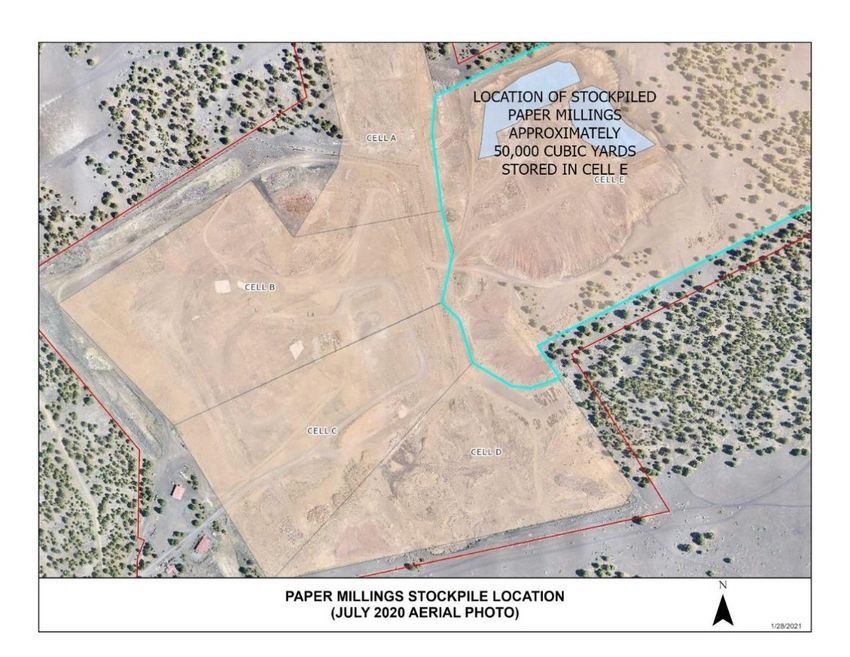
Table of Contents
Executive Summary ..................................................................................................................... i
1     Operations Summary .......................................................................................................... 1
    1.1     Structure of Solid Waste Program ................................................................................ 1
      1.1.1        Cinder Lake Landfill .............................................................................................. 1
      1.1.2        Hazardous Product Center.................................................................................... 2
      1.1.3        Collections ............................................................................................................ 3
2     Budget ................................................................................................................................ 6
    2.1     Solid Waste Program ................................................................................................... 6
      2.1.1        Collections Program.............................................................................................. 9
      2.1.2        Landfill Program.................................................................................................... 9
3     Infrastructure......................................................................................................................10
    3.1     Collections ..................................................................................................................10
    3.2     Cinder Lake Landfill ....................................................................................................10
      3.2.1        Landfill Road ........................................................................................................10
4     Other Projects Outlined in the 5-Year Plan.........................................................................11
    4.1     Gaining Efficiencies in Future Sequences ...................................................................12
    4.2     Excavation of Sequence D and E................................................................................12
    4.3     Alternative Daily Cover (ADC) Sources .......................................................................13
5     Other Programs Supported by Solid Waste........................................................................15
6     Municipal Solid Waste Diversion ........................................................................................16
7     Regulatory Compliance at CLL ..........................................................................................16
    7.1     Maintaining Regulatory Landfill Compliance................................................................16
      7.1.1        Environmental Standards for Municipal Solid Waste Landfills ..............................16
8     Conclusion and Recommendations ....................................................................................17
9     References ........................................................................................................................18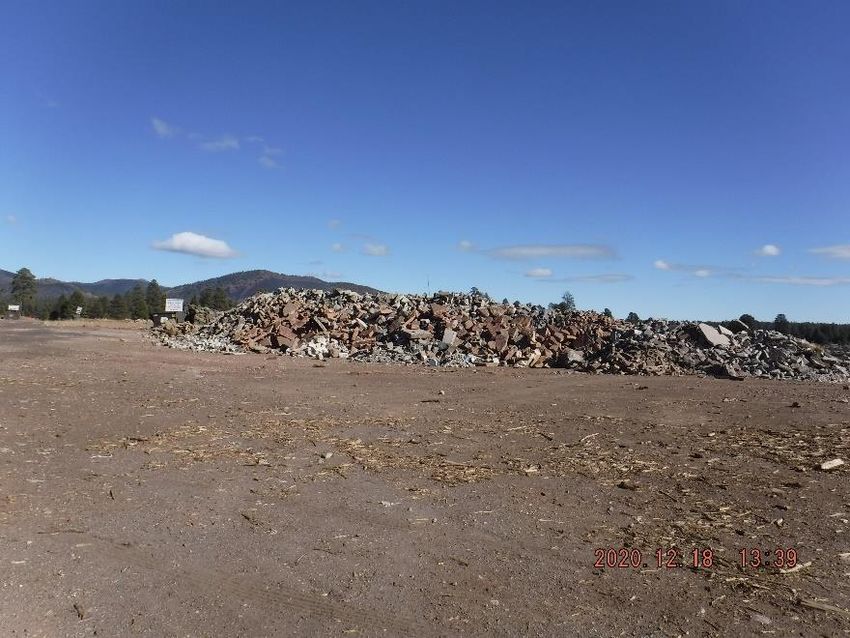
List of Tables

Table 1-Landfill Employees

Table 2-HPC Employees

Table 3-Collections Employees

List of Figures

Figure 1-Solid Waste Structure

Figure 2- HPC Waste Characterization

Figure 3-Cinder Lake Landfill Disposal Rates

Figure 4- Solid Waste Five-Year Plan

Figure 5- Five-Year Projection of Capital Expenditures

Figure 6- Map of Sequences at CLL

Figure 7- Paper Millings Stockpile Location

Figure 8- Landfill tarps as alternative daily cover

Figure 9-Cover usage measured against trash disposal in the active cells of the landfill.

Figure 10-Clean concrete stockpile
Executive Summary
In 2014, Flagstaff City Council (Council) adopted a set of goals for the community, one of which
the following:

To provide sustainable and equitable public facilities, services and infrastructure in an efficient
and effective manner to serve all population areas and demographics.

The City of Flagstaff Solid Waste Section (Solid Waste) responded to the goal by proposing the
adoption a comprehensive Solid Waste Master Plan by July 2015. The SWP goals consist of the
most relevant drivers of policy that fit within City Council goals. Any changes or additions to the
existing program should be carefully vetted out through appropriate analysis (i.e. financial
models and cost benefit analysis). The Solid Waste Plan (SWP) acts as a living document with
relevant and up-to-date program goals and objectives of the Current City Council (2021).

Solid Waste offers a wide range of residential and commercial municipal solid waste (MSW)
collection services within the boundaries of Flagstaff. In addition, limited trash services are
offered to Coconino County residents and businesses.

While the financial outlook for Solid Waste remains fair, staff continuously adjusts its projections
based on environmental regulations and market trends. With approximately 30 years of
available airspace remaining at Cinder Lake Landfill (CLL), the facility assumes the role as the
only regional landfill within the County. Although CLL is a valuable City asset, the facility will be
required to absorb considerable costs for development of future cells ($5 million) and
infrastructure ($8 million) in coming years.

Staff has noted disposal volumes consistently increase and decrease in a manner congruent to
the Consumer Price Index (CPI). However, since 2017 disposal is inversely proportional to the
CPI; in other words, while the CPI has been waning over the past few years, revenues remain
steady within the Solid Waste program. The effects COVID-19 have also presented many
unforeseen circumstances; residents are working from home are generating disposing of more
MSW. While this has kept landfill revenues steady, it also has increased the costs to operate
specialized services such as the Bulky Trash program.

The City efforts to increase diversion (recycling and reuse of materials) remains a priority.
However, the state of the recycling industry is still in flux due to the Chinese ban on imports of
recyclables. Staff will continue monitoring this with the cooperation of the Norton Environmental
(Norton) Material Recovery Facility (MRF). In the meantime, staff is exploring options in
anticipation of the 2023 expiration of our contract with Norton.

Even with a range of variables affecting the industry, the Solid Waste program continues to
provide an exemplary level of service that Flagstaff and the County have come to rely on. Given
the complexities of the economy at this juncture, staff recommends scrupulous vetting prior to
committing to any new programs or services.

                                                  i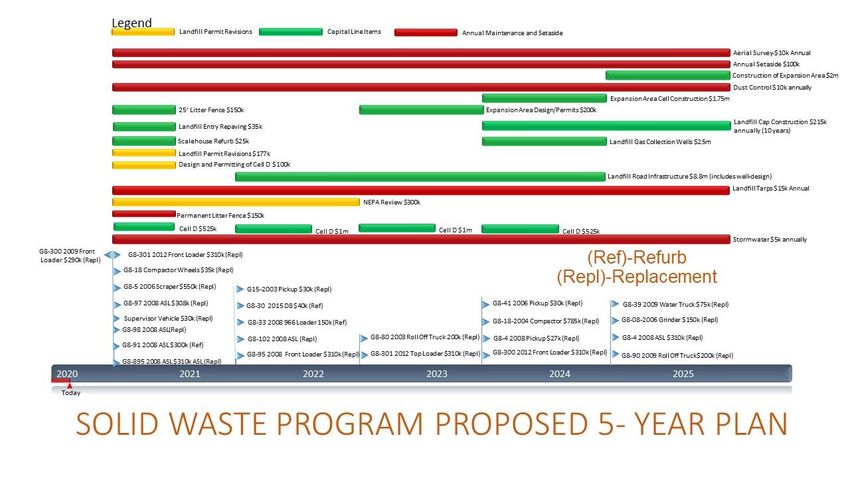
1 Operations Summary
Section 1 provides an overview of current services and the opportunities for growth within Solid Waste
Section (Solid Waste).

1.1 Structure of Solid Waste Program
Solid Waste currently maintains the following operations:

                          CITY SOLID WASTE COLLECTIONS
                       residential, commercial, institutional & industrial

                          DIVERSION                                          DISPOSAL

         RECYCLE                                   REUSE

           PAPER                 HPC                      LANDFILL COVER
        CARDBOARD                                            PAPER PULP
          PLASTIC                                           GREEN WASTE
          METAL                            PAINT              LUMBER
                                        DROP & SWAP            GLASS
                     HAZARDOUS
                      PRODUCTS
                                        COMMUNITY

                             REJECTS

          MARKET                                                             LANDFILL

                                                                                        3

Figure 1-Solid Waste Structure

1.1.1 Cinder Lake Landfill
Cinder Lake Landfill (CLL) is the only permitted landfill within Coconino County. The facility is open to
the public 6-days a week throughout the year from 7:00am to 4:30pm Monday thru Friday and 7:00am to
4:00pm Saturday. In 2020 the landfill accepted approximately 98,000 tons. The daily disposal rate is
approximately 315 tons per day.

City residents can dispose of bulky items (non-construction debris) for free, while County residents are
charged a rate of $20 per load (must be under 1 ton of waste). Otherwise, the tipping fee is $45.75 per
ton (includes a $0.25/ton tax for the Arizona Department of Environmental Quality).

There is also a County residential drop-off site at CLL where residents can bring recyclable waste
products (paper, cardboard, metal, glass, and plastic). We also provide free wood chips for all residents
to haul on their own.

                                                      1
CLL has 12 employees on the payroll as follows:
Table 1-Landfill Employees
Title Number of Employees
Manager 1 Full time Landfill Manager
Scalehouse 2 Full time and 1 part time employees
Operations All Full Time Employees-1 Supervisor, 1 Lead Worker, 3 Operators, 1 Litter Picker
Project 2 Full time employees
Management
1.1.2 Hazardous Product Center
The Hazardous Product Center (HPC) accepts approximately 173 tons of household waste from County
and City residents every year. This waste includes approximately 45 tons of paint, 40 tons of electronic
waste, 4 tons of batteries, and 47 tons of other household hazardous chemicals. This waste is sent to
vendors who recycle or repurpose these waste streams.
Figure 1-HPC Waste Characterization
There are 3 Employees at the Hazardous Product Center as follows:
Table 2-HPC Employees
Title Number of Employees
Environmental Management Supervisor 1 Full time employee
Environmental Management Technician 1 Full time employee
Environmental Management Technician 1 Part time employee
21.1.3 Collections
Commercial and residential trash collection is conducted on a weekly basis by 28 employees. They are
listed as follows:
Table 3-Collections Employees
Title Number of Employees
Collections Manager 1
Collections Supervisor 2
Collections Lead Worker 2
Operator 3 6
Operator 2 6
Operator 1 9
Current FTE Vacancies 2
Residential Trash
The residential trash collection program is responsible for servicing approximately 19,000 homes
weekly. Currently, the City is divided into 5 sections, or routes. Service days are Monday through Friday.
The 5 operators who collect these areas work 8-hour shifts, Monday through Friday. In 2018, Council
approved a 7.5% annual rate increase for residential trash collection through 2023.
Bulky Trash/Wood waste
This program is responsible for the curbside collection of household bulky items as well as tree limbs,
yard waste, etc. The work is performed by 2 trucks with 2 operators each (3 Trucks beginning late in 21-
22). The trucks are loaded with an articulated loader, purchased in FY 09/10. The loader increased
productivity and efficiencies by capturing of this green waste, which provides a source of Alternative
Daily Cover (ADC) for Cinder Lake Landfill.
Commercial Trash
The Commercial Collections program collects trash from commercial businesses, apartments and town
homes. The operation runs 6 days per week. The operators work 10-hr shifts with staggered days to
provide route coverage and meet customer service expectations. Since 2015, Arizona Senate Bill 1079
prohibited municipalities from excluding private solid waste haulers to enter the multifamily residential
properties. At this point, the bill has only slightly affected the City commercial trash services. However as
more multi-family housing is coming online there is potential that the City may lose out on valuable
contracts in the future. In 2018 City Council approved a 3% one-time rate increase on commercial trash
collection. This did not demonstrate any noticeable decrease in customer accounts.
Residential Bin Maintenance
This program is responsible for the delivery, pick-up, cleaning, and repair of residential curbside
containers. Other duties include special events, collection of white goods (weekly), collection of move- in
boxes, pre-baled cardboard, pick up and disposal of dead animals from Flagstaff’s streets (dogs, cats,
skunks, deer, etc.), snow removal when needed, and the operation of any and all solid waste collection
vehicles when needed. The position may respond to customer “emergencies” after hours or on
weekends.
3Commercial Bin Maintenance
This program is responsible for all commercial and roll off container deliveries, repairs, painting and
cleaning. Other duties include welding, fabrication, and design, delivery and pick up of temporary bins,
repairs and fabrication of gates, enclosures, etc. The position has a high degree of interaction with
internal and external customers on a daily basis and is a large factor in customer satisfaction &
retention. Both bin maintenance programs respond to customer requests within 24-hours and we
typically are able to provide same-day service. The position is also required to operate solid waste
collection vehicles when needed.
Hoist & Haul (Roll Off)
This program services commercial and residential customers with a variety of needs. Construction
materials, clean ups, grocery store and food service compactors (including NAU and Flagstaff Medical
Center), recycling, and glass recycling drop off locations are all a part of this program. The program
currently has 2 assigned operators who operate Monday through Friday, with some Saturday collections
by request. The operators work a 5-day, 8-hour schedule in the fall and winter months when activity is
slower. During the busy season they work 10-hour days.
Residential Recycling and Commercial Recycling
The residential curbside recycling program operates much like the residential trash program, with
approximately 19,000 homes to service Monday through Friday. The commercial recycle program also
operates similar to the commercial trash program and trucks operate from Monday through Friday.
From a global perspective, the recycled waste industry has been turned on its head over the past
several years. In July 2017, the Chinese Ministry of Ecology and Environment (MEE) announced that as
of January 1, 2018 they would no longer accept contaminated paper/cardboard and plastic.
In response, the EPA announced that it would work to establish national recycling goals based around a
set of measures which are as follows:
• Reduce Contamination in Recycling
• Make Our Recycling Processing System More Efficient
• Strengthen the Markets for Recycled Materials
As of January 1, 2021 the Chinese Ministry of Ecology and Environment no longer will allow solid waste
(recycling or other-wise) to be imported into the country (Recycling, 2020). China’s ban on the import of
solid waste works in concert with the Basel Convention, which seeks to control exports and imports of
most plastic scrap and waste from 187 different countries (EPA, Unknown). The United States in not
currently signed onto the Basel Convention, which complicates the potential export of plastics to
countries that could otherwise recycle the material in an ethical manner.
These series of events will require the industry and the nation as a whole to determine how far it is
willing to go for recycling to become effective and successful. Otherwise, we may be set back 40 years.
Therefore in order for recycling to become beneficial on all sides, the bulleted items need to be
reinforced with additional measures. One such measure includes the development of regional recycle
facilities. These facilities sort thousands of tons per day while providing a more efficient methods for
guaranteeing feedstock to the industries that thrive on recycled goods. City staff are currently weighing
the cost and benefit to sending recyclable waste to regional facilities in the Phoenix Metropolitan area.
4The contract with Norton Environmental expires in 2023, and the cost to Our studies have conclude that
sending this material is far more beneficial to ship recyclable goods to regional sorting facilities than it
Glass Collection
In addition to the four city glass drop-off sites and CLL, Collections offers glass collection to residential
customers on a subscription basis ($4.41/month).
Administration
The administrative staff handles all dispatch and phone calls from the public. In addition, they provide
support in accounting and book-keeping for the program. Administrative staff are posted at the Core
Services Yard and CLL scalehouse.
52 Budget
2.1 Solid Waste Program
The projected budget demonstrates a balance between responsible fiscal policy and environmental
stewardship over the next five years. Solid Waste disposal trends are typically reflective of consumer
spending habits and thereby have historically followed the Consumer Price Index (CPI) for the Western
Urban region (United States Department of Labor, Bureau of Labor Statistics, 2020). However, since
2017 disposal rates have not trended along with the CPI (figure 5). The deviation from the CPI is in 2020
is likely due to the fact that COVID-19 has compelled citizens to take on projects around their homes
while quarantining. Naturally, these homeowner projects bring construction debris to CLL. We will
continue to monitor these anomalies, but our projections show that the Solid Waste fund will continue to
remain solvent into 2021.
Cinder Lake Landfill Disposal vs. CPI
105,000 3.5%
3.3%
101,496 3.0%
100,000 2.8%
2.7%
98,077 2.5%
95,000
2.0%
1.9%
93,150
Disposal Tons-Cinder Lake Landfill
91,184 CPI
1.5%
90,000 90,145 1.4%
1.2%
88,121
1.0%
85,000
0.5%
80,000 0.0%
2015 2016 2017 2018 2019 2020
Figure 2-Cinder Lake Landfill Disposal Rates (Includes all weights-i.e. reconstruction debris)
The variability in disposal tonnage from 2015 through 2020 is something that we are adept in adjusting
for. Nevertheless, a baseline budget is still required to accommodate capital expenditures needed to
maintain minimum operational standards. This baseline budget is ranked on the following conditions:
61) Will the budget allow staff to run the Solid Waste with the necessary facilities, machinery, and
equipment while keeping the operation safe and in compliance?
2) Do expenditures maintain the minimum required 10% fund bund balance?
In 2017 staff hired R3, a well-respected industry expert to assist in projecting whether a rate increase
was necessary given the imminent capital improvement projects ($8.8 million) and fleet capital needs
($8.3 million). The result of the study indicated that rate increases in the following categories would be
necessary:
• Residential Trash and Recycling Service-7.5% increase each year for 5 years
• Landfill Fees one-time 3% increase
• Commercial Trash and Recycling Service one-time 3% increase
• Hoist and Haul Service one-time 3% increase
The approved rate-increase ensured the Section would have sufficient revenue to meet their
operational, capital, and debt service obligations as shown in Figure 6.
SOLID WASTE 5-YEAR PLAN
(INCLUDES CURRENT FISCAL YEAR)
$5.0
UNRESTRICTED FUND BALANCE
$4.5
$4.0
$3.5
(MILLION)
$3.0
$2.5
$2.0
$1.5
$1.0
$0.5
$-
2021 2022 2023 2024 2025 2026
Figure 3-Solid Waste Five-Year Plan
A detailed timeline of all expenditures is represented in Figure 7. It’s worth noting that the infrastructure
needs of Cinder Lake Landfill, more-specifically rebuilding Landfill Road, will be the biggest one-time
expenditure in program history. The initial price tag of $8.8 million is was generated based on the most
conservative estimates. However, staff continues working with consultants to refine costs based on the
most realistic trends in construction.
7Figure 4-Five-Year Projection of Capital Expenditures
82.1.1 Collections Program
Budget projections- Collections staff has budgeted flat for FY21, with minor adjustments between line
items and overtime projections to account for position vacancies, fuel costs and Fleet Services rate
adjustments. Residential collections are expected to increase the coming years especially in high
density in-fill areas for student housing. Staff is in the process of completing a rate study for Collections
and the Landfill. An increase in the residential monthly trash bills will be justified to accommodate the $5
million withdraw over 20 years (approximately $300,000 per year) to fund the shortfall from the Core
Services Yard. The results of the study will be published by spring 2018. The proposed Collections
budget items for FY 21 include:
• Replacement of 4 American LaFrance Side Loaders-$300k each
• Replacement of Ford Taurus
2.1.2 Landfill Program
2.1.2.1 Landfill Road
Landfill Road (Road), also known as Forest Road 6010, is under the jurisdiction of the Coconino
National Forest, Flagstaff Ranger District (Forest Service) and has been the primary access route to
Cinder Lake Landfill (Landfill) since 1965. Recent structural evaluations of the Road conclude that the
existing pavement is in irreparable condition. Subsequent to these evaluations, staff approached
the Forest Service with a proposal to realign and rebuild the Road. However, in order to proceed with
the formal review process, the Forest Service would need to initiate an Environmental Assessment (EA)
under the National Environmental Policy Act (NEPA) guidelines. Staff is currently working with a
Resource Consultant (EnviroSystems Management Inc.) and an Engineering Consultant (Shephard
Westnitzer, Inc.) to develop a comprehensive application for NEPA review.
Preliminary designs indicate the extension of power, in addition to utility improvements will cost the City
approximately $8.8 million. We are evaluating ways to value engineer costs lower in many respects. For
example, rather than tapping into Doney Park Water, we are evaluating the feasibility of extracting water
through an on-site well. The projected costs for this could be as much as $1.2 million. However, there
are considerable financial advantages that would be realized by having an on-site well compared to
paying monthly service fees to Doney Park Water.
2.1.2.2 Sequence D
Excavation of Sequence D is eminent and has been on the schedule for the past year. While the need
for Sequence D is as much as 7 years away, plans require excavation of over 250,000 cubic yards of
soil over the next couple years. The mining and excavation timeline requires us to have all that material
cleared before we begin to lay down the necessary liner well ahead of the 7-year timeline. At this point
the anticipated costs for excavation are projected to be $4 m over 5 years.
Other project line items for the FY 22 include:
• Landfill Compactor Wheel Replacement $35k
• NEPA Review for Infrastructure at CLL-$300k
• Annual Setaside Fund for Landfill Closure (on going)-$100k
• Portable Tarps for Daily Cover of the Landfill-$15k
• Stormwater Infrastructure-$10k
• Aerial Survey-$10k
9• Landfill Gas Sampling-$35k
3 Infrastructure
Operational expenditures in Solid Waste have traditionally been scheduled around fleet rotation and
minor capital expenditures. And while fleet capital is still an active part of the conversation, much of the
focus has turned to larger capital projects at CLL (Landfill Road and the excavation of Sequence D).
3.1 Collections
Collections does not have any proposals to incorporate new infrastructure.
3.2 Cinder Lake Landfill
Over the past 10 years CLL has planned for large infrastructure upgrades. The remainder of Section 3
addresses these.
3.2.1 Landfill Road
Note that the projected costs to rebuild Landfill Road are preliminary and will be refined based on the
Forest Service requirements (NEPA review) over the coming year.
3.2.1.1 Roadway Drainage Improvements, and Traffic Control
Asphalt pavement along Landfill Road (Road) is nearing its useful life and is beyond salvage (Speedie
and Associates, 2017). The right of way is under the jurisdiction of the Forest Service. While the City
was granted the use of the Road under a Forest Service Special Use Permit (SUP), the SUP has been
expired for many years. The Road is maintained under a joint agreement between the County and the
City. However, it does not meet the federal standards of the Highway Safety Act and the Manual on
Uniform Traffic Control Devices (MUTCD). Redesign of the Road requires widening to accommodate
additional shoulder widths, drainage, side-slopes, and overhead/underground utilities. The projected
costs for roadway, drainage improvements, and traffic control are estimated to be $2.5 million. However,
before any improvements can take place the project requires review by the Forest Service under
National Environmental Policy Act (NEPA). The timeline for the NEPA process is approximately one
year. Landfill staff is currently contracted with EnviroSystems Inc. to carry the permit through the
approval process.
3.2.1.2 Power and Telecommunications
Currently CLL has single-phase power on site. In FY 2012, CLL used approximately 89,000 kWh of
power, which cost approximately $14,000. This is a relatively small amount of consumption given the full
potential of future demand at CLL. For instance, considerations for water (see below) require a reliable
source of 3-phase power. If we had 3-phase power, we would also have the capacity to install a crane in
the Maintenance Building. Lastly, landfill gas extraction systems if they become necessary would require
blowers to be installed at CLL. The only source of power comes from the east side of Highway 89. It
would be in the best interest of the City to consider installing telecommunications lines in the same
overhead line. With that said, the right of way will limit traffic control along the Road, and it will be
especially challenging when utilities are installed. Initial estimates the cost for three-phase power with
telecommunications at approximately $1.7 million.
3.2.1.3 Water
Currently CLL relies on bi-weekly deliveries of potable water for its domestic needs. In the future, it will
be necessary to have a reliable source water for fire and dust suppression. A six-inch diameter waterline
10could be extended 1.6 miles from to an existing tee to CLL. However, Doney Park Water production
rates do not provide enough pressure to suit the needs of the daily operations, therefore a booster pump
and storage tank(s) would be necessary to provide reliable volume of water to the facility. The projected
cost for the waterline would be approximately $1.5 million (includes $750,000 for the meter and control
systems). If we consider digging our own well at Cinder Lake Landfill, it may outweigh the cost for
installation of a Doney Park waterline. As mentioned above, staff is looking at this as a potential option.
We currently are contracted with Tata and Howard to complete a preliminary evaluation for well sites. If
the locations prove feasible then we may elect to conduct geophysics to validate the evaluation.
4 Other Projects Outlined in the 5-Year Plan
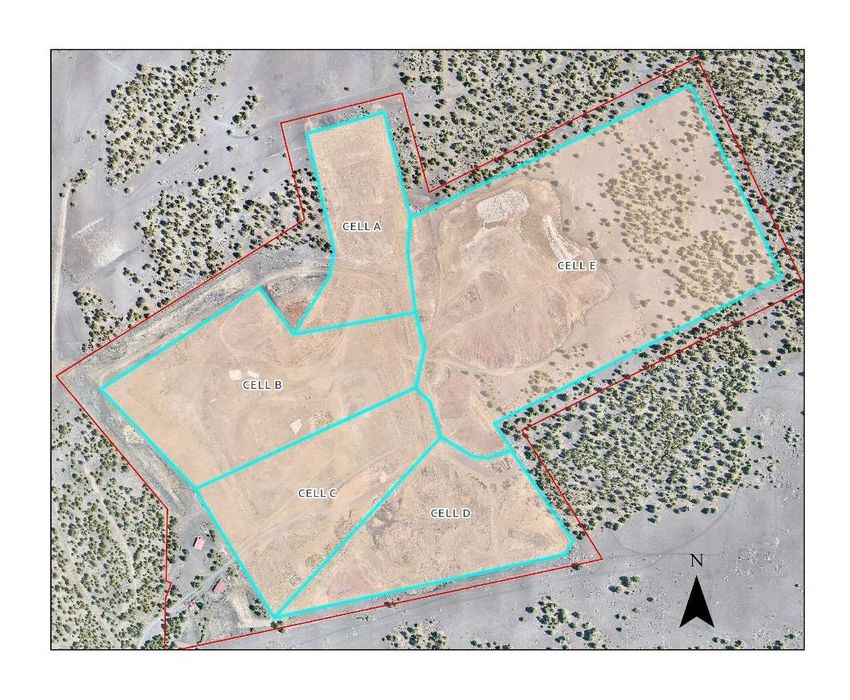
Five disposal cells are labeled in the existing design as Cells A through E (Figure 8). Cells A, B, and C
(110 acres) contain MSW since 1965. Even though Cells A, B, and C are not lined, the landfill was
permitted to continue placing MSW until the final design elevations are achieved. Subsequently, they will
have to be finished with a cap that falls within regulatory guidelines. Cells A, B, and C will last another 5
to 7 years (depending on growth rates). Expanding the operation to Cells D and E (136 acres) will
require design and construction of an approved liner.
Figure 5-Map of Sequences at CLL
114.1 Gaining Efficiencies in Future Sequences
Although the closure of Sequences A thru C will not occur for 5 to 7 years, it is necessary to realize that
those cells are more ideal to keep unfilled, while we develop the other cells. In consideration of the
future construction, staff is exploring how we may be able to incorporate advanced technologies that
would not only provide positive financial returns, but would also help subsidize the development of future
sequences. In 2013 CLL investigated the beneficial uses of landfill gas for alternative fuel vehicles
utilizing compressed natural gas (CNG) (Geosyntec Consultants, 2013). The study determined that
there was a potential benefit in converting certain fleet over to CNG with the contingency that all fleet
vehicles would be stored at Cinder Lake Landfill. However, it should be noted that CNG vehicles have
not been sufficiently engineered for elevations above 5,200 feet. Power losses at 7,000 feet can be as
much as 25% (Center, 2012).
Throughout the solid waste industry, landfills are searching for beneficial reuses of readily available
sources of construction and demolition debris (Bratkovich, 2014). Grinding and pulverizing of debris
such as wood and concrete respectively, can potentially conserve landfill airspace while providing a
reliable resource for operational cover material. We know that there is a deficit of 1.3 to 1.5 million cubic
yards of soil cover at CLL. Therefore, it is in the best interest of the facility to continually explore other
cover resources for the facility.
4.2 Excavation of Sequence D and E
The CLL Solid Waste Facility Plan acts as the guiding construction document and prescribes excavation
depths within the future expansion areas (Cell D and E). The depths established by the engineer of
record were based on the elevations for marginally rippable (extractable) rock, as determined by drillers’
logs and geophysical surveys. The engineer assumed that the desirable method of excavation was
through mechanical removal by bulldozers and excavators with minimal blasting. Since that time there
have been multiple excavations performed on-site. In addition, staff determined drilling and blasting will
be a more practical method to successfully extracting rock and soil from the site.
In fall 2012, CLL embarked on an extensive drilling and sampling operation (Speedie and Associates,
2013). The mission of the project was to determine whether it was feasible to drill and blast below the
prescribed elevation within Cell D. Results from the study indicate that excavation below the design
elevation is potentially feasible based on the following considerations:
• The in-situ rock is a potentially valuable resource to consider as aggregate for future applications
in roadway construction for the region. The nearest source of aggregate is located approximately
40 miles north of Flagstaff at the CEMEX Gray Mountain Plant.
• The “slag” generated from processing rock would decrease the existing soil deficit (1.2 to 2.6
million cubic yards).
Staff concluded that the existing design depth in Cell E could be exceeded by as much as 50 additional
feet. However, the operation would need to consider mining portions of buried MSW within Cell C to
achieve such elevations (additional discussions in Section 8 pertain to landfill mining). The additional
airspace gained over that time is likely to result in another three to five years of landfill life. Based on this
information, staff concluded that additional investigation is warranted.
In spring, 2021 Staff will solicit Requests for Qualifications (RSOQ) to qualified contractors for
excavating and processing large volumes (approximately 240,000 cubic yards) of aggregate.
124.3 Alternative Daily Cover (ADC) Sources
There is currently not enough soil to cover the entire landfill through its operational life (approximately 30
years). For seventeen years paper millings from SCA Tissue (Flagstaff) were used as ADC. However, in
June 2017 SCA closed operations. Although paper millings are no longer imported, there is still
approximately 4 years of the material stockpiled at CLL. We are also using our grinder to divert as much
green waste and lumber as possible for mixed use with paper millings. While we recognize the grinding
operation as a benefit for the “greater good”, the cost of grinding wood debris costs over $250/hour.
Figure 6-Paper Millings Stockpile Location
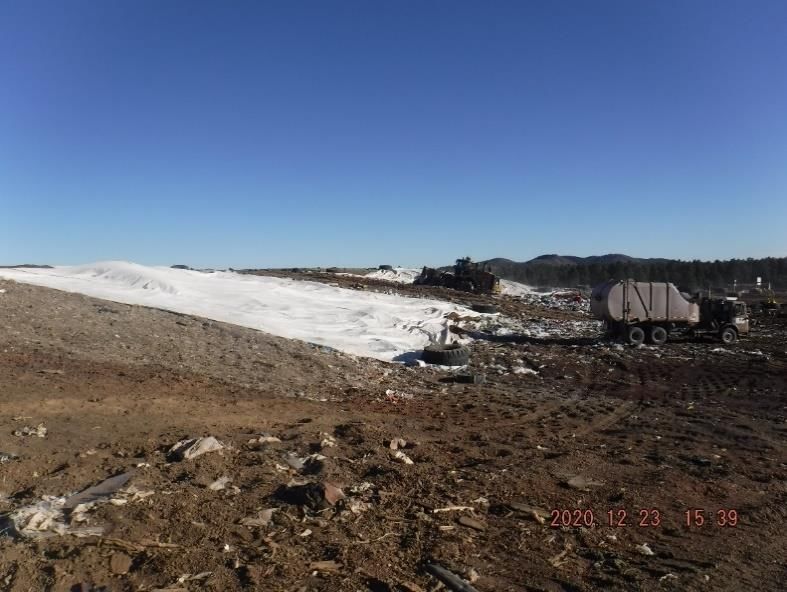
In response to the loss of imported paper millings, staff implemented portable tarps starting in lieu of
paper millings (see Figure Below). They are placed at the end of the day and removed the following
morning, thereby keeping the facility in environmental compliance while saving airspace.
13Figure 7-Landfill tarps as alternative daily cover
Figure 10 provides insight to cover usage trends verses trash disposal at Cinder Lake Landfill. We see
the consistent decrease of paper millings since 2018. Since the tarps have been implemented in 2019,
there has been an average airspace savings of 6,900 cubic yards (approximately 10-days of added
airspace per year). If tarps continue to be used, a savings of airspace will be realized to save the landfill
as much as two years over the life of the facility. Conversely, we have seen higher rates of soil cover
since 2017. The reason for the increase is that soil cover is that cells are being constructed at the
landfill. Many of these cells have been on the outside slopes of the landfill and require intermediate
cover in the form of native soil from our borrow pits. This typically means that cells will have to be
covered on 3 to 5 sides, depending on the geometry. We will likely continue to see this soil usage until
we move into future expansion areas.
HISTORIC COVER USAGE VS. TRASH DISPOSAL
70,000 105,000
60,000 99,911 100,000
CUBIC YARDS OF COVER
50,000
TONS OF TRASH
38,846 95,000
40,000 37,211
45,429 39,193
23,875 90,000
30,000 88,321
87,221
84,291 84,345 85,000
20,000
23,446 23,173 25,864 80,000
10,000 16,245 17,712
0 75,000
2016 2017 2018 2019 2020
Axis Title
Paper Millings Cover Used Soil Cover Used Disposal Tonnage
Figure 8-Cover usage measured against trash disposal in the active cells of the landfill. Disposal
doesn’t include Reconstruction Debris.
14Staff is continuously reviewing other potential sources of ADC. For instance, since 2012 staff has
received an average of 2,700 tons of inert reconstruction debris (concrete, block, and steel). The bulk of
which consists of concrete and other crushable material. Reconstruction debris has traditionally been
buried in designated cells at CLL. The reconstruction debris typically requires more dirt to cover. In
addition, it can only be buried with a dozer due to the hazards of exposed metal (rebar and corrugated
metal culverts). And while the revenue for reconstruction debris is favorable ($11.38/cy), the value of the
airspace is typically worth more for MSW ($12.65/cy).
In 2019 staff initiated a program to accept clean concrete (no trash, metal, or dirt) for a 2-year period.
We stockpiled approximately 500 tons, or 1,000 cy of clean concrete. It would take a minimum of 10
years to collect enough material to warrant crushing for daily cover. The costs to crush clean concrete
weighed against the minor airspace savings result in a net negative financial outlook. However, staff has
looked at the costs for processing mixed concrete (concrete with rebar). Scalehouse data indicates that
the disposal of mixed concrete is significantly higher than clean concrete; and mixed concrete can
provide much greater volumes of cover and gained airspace in a shorter period. Therefore, staff
proposes to start stockpiling mixed concrete in March 2021.
Figure 9-Clean concrete stockpile
5 Other Programs Supported by Solid Waste
The Solid Waste program provides ancillary benefits to programs within the City limits and beyond. The
following activities or programs are just some of the examples of support the program provides the
following services:
County Cleanup Days
Each year from late May thru early June, the County issues a one-time voucher to County residents
allowing them to dispose of MSW at no charge. Because the County tracks customer usage during this
time, the project requires an increased level of administrative support from CLL.
15Free public mulch
The public is free to pick up wood chips at the City Public Works Yard and CLL. The mulch is provided
by various contractors who occasionally dispose of clean wood chips. The wood chip pile is maintained
by CLL staff throughout the year.
Sustainability and Environmental Management Section
Projects that receive (or have received) direct support from Solid Waste include the following:
• Promotional mailings for recycling
• Manpower for collection and cleanup wildcat dump sites
• Public service events involving a community cleanup day
All other SEMS related events involving the need for solid waste and recycle bins
Flagstaff Fire Department Fuels Management Program
CLL has provided multiple levels of service for the fuels-reduction throughout the past. Subsequent to
tree thinning, CLL allows customers to bring processed wood chips to the site at no charge. The wood
chips are mixed with paper millings for ADC.
6 Municipal Solid Waste Diversion
Staff is working with SEMS to prepare a plan for increasing diversion of MSW from the waste stream.
The plan, also known as Rethink Waste, has a great deal of momentum within SEMS and Council.
Therefore, staff will be assisting SEMS to develop long-term initiatives that are intended to act as a
framework for developing financially sustainable programs and services that increase material diversion
and prevent waste (City of Flagstaff, AZ, 2017). Staff is working with Sustainability on exploring the
possibility of installing a solar array on the capped portion of the landfill in approximately 2025. Staff is
also working with the Forest service, COF Wildland Fire Operations, and GSI studying the feasibility
of placing a demonstration Biomass processing unit that would process
forest restoration/thinning biproducts and MSW.
7 Regulatory Compliance at CLL
7.1 Maintaining Regulatory Landfill Compliance
Landfill compliance at CLL typically comes with a fixed annual cost to the program (unless unforeseen
exceedances occur). There are two Project Managers in Solid Waste that manage employee training,
environmental monitoring, and reporting activities for CLL. The remainder of this section addresses any
pertinent environmental considerations that could affect the operation.
7.1.1 Environmental Standards for Municipal Solid Waste Landfills
The provisions of 40 CFR Part 60, Subpart WWW apply to landfills that commenced construction,
reconstruction or modification on or after May 30, 1991. In 2016, the EPA proposed revisions to the
1996 rules for lowering the thresholds for EG’s. The 1996 rules required GCCS to be installed for
landfills that exceed 50 Metric Tons per year (MT/yr) of Non-Methane Organic Compounds (NMOC).
However, the revisions lowered those emissions to 34 MT/yr.
16The samples from 2018 indicate that Cinder Lake Landfill is at 20.4 MT/yr, well under the 34 MT
threshold. Based on projected disposal rates CLL will have peak gas production at 32 MT/yr in 2045
(Tetra Tech BAS, 2018). It should be noted that the current gas emission rates are based on an unlined
landfill. When we move into the lined expansion cells (Sequences D and E), higher concentrations of
NMOC’s and methane are likely to be captured in those cells. While this does not pose any immediate
concern, it is certainly something to be aware of in future budget discussions.
8 Conclusion and Recommendations
The framework of the Solid Waste Section demonstrates a multitude of services that are offered within
the community and the region. The financial outlook for the program remains optimistic, and staff will
continue to make necessary adjustments as the local and regional economy will allow. Environmental
compliance is also essential to assuring the program remains a viable disposal option in the region for
years to come. Management remains committed to balancing fiscal responsibility and environmental
stewardship for the City and the region. Staff expects that the SWP will be a mechanism for
management to communicate how it intends to achieve this balance over coming years.
Although the economy appears to be favorable for FY 21 and FY22, the Solid Waste program continues
investigating where efficiencies can be realized.
Landfill Road is in imminent need of replacement. Therefore, landfill staff is committed to collaborating
with the Forest Service through the NEPA process.
As CLL nears capacity in its existing cells, landfill expansion will become a relevant discussion piece in
the coming fiscal years. The preparation and excavation of cells will present a particular challenge to the
success of the operation.
The recycle industry is currently undergoing a global crisis resulting from China’s ban on importation of
recyclables. We anticipate that the hardship will be felt down to a local level as well. In the meantime, it
will be important explore more-regional options for recycling.
Growth is expected to continue in Flagstaff for the near future due to the influx of student housing
around the NAU campus. However, from the perspective of solid waste disposal, this growth is only
reflected in a short-term basis from a construction and demolition standpoint.
Staff will make every effort to continue offering the level of service that the Citizens of Flagstaff and
Coconino County have come to expect, and we will continue to monitor and adjust to the disposal trends
in Flagstaff and the surrounding community.
179 References
Bratkovich, S. (2014). Municipal Solid Waste and Construction and Demolition (C&D) wood Waste
Generation and Recovery in the United States. Minneapolis: Dovetail Partners, Inc.
Center, P. S. (2012). Performance of Alternative Fuels at High Altitude. Paul S. Sarbanes Transit in
Parks Technical Assistance Center.
City of Flagstaff, AZ. (2017). Rethink Recycling. Flagstaff: City of Flagstaff.
Coconino County. (2003). Coconino County Comprehensive Plan. Flagstaff.
EPA. (Unknown, Unknown Unknown). https://www.epa.gov/hwgenerators/new-international-
requirements-export-and-import-plastic-recyclables-and-waste#howimpact. Retrieved from
www.epa.gov.
Flagstaff Metropolitan Planning Organization. (2014). City of Flagstaff Regional Plan. Flagstaff: City of
Flagstaff.
Geosyntec Consultants. (2013). Final Landfill Gas To energy Feasiblity Report, Cinder Lake Landfill
Flagstaff, Arizona. Oakland.
Northern Arizona Council of Governments. (1979). Solid Waste Management Plan. Flagstaff.
Pruitt, S. (2017, May 5). United States Environmental Protection Agency. Retrieved from
https://www.epa.gov/sites/production/files/2017-05/documents/signed_-_letter_-
_municipal_solid_waste_landfills.pdf.
Recycling, B. o. (2020, November 22). www.bir.org. Retrieved from https://bir.org/news-
press/news/item/china-ministry-of-ecology-and-environment-issues-announcement-on-matters-
concerning-the-completely-ban-on-import-of-solid-waste.
RW Beck. (2010). Gas Eneration Evaluation Review-Cinder Lake Landfill. Minnesota.
Slim, G. (2017). Optimization of Poymer-Amended Fly Ash and Paper Pulp Sludge Millings Mxture as a
Landfi Liner Alternative. Ann Arbor: ProQuest LLC.
Speedie and Associates. (2013). Report on Subgrade Investigation. Flagstaff.
Speedie and Associates. (2017). Reort on Geotechnical Investigation, Cinder Lake Landfill Road
Improvements. Flagstaff.
Tetra Tech BAS. (2018). Tier 2 NMOC Emission Report. Phoenix.
United States Department of Labor, Bureau of Labor Statistics. (2020, November). Retrieved from
https://www.bls.gov/regions/west/az_flagstaff_msa.htm.
WIH Group. (2020). Material Recover Facility & Recycling Alternatives Analysis. Scottsdale: WIH Group.
18You can also read