City Power Alternative Energy Strategy Presentation to PIESA Webinar 24 June 2021 Paul Vermeulen, Chief Engineer, Renewable Energy
←
→
Page content transcription
If your browser does not render page correctly, please read the page content below
City Power Alternative Energy Strategy
P re s e ntat i o n to P I ESA We b i n a r 2 4 J u n e 2 0 2 1

P a u l Ve r m e u l e n , C h i e f E n g i n e e r, R e n e w a b l e E n e r g y
E n e r g y a n d s u s t a i n a b i l i t y, a s p e c t s t o l o o k a t -

Greening of the supply, to meet carbon dioxide emission reduction targets in mitigation of
climate change risks –
     • By 2030, if the IRP is implemented ‘as is’ 34% of the energy generated in South Africa
       will be from carbon free sources. Some will be on Eskom networks, some on ours.
     • The City of Johannesburg – EISD - has a slightly higher green energy aspiration,
       targeting 35% of electricity usage from renewable energy sources by 2030.
     • For Johannesburg, this presently translates into 10 GWh of electricity per day, and if
       only from solar, this would mean that 2GW of PV generating capacity will be required.
Equally importantly - at the same time we need to:
• Improve the security of supply to all parts of the City
• Reduce the Cost of Supply from Eskom
• Reduce the cross-subsidy burden placed on Johannesburg’s C&I customers
• Build resilience against load shedding and the economic havoc that it causes
• Support EVs, an opportunity for the greening of transport, both public and private
• Economic Development - igniting regional ‘new energy’ industries, local first, Africa next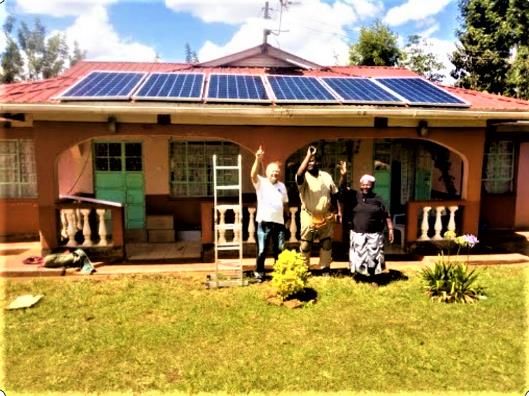
The electricity business of tomorrow –
  is being built on the business of today.

While improving and using the same grid, we are moving away
from the exclusive kWh business towards more of a network
              services based business model.
T h e J o b u r g M a r ke t - a f i n e 1 0 0 y e a r o l d i n s t i t u t i o n
   serving the community

                          An organized holding, trading and distribution system
                              equipped with a convenient trading platform

Diverse Producers                                                                 Diverse Buyers
Commercial farmers                                                                Supermarkets
Small holding producers                                                           Green Grocers
                                                                                  Restaurants           Some consumers
                                                                                                         may have their
 • Market certainty                                                                                    own veggie patch,
 • Bulk transport                                                                  • Food Security        but they still
   to one stop                                                                     • Competitive           depend on
 • Opportunity to                                                                    prices               produce that
   ‘gap-fill’                                                                      • Variety of        comes through the
 • Safety standards                                                                  products,           market. Some
   applied                       Cold storage facilities for temporal                generally          consumers don’t
                               management of produce, able to smooth                 available           have a garden.
                                out supply and demand mismatches                   • Quality control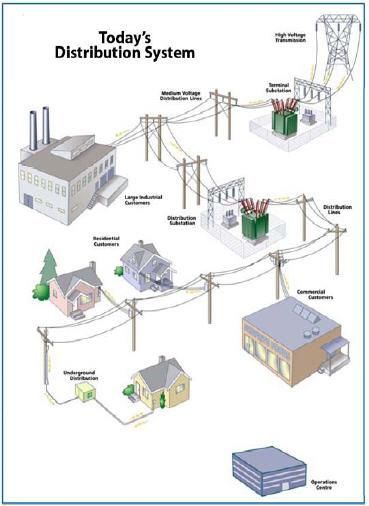
City Power – another fine 100 year old institution, but …

                       A distribution system that is metered, currently working
                              as a sole agent for Eskom and Kelvin power

                                                                                  • Load shedding
                                                                                    disruptions
Few Suppliers
Eskom 90%                                                                         • Regulated,
Kelvin 10%                                                                          escalating
                                                                                    pricing             “Prosumers” are
                                                                                  • Captive with         installing their
                                                                                    limited options    own photovoltaic
• Eskom is proving                                                                                         generating
  unreliable                                                                                          systems to reduce
• Kelvin is close to                                                                                   costs and energy
  retirement                                                                                          storage systems to
• Both use ‘dirty’                                                           Diverse Consumers         ride through load
                                                                             Residential
  generating                                                                 Industrial                shedding. 44MW
  technologies                                                               Commercial               already permitted.
                             Geyser control systems can help to match                                  Some don’t have
                               supply and demand to some extent                                       suitable roof space
R e d u c i n g C o s t o f S u p p l y f r o m E s ko m

  • Peaky load costs a lot to service
  • As a grid operator, we do benefit from the
    diversity that the community connected to the
    grid demands
  • However, the more peaky the load of our own
    customers is, the more costly it becomes for us
    to both source the power and to deliver it.
  • In reality very few loads are flat –
  • Whatever can be done to remove the kinks in
    the load curve, will reduce costs of both cost         • The ideal load – a flat line – is
    drivers
                                                             a constant demand and a
  • The supplier of last resort – this will be Eskom         predictable quantity of energy
    or the future ISMO’s new role – will be the              to be delivered
    price setter
  • The price for capacity will most likely become         • All new energy options on our
    more and more costly over time, particularly             grids must contribute to this
    during peak load periods.                                objective
Analysing Current Energy Costs

                                  • The graphic shows the load
                                    profile of the Johannesburg 275
                                    kV power system
                                  • The morning and evening peak
                                    periods are when Eskom power is
                                    most expensive.
                                    Summer peak cost is 109 c/kWh.
                                    Winter peak cost is 333 c/kWh.
                                  • The average peak cost over a year
                         Kelvin
                                    is 165 c/kWh.
                                  • Stage 1 Load Shedding
            ‘Baseload’
            Eskom                   approximates to 120 MW for
                                    these intake points
                                  • The peak pricing extends all the
                                    way into the base-load portion of
                                    the load curve
We a r e d e s i g n i n g a n e n e r g y m i x t h a t r e d u c e s E s ko m
supply costs

                                                                          • The winter load profile
                                                                            could largely be flattened
                                                                            with a coordinated
                                                                            combination of:
                                                                              • 350 MW of PV
                                                                                generation
                                                                              • 250 MW (750 MWh)
                                                                                energy storage

                                                                          • Up to stage 1 load shedding
                                                                            can be averted by supplying
                                                                            load from energy storage
                                                                            systems

                                                                          • The same combination
                                                                            applied to the Summer Load
                                                                            curve can both flatten the
                                                                            profile and begin to reduce
                                                                            peak energy purchases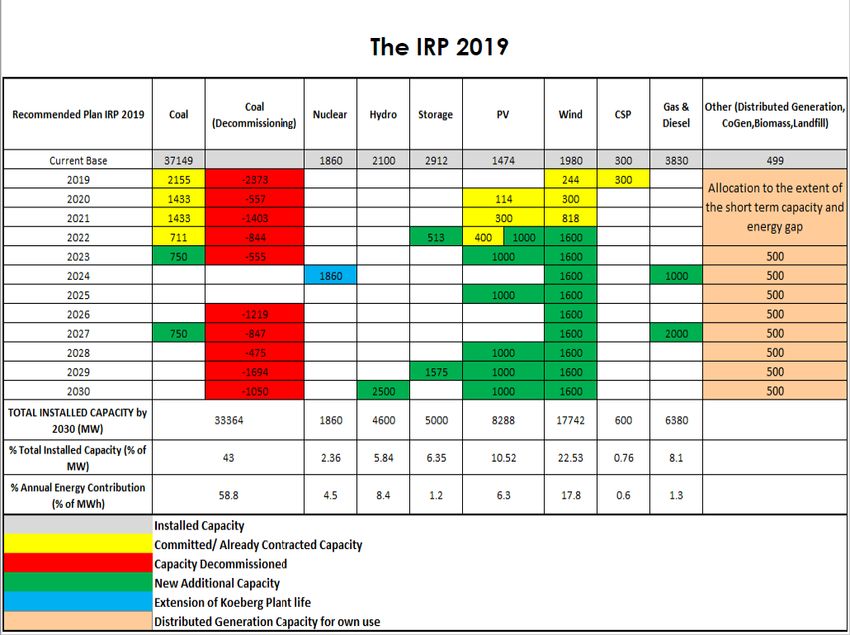
A n t i c i p a t e d M a r ke t Ev o l u t i o n

• Part of the unbundling of Eskom will mean evolving from the current artificially
  priced Eskom tariffs to a competitive Electricity Market
• In the short to medium term, it is likely that bulk supply from Eskom will only be
  made available on a TOU basis. (First indicated two years ago, the Muniflex
  tariff)
• For new energy alternatives, the trick will be to avoid long term price lock-in
  and to maintain future competitiveness
• It is most likely that Eskom will fairly quickly restructure tariffs to place much
  more emphasis on capacity charges, leading to new capacity market options
• Market dynamics – this is a fast changing environment and new technological
  developments will require continuous review of the generation plan
• The second part of unbundling will also mean restructure of the distribution
  industry, with possible creation of a trading and retail industry

  2020/2021 275 kV Network Charges:           2020/2021 275 kV Network Charges:
  Tx R 10,87 per kVA/m                        Tx R 11,62 per kVA/m
  LV Subsidy R 15,48 per kVA/m                LV Subsidy R 16,55 per kVA/m             Horizontally priced,
  Total : R 26,35 per kVA/m                   Total : R 28,17 per kVA/m                market driven pricing

           Increases are likely to accelerate over the next 5 years
NERSA Concurrence on DMRE IRP Determinations 1 & 2.
What is still available in the IRP for our plans?

                                                             Eskom confirmed
                                                             as buyer (RMPPP)
                                                             Eskom also
                                                             confirmed as
                                                             buyer (IRP)

                                                          This part of the IRP is
                                                        intended for embedded
                                                          generation. It includes
                                                      primary energy sources for
                                                         the private sector, local
                                                            government, end
                                                       customers, as well as any
                                                      distributed energy storage
                                                                 capacity
Regulatory changes and latest proposed ERA amendments
Promulgated New Generation Regulations- Proposed ERA Schedule 2 Licensing Exemption
amendments –
In order to procure power from IPPs, a
municipal distributor must: • Embedded generation systems below 100
kVA, register only with Municipality
• Prepare a technical and financial feasibility
study for any new generation or energy • Systems above 100 kVA and up to 10MW, to
storage facilities register with NERSA
• Apply to the DMRE for a Ministerial • Systems above 10 MW will still require
determination for the proposed new NERSA licensing
capacity, in terms of the IRP
• Generated power can only be used by an
• Procure the new generating capacity by ‘end user’
following Public Private Partnership
procurement process, with authorization • Where grid is used to connect generating
from National Treasury site to consumption site, entities must be
related to one anotherN e w C i t y P o w e r t a r i f f t o e n a b l e W h e e l i n g a n d Tr a d i n g
• Up until now, City Power has exclusively ‘wheeled’ Eskom and Kelvin energy
• A sustainable new option is to offer our distribution grids for transportation services between all kinds of distributed
energy sources to end customers, for the same ‘wheeling’ fee, so maintaining grid revenues
• Time discriminated wheeling tariffs will promote co-investment in energy storage systems
• Wheeling will cater for customers without suitable rooftops and connect them to those that do have and can partner
• Trading schemes also allow customers to ‘neutralize carbon’ by facilitating access to the Carbon Tax offset mechanism
• Wheeling has the potential to unleash significant private investment in clean energy at no cost to the City
City Power LPU Price: 147 c/kWh LCOE < 107 c/kWh
Eskom Price: 107 c/kWh
Proposed Wheeling
Tariffs 2021/22,
c/kWh:
Peak periods – 29,3
Standard – 35,0
Wheeling tariffs enable trading partners to generate at property A Off peak – 43,0
for consumption at property B while sustaining City Power revenueEnergy Storage – ‘Swiss Army Knife’ of the new mix
Note also:
Energy Storage can be applied to: Energy storage is not a primary
• Optimizing energy procurement costs energy source. It is a facility that
• Protecting the Economy can change the time that the
output from any low cost, true
• Preserving overloaded distribution infrastructure
primary energy source is used,
• Unlocking property development including coal fired generation.
• Supporting densification
• Optimizing Investment in renewable energy systems While it is often associated with
renewables firming, distributed or
• Providing basic energy services embedded energy storage on its
own has significant DSM and
However ~ alternative energy integration
potential for distribution system
It all depends on where it is placed on the distribution network operators.
and how it is operated:
• Benefits of stacking for better, improved DSM Great Economic Development
potential exists
• Putting storage at the door of the customer has advantagesEnergy Storage Pays its own way
GL Cost Element
890000
Analysis of simple break-even point of energy storage cost vs. maximum arbitrage potential of the Local Government Megaflex Tariff
1kWh Storage used for 6 days of the week, one shot per day, to shift 1kWh from peak to off-peak, all year round
Bulk Purchases: Eskom
Plant Parameters Megaflex 2020/21 Tariff Rates
11kV Intake point, e.g. Randburg
Technology Aspects Units Value Operational Aspects Energy Units Value
Cost of Storage System $/kWh 345 HV Distribution System Losses % 4,00%
Storage System Expected Cycle Life Number 7000 MV / LV Distribution % 3,00%
Efficiency of Charge and Discharge cycle % 80% Value of Winter Evening Energy Arbitrage c/kWh 305,11
Network Access Ch.
Finance Aspects Units Value of summer Evening Energy Arbitrage c/kWh 67,10 +
Simple payback period, no inflation considered Years 9,14439 Loss-less average value of daily arbitrage c/kWh 126,60
Rand to Dollar Exchange Rate Ratio 16,09 Average daily rate to re-charge system c/KWh 54,05 Off-Peak Energy
Local cost of Storage R/kWh 5551,05 Cycle cost to overcome system recharging losses c/kWh 10,81 +
Capital loan interest rate %pa 5,0% Cycle savings due shift of losses out of peak c/kWh 3,80
Capital Loan Term Years 10 Net average value of daily energy arbitrage c/kWh 119,59 Standard rate Energy
Cost of Finance R/kWh -1514
Total financed plant cost R/kWh 7065 Operational Aspects Network and Demand costs Units Value
+
Theoretical Plant Life, 6 days p/week, 1 cycle/day Years 22,4 Peak Period Duration hours 2 Peak rate Energy
Expected Operational Lifespan Years 15 Demand reduction potential per kWh of storage kVA 0,5
Charge / Discharge Cycles Required Number 4696 Monthly network charge per kVA r/kVA 9,43 +
Staff Operating costs R/kWh 1440 Monthly demand charge per kVA r/kVA 35,83 Network Demand Ch.
R&M Plant costs @ 10% of capital cost R/kWh 555,105 *Daily
Thisnetwork
savings isand demand
subject charge
to the savings
system beingpotential
in c/kWh 74,44
operation during the annual half hour peak.
Total Cost of Financed and Maintained Plant R/Kwh 9060
Savings on these
Total potential daily energy arbitrage and demand charges can pay for
LCOE over expected plant life 1 shot per day c/kWh 192,94 charge reduction value of 1kWh storage c/kWh 194,03 storage servicesFrom a Jo’burg perspective what do we know today?
At the same time we Lots of local Energy
National Capacity We will still need Eskom PV is Gauteng’s most
need to reduce our Storage is key to the
Shortage (Urgent!) as our Backstop for a long viable RE generation
dependence on Eskom distribution industry’s
time option
and Kelvin future
Gas Power Generation Wheeling of not only Gas for residential
Flexible load is needed, Our MV cable networks
will soon be viable in Eskom power will cooking and heating is a
EVs are flexible loads are strong and in place
Johannesburg become the new norm good option
We need to inform all
Residential customers Our obligation to cross- customers of the value of
Businesses with Energy Our affluent customers
with ES are protected and subsidize low income being part of a grid
Storage are protected think independence is
can reduce the evening residential sector will not community
from Load Shedding their best option
peak changeWhat are our best options?
Find Own Find Own Find Own
Capital – this is Capital – this is Capital – this is
limited limited prohibitive
Engage IPPs – Engage IPPs – Engage IPPs –
this requires this requires this requires
PPPs long term PPPs Long term PPPs long term
Customer
Enable Enable Gas
Energy Storage
Wheeling and Prosumers /
Programs, DR
Trading
back to back PartnershipsE n e r g y Ta r g e t s t o m e e t t h e C i t y ’s C l i m a t e C h a n g e mitigation commitments ENERGY TARGETS (MWh) Primary Energy Baseline 2021/22 2022/23 2023/24 2024/25 2025/26 2026/2027 2027/2028 2028/2029 2029/2030 Customer Embedded PV Generation - Own roof 78 894 89 413 105 192 126 230 147 269 175 320 201 618 236 682 280 512 350 640 Customer Embedded PV Generation - Traded 0 3 506 12 272 52 596 87 660 175 320 201 618 236 682 280 512 350 640 Municipal Building PV Generation 0 6 487 14 026 31 558 38 570 47 336 61 362 70 128 87 660 105 192 IPP/ FinancedMining Land PV program 0 0 8 766 43 830 122 724 262 980 315 576 350 640 525 960 701 280 IPP/ Financed Rooftop PV program 0 0 8 766 35 064 52 596 87 660 105 192 122 724 140 256 175 320 Lanfill Gas Generation and Solid WTE 26 079 26 079 26 079 26 079 249 612 249 612 249 612 249 612 249 612 249 612 Natural Gas Generation 0 0 0 0 43 830 43 830 131 490 219 150 328 725 438 300 Annual total clean energy targets (MWh) 104 973 125 485 175 101 315 357 742 261 1 042 058 1 266 468 1 485 618 1 893 237 2 370 984 Balance taken from Eskom (MWh) 10 395 027 10 689 515 10 964 349 11 158 277 11 075 581 11 130 320 11 271 081 11 428 058 11 407 849 11 329 135 Forecast Total Demand ( MWh) 10 500 000 10 815 000 11 139 450 11 473 634 11 817 843 12 172 378 12 537 549 12 913 676 13 301 086 13 700 118 Forcast Annual Load Growth % 3,00% 3,00% 3,00% 3,00% 3,00% 3,00% 3,00% 3,00% 3,00% 3,00% Percentage of Eskom Power from Clean Energy 3,00% 3,00% 7,00% 12,00% 15,00% 18,00% 22,00% 22,00% 22,00% 22,00% Eskom Clean Energy (As per IRP) 311 851 320 685 767 504 1 338 993 1 661 337 2 003 458 2 479 638 2 514 173 2 509 727 2 492 410 Eskom Brown Energy 10 083 176 10 368 829 10 196 845 9 819 283 9 414 244 9 126 862 8 791 443 8 913 885 8 898 122 8 836 725 Business As Usual CO2 Emissions (Tons) 10 665 298 10 967 442 11 249 422 11 448 392 11 363 547 11 419 708 11 564 129 11 725 187 11 704 453 11 623 692 Residual CO2 Emissions (Tons) 10 345 339 10 638 419 10 461 963 10 074 585 9 676 547 9 381 692 9 072 617 9 233 306 9 260 963 9 241 800 Annual CO2 Emission Reductions (Tons) 319 959 329 023 787 460 1 373 807 1 687 000 2 038 015 2 491 512 2 491 881 2 443 490 2 381 892 Percentage of Clean Energy used in CoJ 4% 4% 8% 14% 20% 25% 30% 31% 33% 35%
Ta r g e t s t r a n s l a t e d i n t o g e n e r a t i o n c a p a c i t i e s

                                             Baseline     2021/22     2022/23    2023/24    2024/25     2025/26     2026/2027    2027/2028    2028/2029    2029/2030
          Key Performance Indicator
                                             2019/20       Target      Target     target     target      target       target       target       target       target
    EMBEDDED GENERATION (MW) - Primary
                      Energy
 Customer Embedded PV Generation - Own roof        45           51         60         72         84          100          115          135          160         200
 Customer Embedded PV Generation - Traded            0            2          7        30         50          100          115          135          160         200
 Municipal Building PV Generation                    0          3,7          8        18         22           27           35           40           50          60
 IPP/ FinancedMining Land PV program                 0            0          5        25         70          150          180          200          300         400
 IPP/ Financed Rooftop PV program                    0            0          5        20         30           50           60           70           80         100
 Lanfill Gas Generation and Solid WTE              3,5          3,5        3,5        3,5       33,5         33,5         33,5         33,5         33,5        33,5
 Natural Gas Generation                              0            0          0          0        20           20           60          100          150         200
 Annual total targets (MW)                        48,5         60,2       88,5      168,5      309,5        480,5        598,5        713,5        933,5      1193,5
 Annual capacity increments (MW)            n/a                11,7       28,3        80        141          171          118          115          220         260

 EMBEDDED ENERGY STORAGE CAPACITY (MW)
 Customer Owned Energy Storage                      0,4         3,3        6,7       16,7        26,7        33,3         36,7         40,0         43,3         46,7
 Capital funded CP owned Energy Storage             0,0         3,1        5,1        6,7         8,3        10,0         11,7         13,3         16,7         20,0
 IPP / Financed Energy Storage                      0,0         0,0        0,0        6,7        16,7        23,3         33,3         40,0         53,3         66,7
 Annual total targets (MW)                          0,4         6,4       11,7       30,0        51,7        66,7         81,7         93,3        113,3        133,3
 Annual capacity increments (MW)        n/a                     6,0        5,3       18,3        21,7        15,0         15,0         11,7         20,0         20,0

 TOTAL EMBEDDED GENERATION CAPACITY
 (MW) -
 Annual total targets (MW)                        48,9         66,6      100,2      198,5      361,2        547,2        680,2        806,8      1046,8       1326,8
 Annual capacity increments (MW)            n/a                17,7       33,6       98,3      162,7        186,0        133,0        126,7       240,0        280,0
Photovoltaic Generation Portfolio Options -
• Customer ‘own consumption, own roof’ option –
➢ Our application process is in place, more than 44 MW has been commissioned
• Customer ‘own consumption, different roof’ supported by wheeling and trading
➢ Our wheeling tariffs have been accepted by Council for 2021/22. NERSA engagement
for approval is on-going.
• City Owned PV, located on City buildings and properties
➢ As capital is made available, we will implement. R38 million application in the 2021/22
capital budget
➢RFIs to be issued
• IPPs on City owned land (e.g. disused mining land) feeding into the grid by September 2021.
• IPP partnerships on private property (e.g. warehouse roofs) feeding into the grid Process will lead to
the establishment of
• IPPs on private land within City limits (e.g. disused mining land) PPPs.
• Energy traded in from the Eskom network
➢ This option will attract Eskom wheeling charges. In the case City Power is the off-taker,
it requires the establishment of Public Private Partnerships, endorsed by Treasury.Energy Storage Portfolio Options -
• City owned Energy Storage, located at City buildings and property
➢ As capital is made available, we will implement.
Application for R35 million is in the 2021/22 capital budget
• Energy storage service providers (IPPs) located on City owned properties (e.g. substation sites and old
transformer houses)
➢ The service is to be funded through the Bulk Purchases Operating Budget, RFI to be issued in September 2021
• Residential customer DSM and Energy Storage program, and
• Residential Sectional Title / Reseller customer DSM and Energy Storage program
➢ To partner with ESCOs to promote conversion to Time of Use Tariffs, coupled with the deployment of energy
storage, renewable energy sources, gas cooking and heating appliances and DSM measures on a shared benefit
basis.
• Key customer Energy Storage Program, aimed at:
➢ Promoting LPU customer investment in energy storage systems to reduce energy costs through tariff arbitrage
➢ At present to use as a protection measure against load shedding.
➢ Subsequently developed into a demand response scheme for the ISMO, with City Power as the aggregatorEnergy projects funded from ‘Own Capital’
Projects funded through the normal MFMA regulated Capital budget:
• The City, guided by its Integrated Development plan compiles a CAPEX budget
• The amount of capital available is dependent on the City’s balance sheet
• The available capital is not sufficient to cover all of the City’s needs and aspirations - the
budget is prioritized and allocations are made accordingly.
• In the case of capital for City Power projects, our top priorities at present are network
refurbishment, network expansion and electrification projects
• In terms of power generation projects, limited capital funds are available for such projects
and they are co-located and done in conjunction with energy efficiency projects on City
owned buildings
• Application is also made to the DME for Energy Efficiency and DSM funding from the Division
of Revenue Act allocations from National TreasuryEnergy projects funded from ‘Own Capital”
• Capital Project Pipeline
FY Category Project Comment Target Budget
Rm
20/21 Renewable First Phase EE and Feasibility Studies for 23 buildings 3,7MW 8
Energy rooftop PV on City complete, phase 1 to target first 3 large
Power and CoJ buildings. Tender documents to be issued
Buildings in July 2021
21/22 Renewable Second phase EE Phase 2 to target the next 12 buildings, 8MW 30
Energy and rooftop PV on continuing on above project
City Power and CoJ
Buildings
21/22 Energy Battery Energy Specifications are being prepared to start 1,2 MWh 15
Storage Storage System for procurement in July 2021
CP Reuven
Complex
21/22 Energy Battery Energy Specifications are being prepared to start 4 x 1MW 30
Storage Storage, Feeder procurement in July 2021 6MWh
Relief ProgramEnergy projects funded through Green Bonds or IPPs
Energy Sustainability Energy Sustainability Energy Sustainability
Status Quo
Market Report Decision Support Scenario and Strategy
The Minister of Minerals and Energy Gazetted New Generation Regulations for
Municipalities, 16 October 2020:
• A needs assessment and feasibility study must be done to initiate the process
• Municipality must include the proposed energy mix in their Integrated Development Plans
• Municipality must apply to the Minister for a determination on the technologies and capacities
required
• For CP, an RFI process will be conducted to confirm feasibility and test possible options
• As capital funding arrangements are outside of the normal municipal CAPEX process, the
Municipality must follow Treasury Section 16 regulations – the Private Public Partnership
procurement process has to be followed
• Typically, the PPP process will take 36 months to complete and is to be done on a ‘per project’ basis
• The process requires the engagement of Transaction Advisors and National Treasury approvalsEnergy projects funded through Green Bonds or IPPs
Projects requiring the PPP procurement process:
FY Category Project Pipeline Comment Potential Investment
Yield Potential
R Bn
21/22 Renewable Large Rooftop An RFI to be developed and 50 MW 0,7
For Impl. Energy Customer IPP advertised in September. The concept
by 2025 Partner, PV is to call for interest in an IPP program
program that uses warehouse type PV rooftops
feeding into CP 11 kV network
21/22 Renewable IPP PV farm An RFI to be developed and 150 MW 1,3
For Impl. Energy program for CoJ Advertised by September. The concept
by 2025 owned old mining is to offer old mining land, unsuitable
land / old Mining for building construction for PV farms
Company land within the City Limits
21/22 Energy Battery Energy An RFI to be developed and 25 MW Fund from
For Impl. Storage Storage System for advertised in September. Energy 75 MWh OPEX, Bulk
2025 Substations and Storage IPPs can offer energy storage Purchases
Overloaded services to CP for daily arbitrage Line Item
Feeders revenues or source capital for BOT type
contracts
21/22 Gas Cottesloe Gas An RFI to be developed and 20 MW 1,8
For Impl. Powered Powered advertised in September. Cottesloe is
by 2024 Generation Generation Project an existing Gas Turbine Site, the
proposal is to renew the generating
plant with modern technologyEnergy projects funded by the private sector
City Power has drafted wheeling tariffs for the 2021/2022 FY
• This should allow ‘private generators’ to supply ‘private off-takers’ on the City Power
grid, for equivalent revenues that would have been earned by supplying the end
customer with conventional Eskom Power
• The private off-taker remains a (captive) customer of City Power for network access
and the balance of the power supply required
• The City of Johannesburg’s commercial customers have access to significant capital
funding, both the businesses and the property owners
• All we aim to do is provide favorable business conditions (tariffs) and open grid access,
and promote the concept
• Traders may play an aggregating role. Use of system and clearing agreements in
development
• This is most likely the fastest route to economic development in the energy spaceEnergy projects funded by the Private Sector
• Customer partner programs
FY Category Project Comment Potential Private
2030 investment
Target Value
21/22 Renewable Customer trading To promote customer investment in PV 200MW 2,6 Bn
Energy and Wheeling systems offering the Grid for trading and
Program wheeling, earning revenues from the
‘transport’ of energy.
21/22 Energy Residential and To promote investment in energy storage 30 MW 0,3 Bn
Storage and Sectional Title and DSM at residential customers, aimed 90 MWh
DSM ESCO partnership specifically at reducing the evening peak
program
21/22 Energy Customer Energy Target our top 300 key customers with 100 MW 2,1 Bn
Storage Storage Program tariff incentives to make their own 300 MWh
investment in BESS systems, assimilate into
a Demand Response Program for back to
back Contract with Eskom.
21/22 Gas Gas Prosumer There are Gas Generators willing to 30 MW 0,9 Bn
Powered Program unlock developments with Gas Powered
Generation Generation, with surplus for sale to City
PowerPresentation Conclusion
Thank youYou can also read


