Clark Digital Commons - Clark University
←
→
Page content transcription
If your browser does not render page correctly, please read the page content below
Clark University
Clark Digital Commons

School of Professional Studies                                                       Master’s Papers

5-2021

Employee Retention Rate
Lila Sorenson

Follow this and additional works at: https://commons.clarku.edu/sps_masters_papers

   Part of the Business and Corporate Communications Commons, Communication Commons, Human
Resources Management Commons, Information Security Commons, Management Information Systems
Commons, Marketing Commons, Nonprofit Administration and Management Commons, and the Public
Administration Commons

EMPLOYEE RETENTION RATE                             1

                          Employee Retention Rate

                               Lila Sorenson
                              Clark University
                                 Capstone
                                   MPA
                              Mary Piecewicz
                               May 31, 2021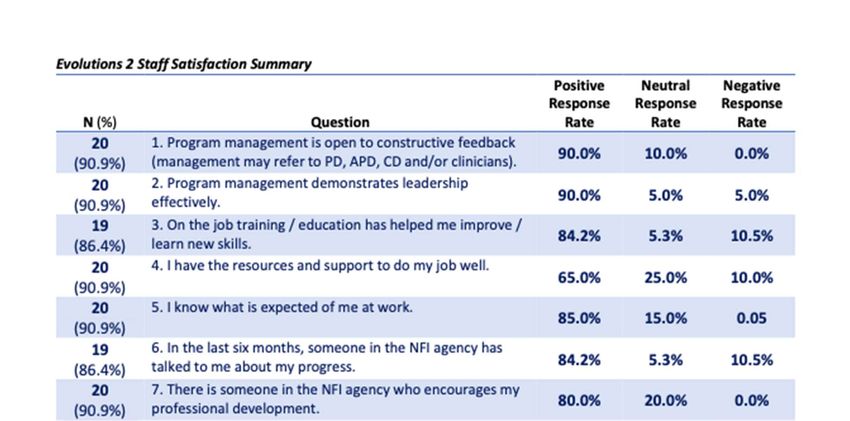
EMPLOYEE RETENTION RATE                                                                          2

Acknowledgement

For my Master’s in Public Administration Final Capstone Project, I have worked with the non-
profit organization National Family Institute (NFI). NFI is an intensive residential treatment
program (IRTP) providing trauma informed care to adolescents.

The stakeholders impacted by this project include NFI’s corporate office, the Director of
Intensive Residential Services, the human resources department, and joint commission.

I would like to give a special thanks to my faculty advisor Mary Piecewicz as well as my
supervisor at NFI, Michelle Mead.
EMPLOYEE RETENTION RATE                                  3

                          Table of Contents

Executive Summary …………………………………………………………………………… 4

Introduction ……………………………………………………………………………………. 5

Trends in the Industry …………………………………………………………………………6-7

Methods ……………………………………………………………………………………….8-10

Results ……………………………………………………………………………………….10-12

Conclusion …………………………………………………………………………………...12-13

Appendices ………………………………………………………………………………......14-34

References …………………………………………………………………………………...35-36
EMPLOYEE RETENTION RATE                                                                                 4

                                       Executive Summary

       This paper addresses the following problem regarding low employee retention rates in

non-profit mental health organizations, specifically at NFI. The problem at hand is that majority

of staff at NFI have an average length of stay of one year or less. The purpose of this paper is to

address the current problem and hypothesize factors that could impact the low retention rates.

Additionally, the purpose of the paper is to brainstorm potential solutions regarding the low

retention rates and suggestions of how to implement the solutions. The documents contained in

this paper include data analysis of employee average length of stay, the number of restraints that

occurred between the years of 2014-2021, and the results of NFI’s staff satisfaction surveys.

       The problem of low staff retention must be addressed as it can lead to a spiral where

increased low retention leads to further low staffing. This is due to the pressure and stress that is

placed on staff having to work in an environment that is already short-staffed. One solution to

this issue is to ensure employees receive weekly supervision to improve communication and

provide a space for staff to receive positive feedback. Another solution is making sure direct care

staff attend interface each day as that will improve consistency. The last solution is to have a

monthly newsletter sent out to all staff with important decisions to be made and a place where

staff can give their opinion in order to help them feel more involved in important situations. By

implementing these solutions, we will hopefully be able to increase employee retention rates and

reach the ultimate goal of having reliable staffing.

       By following the suggested recommendations within the timeline outlined in the results

section, NFI will be taking the correct steps to help increase employee retention rate and overall

satisfaction in the workplace.
EMPLOYEE RETENTION RATE                                                                             5

Introduction

       NFI is a non-profit organization providing support and care for those with various mental

health challenges. I work specifically at NFI Evolutions, which is the focus of this project. NFI

Evolutions is a two-floor program located in the Worcester Recovery Center Hospital. We

provide adolescents with trauma-informed care and provide support and treatment for suicidal

ideation and self-harm. While the program functions as a residential community-based program,

we are a locked-in facility located inside a hospital. The program functions as community-based

because a goal of ours is to work towards the point where the clients can get out into the

community. Pre-COVID the clients were able to go to the movies and other fun events if they

had been safe the previous week.

       I have worked at NFI for 8 months and throughout my time I have noticed our limited

staffing. The problem at NFI that I am tackling for this capstone project is the low employee

retention rate. We were incredibly understaffed and could not keep those numbers up. This had

been a pattern in previous years as well. This project is analyzing employee retention rates at

NFI as well as in other mental health organizations across the United States. This project hopes

to achieve a solid analysis of retention rates across non-profit mental health organizations further

showing the problem that the retention rates are too low. The project will also include a list of

ideas and potential solutions to help increase employee stay. The goal of this project is to provide

evidence of NFI Evolutions’ low employee retention rates as well as to hypothesize a cause.

Additionally, the goal is to provide potential solutions to increase these rates amongst its

employees. The purpose of this project is to analyze employee retention rates and interpret

potential factors that may be influencing the negative retention rate at NFI. The scope of the

project is to present an analysis of employee retention rates amongst staff at NFI.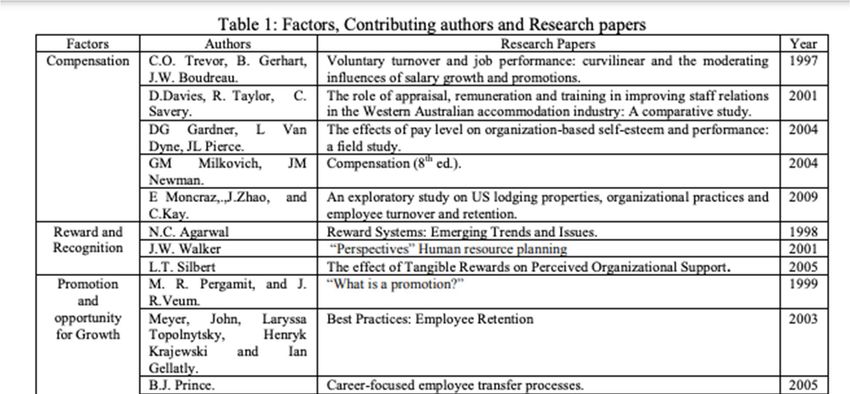
EMPLOYEE RETENTION RATE                                                                              6

Trends in the Industry

       The low employee retention rates in the mental health industry, more specifically non-

profit organizations, do not just impact the employees themselves, but also members of society.

If we have a decrease in mental health workers, then there are fewer providers available for the

general population. In appendix X, Nellie Galindo, a social worker, (2020) shares that there will

be a plethora of shortages within the industry by 2025. One question that is important to ask is, is

it the number of health care workers decreasing that is causing this shortage, or rather is the

number of individuals who need services increasing? Galindo attributes the decrease in mental

health care workers to the fact that “behavioral health professionals are aging out of the

profession faster than they can be replaced, leading to a retirement drain on the industry”

(Galindo, 2020).

       AXA Insurance (2019) wrote an article discussing potential reasons for low retention

rates. One reason, which is also mentioned throughout the paper, is the cycle relating to staff

leaving and the impact it has on the rest of the staff (see Appendix XI). The paper mentions

different reasons as to why the employee retention rate is low. Fitz-enz (1990) concluded that

low retention rates are based on multiple components (Kossivi, Xu, and Kalgora (2016).

       The literature mentions the importance of not just keeping employees rather “the

retention of valued skills” (Lahkar Das & Baruah, 2013, pp. 8). This relates to a staff suggestion

made in the employee satisfaction survey regarding keeping ‘qualified’ staff. Money is another

factor at play for employee retention that was mentioned by Galindo (2020), Kossivi, Xu, and

Kalgora (2016), and Lahkar Das and Baruah (2013). Appendix XII goes into more detail

surrounding the connection between money and employee retention within the literature.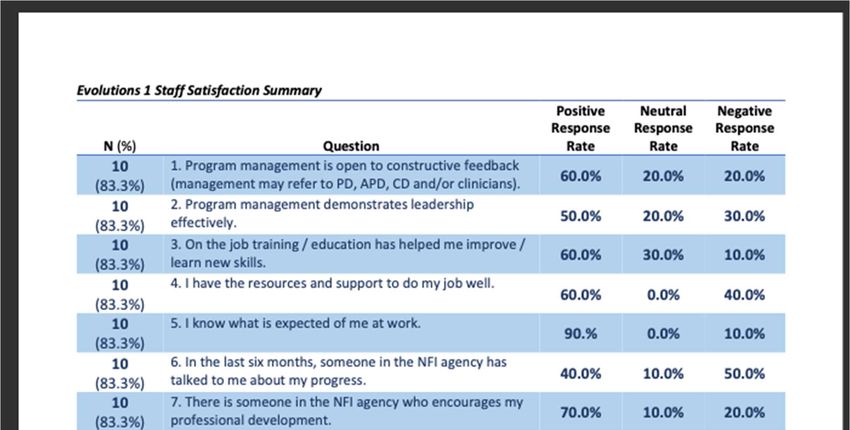
EMPLOYEE RETENTION RATE                                                                              7

       As mentioned in the literature, a yearly survey is not always the most accurate in

providing detail on employee retention rates. This is important to acknowledge because while

this paper did not utilize solely the yearly survey it was a resource used to analyze and

hypothesize reasons for retention rates and therefore must be pointed out as a limitation. “Many

managers and executives realize that an annual survey may not provide sufficient or timely

intelligence about potential turnover. Critical events at workplaces can occur suddenly, such as

departure of a beloved leader, termination of desired benefits, or massive layoffs of colleagues”

(Lee, Hom, Eberly, & Li, 2018, pp. 90).

       Killu (1994) and Krueger (2007) conclude that the reason for low retention rates

specifically in a residential program is “low pay, demanding working conditions, lack of

recognition in value of their work and lack of input in important decisions” (Ochoa, 2012, pp.

107). Ochoa’s article also points out this so-called circle of negative retention rates stating that “a

steady decrease in staff can lead to inadequate care and more burnout of the staff that remains”

(2012, pp. 107). Pazratz (2003) and Rose et al., (2010, pp. 107) state that “there needs to be an

increase in job satisfaction and commitment, which in turn, will lead to a longer stay in the

organization”.

Methods

       For this project, I utilized NFI staff satisfaction surveys, staff retention and length of stay

statistics, and an analysis of NFI Evolutions restraint data (see appendices I-IV). NFI conducts a

yearly employee satisfaction survey in order to find out what is working in the company and

what needs improvement. For the purpose of this project, I have analyzed the staff satisfaction

surveys from 2019 and 2020. The survey gets sent out yearly to all staff via their employee

email. The surveys are anonymous and optional to complete. The limitations surrounding this
EMPLOYEE RETENTION RATE 8
survey were that the direct care staff don’t always check their emails and may have missed this
survey opportunity. If staff are working on the floor and check their email, they may be unable to
respond to the survey at the moment and not willing to do so when they are home.
Administrators, however, have much more time to fill out the survey as they spend more time
working at a desk with their email in front of them. If there are more administrative staff filling
out the survey, then there is a much lower external validity as they have different experiences
than the direct care staff.
In addition, I analyzed staff length of stay and created graphs for employee retention
rates for the years 2014 through 2021 (see appendix V). I also analyzed the restraint data and
graphed that for the years 2014-2021. The restraint data was used as a method in this project
because it was hypothesized that the number of restraints would play a role in employee
retention rate.
I don’t think there are any ethical concerns regarding the way this research is being
conducted, but there are ethical aspects that need to be taken into special consideration. This
includes following HIPAA and patient confidentiality when it comes to researching, analyzing,
reporting, and hypothesizing.
Data analysis: Possible hypotheses for lower employee retention rates at NFI Evolutions
includes the circle of negative retention rates. What this means is that having constant new
employees, as well as an understaffed community, puts more pressure and stress on the current
staff on top of an already stressful position which could further lead to staff resigning. According
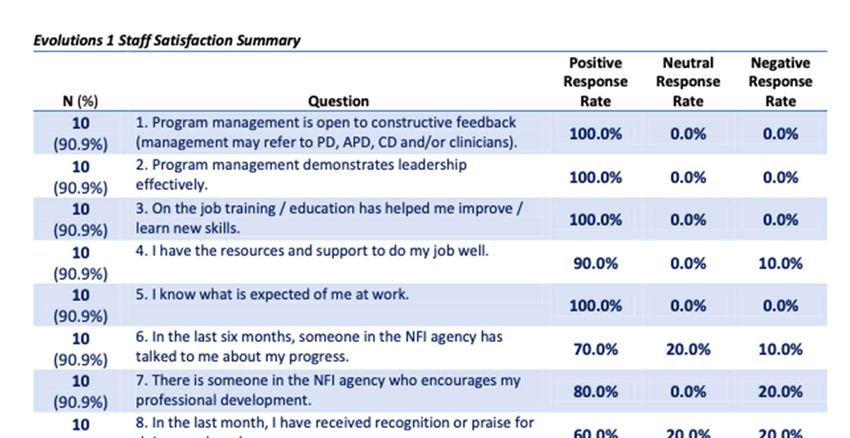
to the 2020 NFI employee satisfaction survey, some areas in need of improvement included
communication as well as “hiring and retaining qualified staff” (appendix I). The survey from
2019 also stated that there could be an improvement in communication and employee retention.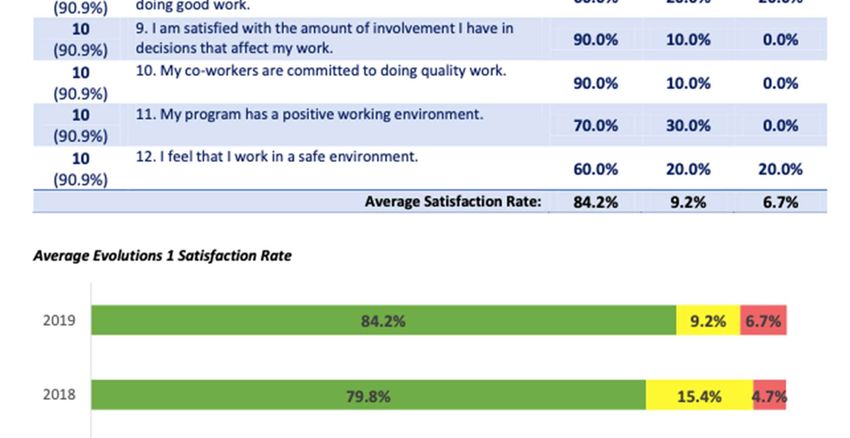
EMPLOYEE RETENTION RATE                                                                             9

This shows that NFI as a whole did not improve enough upon communication or employee

retention rates between the years of 2019 and 2020 which could be a contributing factor in

negative retention rates.

       Looking specifically at NFI Evolutions I and II there is not much of a consistent pattern

among the data. A quarter of Evolutions I staff in 2020 ranked the program as a 5/10 while

another quarter ranked the program 10/10 (see appendix V). It is also important to keep in mind

that this is only 25% of the 25.5% of staff that took the survey. 30% of the 20% of Evolutions II

staff who answered the survey, ranked the program a 4/10 in 2020. While that was the mode, the

overall distribution was still skewed toward the right.

       The staff retention data graph is skewed to the left for the years 2014-present further

demonstrating that the majority of employees worked for one year or less (see appendix III &

IV). This data provides us with an example of the circle of negative retention rates and quick

turnover. The restraint data shown in Appendix V. displays an increase in restraints between

2014 to 2018 with restraints peaking in 2018 and decreasing significantly in 2019. There is an

increase in restraints in 2020 and then decreases slightly in 2021. Based on this graph there may

be a positive correlation between the number of restraints and low retention rates for the year

2018 as well as the years leading up.

Results

       Based on the staff length of stay data presented in the appendices we can state that NFI

Evolutions is suffering from a negative employee retention rate. To further back up that point,

the employee satisfaction surveys for all of NFI for the years of 2019 and 2020 state that

improvements could be made when it came to “hiring and retaining qualified staff”. We have

found that communication, consistency, reliable staffing, receiving positive feedback, and
EMPLOYEE RETENTION RATE 10
employee involvement in decisions are factors that employees wish the company could improve
upon. There is a positive correlation between these factors and high employee retention rates.
Without solid communication, employees may feel not as prepared or feel as though they
are not heard or cared about which in turn could lead to lower employee retention rates. Without
consistency, employees may feel lost or overwhelmed which may contribute to lower retention.
Not receiving positive feedback leads to employees second-guessing their abilities and working
in a world of uncertainty. Hearing positive feedback allows for staff to feel better about
themselves and the work environment as well as surround themselves with positivity thus
improving retention rates. Not being able to partake in certain decisions for the company leads to
staff feeling as though they have no control or voice in their work environment or that their ideas
and opinions don’t matter. Lastly, having unreliable staffing or constantly being short-staffed
puts excess pressure on other staff which in turn leads to more low retention rates amongst
employees.
Potential solutions to address the lack of communication would be to ensure that every
staff member receives regular supervision. A potential goal would be that by the 2023 fiscal
year, every NFI employee will be receiving weekly supervision. Consistency could be met
through recurring supervision as well as through interface. Every floor staff member must attend
interface to improve communication and provide an opportunity for staff to understand plans and
obtain the same information about clients and scheduling which would further increase the
consistency in the workplace. A goal for the program would be by the 2022 fiscal year staff will
be attending interface each day 15 minutes before the start of their shift. Supervision would also
provide a place for staff to receive positive praise for their performance. It would also be
beneficial for employees and supervisors to provide staff with positive feedback throughout theEMPLOYEE RETENTION RATE 11
week to help boost morale and confidence. A potential solution for improving employee
involvement in decision factors would be sending out a weekly newsletter on updates and ideas
in the making with encouragement for staff to respond. A goal would be to implement the
weekly newsletter by the end of the first month of the 2022 fiscal year. Ideally, through
implementing each of these suggestions we would be providing a solution for the improvement
of the issue surrounding reliable staffing.
It is also important to note that working at a place like NFI does not offer a lot of
incentives. The pay is low, there is a high risk for injury, and the clients you work with do not
demonstrate gratefulness all that often. While there are many reasons as to why we work here, it
can be a difficult place to work due to low incentive. One suggestion would be to do an
employee raffle every month or go back to doing an employee of the week. Additionally, having
staff bonding events would also be motivational as the staff could form a stronger community.
Limitations:
One major limitation is surrounding data collection. The NFI Evolutions employee
surveys in 2020 only had a 25.5% response rate for Evolutions I and a 22.2% response rate for
Evolutions II (see appendices V & VI). For 2019 Evolutions II had a response rate of 55.5% and
Evolutions I was at 28.2% (see appendices VI & VII). The response rate reflected a very small
percentage of the employees with the exception of Evolutions II in 2019 which had just over half
of the employees respond. This impacts the validity of the survey since such a small number of
people responded. Additionally, the direct care staff have less access to their email during work
hours than the administrative staff which may have led to an influx of administrative staff
responses and fewer responses from individuals in other positions.EMPLOYEE RETENTION RATE 12
COVID-19 has had many effects on employee retention rates throughout this past year.
This project primarily focused on a general analysis of retention rates from 2014-2021, but it is
important to address environmental factors and other outside components that may impact the
problem at hand. While there are similar patterns in employee retention throughout the years, as
is displayed in the graphs beginning in appendix III, it is important to note that between 2020 and
2021 COVID-19 did play a role. During COVID, a lot of businesses shut down. Since NFI is an
inpatient residential program, it did not shut down and it did not lay off any staff. That being
said, staff may have chosen to leave the company due to health and safety concerns. A limitation
is that we do not have specific information regarding why employees left, but due to the large
effect the pandemic had it was an important factor to consider. For further research, it would be
interesting to see if COVID negatively impacted employee retention at residential places due to
fear or if it didn’t play much of a role due to the organizations not closing or letting people go.
Summary Conclusion
The major issue that was discovered was the negative employee retention rate at NFI. We
are constantly understaffed which puts pressure and stress on the current staff to do their job and
other jobs. That excess work leads to the current staff having a negative relationship with the
work environment. Another issue that was discovered was that staff complaints on the employee
satisfaction surveys had not been met between the years 2019 and 2020. That shows that the
company did not make progress or take adequate strides to improve upon its employees’ original
suggestions and concerns.
The main recommendations made are that all staff will receive weekly supervision, all
floor staff will attend interface before their shift, supervisors and staff will more often provide
employees with positive affirmations and positive feedback, and there will be a monthlyEMPLOYEE RETENTION RATE 13
newsletter outlining potential decisions for the company with room for employees to respond
with suggestions.
Reflection
I always had my fair share of frustrations working in an understaffed already stressful
environment. With my position, I did not receive much supervision and completed most of my
tasks independently. My interactions with others administratively would generally depend on me
reaching out for help or a new project. It wasn’t until I started weekly supervision again that I
felt heard within the company and started to find my place here. From that, I was able to learn
about my professional development and growth and discovered that I need a supportive
environment and check-ins in my workplace. With regards to the client (NFI) I learned that we
were not as productive in implementing and improving employee suggestions in 2019, which
was reflected by the employee satisfaction survey in 2020. Throughout my research on the issue
of low employee retention rates amongst mental health organizations, I have become more aware
of the difficulty and challenges within the field and more appreciative of myself and my
colleagues’ abilities to perform these tasks.EMPLOYEE RETENTION RATE 14 Appendix I
EMPLOYEE RETENTION RATE   15

Appendix II
EMPLOYEE RETENTION RATE                                                    16

Appendix III.

                2020-Present Staff Who Left Service LOS
   P
            45
   E
            40
   R
            35
   C
            30
   E
            25
   N
            20
   T
   A        15
   G        10
   E         5
   S         0
                    ≥1 1≥2 2≥3 3≥4 4≥5     5≥6 6≥7 7≥8 8≥9 23≥24
                                          Years

                2018-2019 Staff Who Left Service LOS
  P    60
  E
       50
  R
  C    40
  E    30
  N
       20
  T
  A    10
  G     0
  E             0≥1 1≥2 2≥3 3≥4   4≥5 5≥6 6≥7 7≥8 8≥9 9≥10 10≥11 22≥23
                                          Years

            2016-2017 Staff Who Left Service LOS
  P     50
  E
        40
  R
  C     30
  E
  N     20
  T
        10
  A
  G         0
  E                 ≥1   1≥2      2≥3    3≥4 4≥5       5≥6    6≥7    7≥8
  S             12≥13                     Years
EMPLOYEE RETENTION RATE 17
Appendix IV.
2014-2015 Staff Who Left Service LOS
P 50
E 45
R 40
35
C
30
E
25
N
20
T
15
A
10
G
5
E 0
S ≥1 1≥2 2≥3 3≥4 4≥5 5≥6
Years
Current Staff Retention Rates
P 40
E 35
R 30
C
25
E
N 20
T 15
A
10
G
E 5
S 0
≥1 1≥2 2≥3 3≥4 4≥5 5≥6 6≥7 7≥8 13≥14 15≥16 20≥21
YearsEMPLOYEE RETENTION RATE 18
Appendix V.
Restraint Data
300
250
Number of 200
Restraints
150
100
50
0
2014 2015 2016 2017 2018 2019 2020 2021EMPLOYEE RETENTION RATE 19 Appendix VI.
EMPLOYEE RETENTION RATE 20
EMPLOYEE RETENTION RATE   21

Appendix VII.
EMPLOYEE RETENTION RATE 22
EMPLOYEE RETENTION RATE   23

Appendix VIII.
EMPLOYEE RETENTION RATE 24
EMPLOYEE RETENTION RATE   25

Appendix IX.
EMPLOYEE RETENTION RATE 26
EMPLOYEE RETENTION RATE   27

Appendix X.
EMPLOYEE RETENTION RATE                                                                     28

Appendix XI.

Taken from https://www.axa.com.sg/blog/small-business/5-key-drivers-of-employee-retention

“Some direct consequences of poor employee retention are increased
costs and lower productivity and team morale. When somebody in the
company leaves within only a few months of being hired, the time and
money spent during the hiring and onboarding process are lost. Having to
start the hiring process all over again thus results in increased expenses.
Restarting the training process also lowers efficiency. Additionally, office
morale is affected as other employees might have to temporarily take up
additional tasks. Gradually, they might lose confidence in management
and also end up leaving.”
EMPLOYEE RETENTION RATE   29

Appendix XII.
EMPLOYEE RETENTION RATE                     30

Appendix XIII.

           School of Professional Studies

                    Lila Sorenson
                   Project Charter
                 Employee Retention
EMPLOYEE RETENTION RATE 31
Table of Contents
TABLE OF CONTENTS ................................................................................................ 31
1 PROJECT OVERVIEW .......................................................................................... 32
1.1 INTRODUCTION ……………………………………………………………………………….…………………….32
1.2 MAJOR STAKEHOLDERS ............................................................................................... 32
2 PROJECT GOAL AND SCOPE ............................................................................... 32
2.1 PROJECT GOAL .......................................................................................................... 32
2.2 PROJECT SCOPE ......................................................................................................... 32
3 ASSUMPTIONS .................................................................................................. 33
4 CONSTRAINTS ................................................................................................... 33
5 RISKS ................................................................................................................ 33
6 COMMUNICATION STRATEGY ........................................................................... 33
7 PROJECT TEAM.................................................................................................. 33
8 ROLES & RESPONSIBILITIES OF PROJECT TEAM . ERROR! BOOKMARK NOT DEFINED.
9 MEASURES OF SUCCESS..................................................................................... 34
10 STAKEHOLDER SIGN-OFF ................................................................................... 34EMPLOYEE RETENTION RATE 32
1 Project Overview
1.1 Introduction (The introduction provides a brief summary of what the project is designed
to achieve, along with some background information on why the project is being done –
the business drivers, the opportunity to be exploited, costs to be reduced etc.)
The problem detected within the company of NFI was employee retention rates. We were
incredibly under-staffed and could not keep those numbers up. This had been a pattern in
previous years as well. The project is analyzing employee retention rates at NFI as well as in
other non-profit mental health organizations in MA as well as across the United States. This
project hopes to achieve a solid analysis of employee retention rates across non-profit mental
health organizations further showing the problem that the retention rates are too low. The
project will also include a list of ideas and potential solutions to the employee retention rates.
1.2 Major Stakeholders (List all the key stakeholders (decision makers and anyone who will
be impacted by the project outcomes).
Corporate
Agency Supervisor
HR department
Joint Commission
2 Project Goal and Scope
2.1 Project Goal (Define the high level goals of the project).
The high-level goals of this project are to point out the low employee retention rates and try to
develop solutions to increase employee retention rates.
2.2 Project Scope (The project scope details the work to be taken in order to achieve the
project goal. It is just as important to explicitly state what is not included in scope as it is
to state what the project will deliver).
In Scope: Analysis of employee retention rates amongst staff at NFI. General
information about employee retention rates at other non-profit mental health organizations.
Out of Scope: Specific detailed numbers regarding employee retention rate in other
organizations across the country.EMPLOYEE RETENTION RATE 33
3 Assumptions (An assumption is anything the project team or client considered to be true,
real or certain often without any proof or demonstration. List in bullet format).
Workers in non-profit mental health organizations are not paid enough.
Working in non-profit mental health organizations is really hard work which leads to
burn-out quickly.
4. Constraints (Anything that restricts or dictates the actions of the project team. These can
include the so-called 'Triple Constraint'- the 'triangle' of time, cost and scope - and every
project as project drivers has one or two, if not all three project constraints).
It will be hard to be able to find detailed data regarding employee retention rates for other
non-profit similar organizations across the states. It will be hard to eliminate external validity in
the data, but we can and will acknowledge its existence.
5 Risks (Risk is any unexpected event that might affect the people, processes, technology, and
resources negatively or positively by the project)
By pointing out the lack of money we make or the negatives of these organizations that lead to
lower employee retention rates it might encourage or give employees the idea to leave the
company as they can earn greater benefits elsewhere.
6 Communication Plan (Describe how the project team will communicate effectively with
team members, the client and the capstone advisor).
(For capstone thesis/case study students this section is not required)
I am working by myself. I will be collaborating with NFI’s agency supervisor regarding my
progress, process, and results of the project. I will be communicating with my capstone advisor
for each deadline I have as well as if I have any other questions.
7 Project Team (List the project team members involved in the project including the client
and capstone advisor). (For capstone thesis/case study students this section is not
required)
Lila Sorenson; client= NFI; Capstone advisor: Mary Piecewicz.EMPLOYEE RETENTION RATE 34
8 Measures of Success (Detailed measurements that will indicate that the project is a
success)
Project Outcomes Measure of Success
Employees stay for greater than 1 year in the
Increase of employee retention rate. company.
NFI yearly employee survey is positive. 75% or more of employees are happy at work.
9 Stakeholder Sign-off
(For capstone thesis/case study students only capstone advisor signature is required)
This project charter has been signed off by the client, capstone advisor and project team
members.
Lila Sorenson Employee retention rates 03/10/2021
Name Title Date
___________________ _________________ _______________
Name Title DateEMPLOYEE RETENTION RATE 35
References
Beidas, R. S., Marcus, S., Wolk, C. B., Powell, B., Aarons, G. A., Evans, A. C., Hurford, M. O.,
Hadley, T., Adams, D. R., Walsh, L. M., Babbar, S., Barg, F., & Mandell, D. S. (2016). A
Prospective Examination of Clinician and Supervisor Turnover Within the Context of
Implementation of Evidence-Based Practices in a Publicly-Funded Mental Health
System. Administration and policy in mental health, 43(5), 640–649.
https://doi.org/10.1007/s10488-015-0673-6
Bodjrenou K., Ming X., Bomboma K. (2016). Study on Determining Factors of
Employee Retention. Open Journal of Social Sciences, 4(5), 261-268.
doi: 10.4236/jss.2016.45029
Das Lahkar Bidisha & Baruah Mukulesh (2013). Employee Retention: A Literature Review.
14(2), 8-16.
Galindo, N. (2020, October, 22). Factors that Affect Behavioral Health Provider Retention.
Relias. https://www.relias.com/blog/factors-that-affect-behavioral-health-provider-
counselor-retention.
Kim, Y.-J., Lee, S.-Y., & Cho, J.-H. (2020). A Study on the Job Retention Intention of Nurses
Based on Social Support in the COVID-19 Situation. Sustainability, 12(18), 7276. MDPI
AG. Retrieved from http://dx.doi.org/10.3390/su12187276
Lee, Thomas; Hom, Peter; Eberly, Marion & Junchao, Li (2018). Managing employee retention
and turnover with 21st century ideas. Elsevier. Vol. 47, pp. 88-98.
http://dx.doi.org/10.1016/j.orgdyn.2017.08.004EMPLOYEE RETENTION RATE 36
Ochoa, Miranda. (2012). Staff perceptions and experiences at a residential treatment center. The
Undergraduate Research Journal at the University of Northern Colorado. Vol. 2 Article
8. Pp. 1-13.
5 Key Drivers of Employee Retention. (2019, November 1). Axa. Retrieved May 2, 2021 from
https://www.axa.com.sg/blog/small-business/5-key-drivers-of-employee-retentionYou can also read