Climate change and the Limestone coast wine region - Darren Ray Senior Meteorologist/Climatologist - AWRI
←
→
Page content transcription
If your browser does not render page correctly, please read the page content below

Climate change and the Limestone
coast wine region

               Darren Ray
               Senior Meteorologist/Climatologist
               South Australian Regional Climate Services
               Centre
               Bureau of Meteorology
               d.ray@bom.gov.au
Outline

• Climate change science

• Observed trends and changes impacting viticulture
  – globally to locally

• Sources of information about climate change

• Forecasting information for climate change
  adaptation

CO2
                                                                     (ppm)

Atmospheric CO2 concentrations reached 400 parts
                                                                         400

per million in 2013                                                      380

                                                                         360

We have put a large pulse of greenhouse gases into
                                                                         340

the atmosphere over a short period                                       320

                                                                         300

                                                                         280

                                                                         260

       Carbon dioxide concentrations over the last 800,000 years         240

                                                                         220

                                                                         200

800      700        600       500          400      300     200    100

                           Thousands of years ago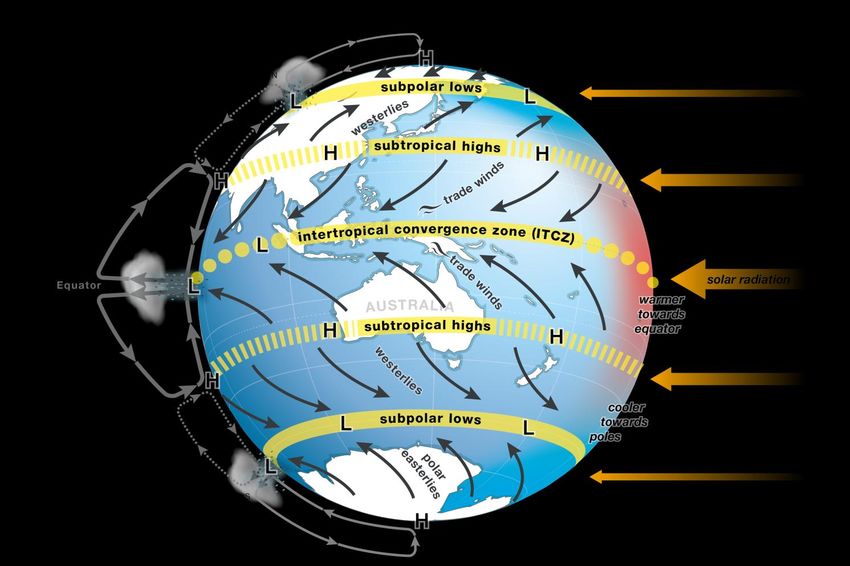
What are those higher levels of greenhouse gases
                                     doing?

                      Less heat is being
                      measured escaping to
                      space by satellites

More heat is being measured
coming back to the surface…
2.3 watts/square metre

                                      The amount of extra heat being trapped
                                      in the Earth climate system is equivalent
                                      to 4 Hiroshima bombs per second
The amount of trapped heat that
ends up being measured in surface
air temperature

  2014 is very likely to be the
  new hottest year on record
  globally

                                    Global surface air temperature from various centres
Australia is warming, on land and in the
                           oceans

2013 was hottest year on record for Australia and South Australia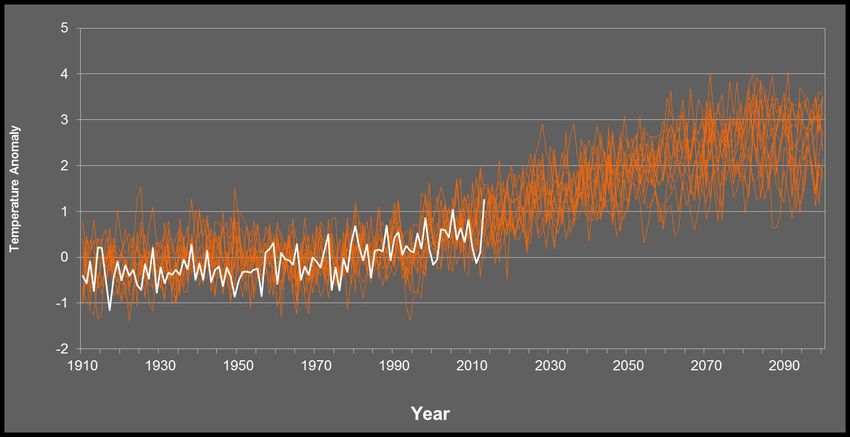
Climate trends
                               and changes

Warming by ~ 1.0C,
particularly at night and in
spring

Earlier bud burst and
flowering resulting in
earlier harvests in late
summer
Mean January
Temperature

What’s going on?

Australian extreme
  temperatures

About a 2-3 x increase in
extreme days
Changes in weather patterns

Decreased April
to October
rainfall
Changes in weather patterns

Sub-tropical ridge
Southern Annular Mode
 Negative phase                                   Positive phase

A measure of how contracted the westerly winds are around Antarctica
Changes in weather patterns

Not from natural
variability
Strong April-June
drying trend
Changes in weather patterns

Stronger sub-tropical ridge
over southern Australia

and SAM is trending upwards
SAM observations and projections

                          Has
                         implications
                         for SE coast
                         weather
                         patterns and
                         rainfall
                         Impacts
                         Antarctic sea
                         ice
Changes in weather circulation patterns The strength of high pressure weather patterns is strongly related to April to October and to global temperature… rainfall Correlation between rainfall and sub-tropical ridge intensity
Australia's future is very likely to be hotter

                                             Range of modelled future annual temperatures (CMIP5 RCP4.5 )

              Observed annual temperature

Averaged over Australia and over the calendar year
Useful reports
Australian Academy of Science climate change science
update (August 2010)Forecast information for climate change adaptation
BoM Next Generation Forecasting
                               system

• 7 day forecasts
across all of SA
on a 6km grid

• Now available
through MetEye

• MetEye - your
eye on the
environment,
bringing BoM
observations
and forecasts
together in one
place.
www.bom.gov.au
MetEye The Next Generation forecasting system allows more information out 7 days ahead for a point or as maps/grids Key features: GIS enabled data Zoom/pan Multiple forecast element overlay & marine (waves) Includes observations, radar, satellite overlays Potential to add profiles such as Agriculture profile
Evapotranspiration (Eto) data for
                                irrigation

•   Daily past Eto
    figures derived
    from BoM
    weather
    stations
•   On our
    ‘Agriculture’
    page from the
    BoM homepage

•   7 day forecast
    Eto is in
    development
BoM seasonal outlook information
has just been re-vamped
• Updated climate outlooks
page
• Interactive
• Grid point detail
• Monthly and
seasonal
outlooks
• Multi-week forecasts—ability
to forecast across timescalesPOAMA
bridging the gap between the week ahead
and the season ahead
Maximum
temperature
POAMA gives useful predictions of
heatwaves 2-6 weeks ahead
Observed daytime temperature anomalyProviding information across a
range of timescales
7 day forecasts
3 month block seasonal
outlook
BoM is moving toward more specific
products across a range of timescalesPredicting extremes – BoM pilot
heatwave warning service
POAMA outlook 5th January 2014 for third Pilot heatwave forecast Observed Temperatures
week of January Week ending 21 January 2014Summarising… • There is direct evidence of the impact of increasing ghg’s • Seeing temperature increases globally, nationally and locally, and increased heat extremes • Weather patterns are changing –MJT?, • Improved forecasting across timescales allows climate change adaptation • Reducing emissions as much as possible is a smart way to go
Thank you

d.ray@bom.gov.au
You can also read