Climate Finance in the Arab Region - Technical Report - Undocs.org
←
→
Page content transcription
If your browser does not render page correctly, please read the page content below
Distr.
                                                                                  LIMITED
                                                                                  E/ESCWA/SDPD/2019/TP.10
                                                                                  27 December 2019
                                                                                  ORIGINAL: ENGLISH

                         Economic and Social Commission for Western Asia (ESCWA)

                  Climate Finance in the Arab Region
                                              Technical Report

                                                      United Nations
                                                       Beirut, 2019
_______________________

Note: This document has been reproduced in the form in which it was received, without formal editing. The opinions expressed are
those of the authors and do not necessarily reflect the views of ESCWA.

19-01340
Contents

List of abbreviations……………………………………………………………………………………………….. iii

Executive summary…………………………………………………………………………………………………. v

I.     Introduction .........................................................................................................................................1
       A. Evolution of International Negotiations related to Climate Finance..............................................1
       B.     Climate Change in the Arab Region ..............................................................................................5
II. International Climate Finance Flows.................................................................................................7
       A. International Public Climate Finance Flows from Developed to Developing Countries ...............9
       B.     International Private Finance Flows.............................................................................................21
       C.     Dedicated Climate Funds .............................................................................................................25
III. Climate Finance Instruments to Attract Additional Finance ........................................................43
       A. Risk Mitigation Instruments .........................................................................................................43
       B.     Blended Finance: Joint Private and Concessional Public Finance ...............................................44
       C.     Green Bonds, Green Sukuk ..........................................................................................................48
       D. Payment for Ecosystem Services .................................................................................................51
       E.     Results-based finance ...................................................................................................................52
       F.     Debt for Climate Swaps ...............................................................................................................52
       G. Carbon Credits .............................................................................................................................53
IV. Summary of Key Findings and Conclusions ...................................................................................56
       A. Key Findings ................................................................................................................................56
       B.     Conclusion ...................................................................................................................................59
Appendix A.................................................................................................................................................61
Bibliography...............................................................................................................................................67

                                                                   List of Tables
Table 1              Climate Fund Financing in the Middle East and North Africa, 2003-2018 .........................26
Table 2              Dedicated Climate Funds .....................................................................................................28
Table 3              Resource Allocation Floors: GEF-6 and GEF-7 ..................................................................33
Table 4              Indicative GEF Resource Allocation Floors among Arab Countries, USD millions ...........34
Table 5              Adaptation Fund Country Cap and Project Implementation, in USD millions ....................35

                                                                   List of Figures
Figure 1             Evolution of Climate Change Negotiations ...........................................................................2
Figure 2             Climate Finance Characteristics.............................................................................................4
Figure 3             Global Climate Finance Flows Reported by the UNFCCC, by Source, 2016 .......................8
Figure 4             Segmentation of International Public Finance Flows from Developed to Developing
                     Countries: Annual Average for 2015-2016 ..........................................................................10
                                                                              i
Figure 5    Climate Finance Flows from Developeda to Developingb Countries ...................................10
Figure 6    Public Financial Support from Developed to Arab Countries through Bilateral,
            Regional and other Channels, 2016 .....................................................................................12
Figure 7    Total Public International Finance Flows from Developed Countries to Arab
            States through Bilateral, Regional, and Other Channels, 2015 and 2016 ............................13
Figure 8    Type and Purpose of Public International Bilateral, Regional, and Other Climate
            Finance from Annex II Parties to the Arab Region..............................................................13
Figure 9    Public Financial Support from Developed Countries to Arab States through Bilateral,
            Regional, and Other Channels, 2016....................................................................................14
Figure 10   Public International Finance Flows from Developed Countries to Arab States
            through Bilateral, Regional, and Other Channels, by Sector and Type of Finance
            Instrument, 2016 ..................................................................................................................15
Figure 11   Recipient and Purpose of Climate Finance from MDB’s Own Funds, 2013-2018 ..............17
Figure 12   Source and Purpose of Co-finance Mobilized by MDBs, 2013-2018..................................17
Figure 13   MDB Adaptation and Mitigation Finance by Region, 2018 ................................................18
Figure 14   MDB Adaptation and Mitigation Finance by Region, Historical ........................................19
Figure 15   Share of MDB Finance Flows to MENA .............................................................................20
Figure 16   2018 MDB Adaptation Finance by Sector and Region (USD millions) ..............................20
Figure 17   2017 MDB Mitigation Finance by Sector and Region (USD millions) ...............................21
Figure 18   Private and Public Finance Flows in Three Sectors, 2016 (USD billions) ..........................22
Figure 19   Climate Funds ......................................................................................................................25
Figure 20   Climate Dedicated Funds .....................................................................................................30
Figure 21   Regional Share of Multilateral Climate Fund Commitments...............................................30
Figure 22   GCF Financing Commitments, 2015-2018 ..........................................................................31
Figure 23   Distribution of GCF Financing, 2015-2018 .........................................................................32
Figure 24   GCF Financing by Instrument, 2015-2018 ..........................................................................32
Figure 25   GCF Financing to Arab Countries, 2016-2018 ....................................................................32
Figure 26   GCF Financing to Arab Countries by Type, 2016-2017 ......................................................32
Figure 27   Number of Accredited Entities.............................................................................................36
Figure 28   Allocation of Funds by Accredited entity ............................................................................36
Figure 29   Number of Implementing Entities of Dedicated Multilateral Climate Funds
            compared with Funds Distribution by Type of Implementing Entity ..................................37
Figure 30   Distribution of GCF Funds by Accredited Entities (% of total funds), 2015-2018 .............38
Figure 31   Distribution of GCF Financing by Sector, 2015-2018 .........................................................41
Figure 32   Distribution of GCF Financing, 2015-2018 .........................................................................41
Figure 33   Distribution of GCF Financing Instruments, 2015-2018 .....................................................41
Figure 34   Blended Finance can Adjust the Risk/return Profile to Attract Private Investors ................46
Figure 35   Evolution of the Green Bonds Market .................................................................................49
Figure 36   Green Bonds Issuers.............................................................................................................49
Figure 37   Use of Green Bond Proceeds ...............................................................................................50
Figure 38   Historic Clean Development Mechanism and Joint Implementation Issuances
            and CER prices.....................................................................................................................54

                                                                   ii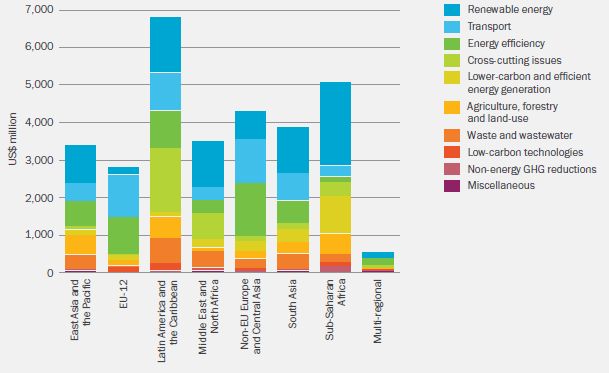
Abbreviations

AAAA     Addis Ababa Action Agenda
ADA      Agence pour le Développement
ADB      Asian Development Bank
AF       Adaptation Fund
AfDB     African Development Bank
BA       Biennial assessment and overview of climate finance flows
BRs      Biennial Reports
CBD      Convention on Biological Diversity
CDG      Caisse de Dépôt et de Gestion
CDM      Clean Development Mechanism
CERs     Certified Emission Reductions
CIF      Climate Investment Funds
CMA      Conference of the Parties serving as the meeting of the Parties to the Paris Agreement
CO2      Carbon dioxide
COP      Conference of the Parties
CPI      Country Performance Index
CRF      Caribbean Resilience Fund
CTF      Clean Technology Fund
DAC      Development Assistance Committee
DfC      Debt for Climate
EBRD     European Bank for Reconstruction and Development
EGO      Amundi Planet Emerging Green One
EIB      European Investment Bank
ELD      Economics of Land Degradation Initiative
ERUs     Emissions Reductions Units
ESCWA    Economic and Social Commission for Western Asia
ETS      Emissions Trading Systems
FDI      Foreign Direct Investment
GBI      GEF Benefits Indicator
GCF      Green Climate Fund
GDP      Gross Domestic Product
GDPI     GDP-based index
GEF      Global Environment Facility
GHG      Greenhouse Gas
GNI      Gross National Income
IDBG     Inter-American Development Bank Group
IFAD     International Fund for Agricultural Development
IFC      International Finance Corporation
INDCs    Intended Nationally Determined Contributions
INGO     International nongovernmental organisation
IUCN     International Union for the Conservation of Nature
IsDB     Islamic Development Bank Group
JI       Joint Implementation
JOD      Jordanian Dinar
LCU      Local Currency Units
LDCs     Least Developed Countries
LDCF     Least Developed Countries Fund
LULUCF   Land Use, Land Use Change and Forestry
                                            iii
MDBs Multilateral Development Banks
MDGs Millennium Development Goals
MENA Middle East and North Africa
MIGA Multilateral Investment Guarantee Agency
MOPIC Ministry of Planning and International Cooperation
NAP National Adaptation Plan
NAPAs National Adaptation Programmes of Action
NDA National Designated Authorities
NDCs Nationally Determined Contributions
NGOs Non-Governmental Organizations
ODA Official Development Assistance
OECD Organization for Economic Co-operation and Development
OOF Other Official Flows
PES Payments for Ecosystem Services
POPs Persistent Organic Pollutants
PPPs Public-Private Partnerships
RAF Resource Allocation Framework
REDD+ Reduce Emissions from Deforestation and Forest Degradation in Developing Countries
RMUs Removal Units
SCCF Special Climate Change Fund
SCF Standing Committee on Finance
SDGs Sustainable Development Goals
SIDS Small Island Developing States
STAR System for Transparent Allocation of Resources
UNCCD United Nations Convention to Combat Desertification
UNCDF United Nations Capital Development Fund
UNCITRAL United Nations Commission for International Trade Law
UNDESA United Nations Department for Economic and Social Affairs
UNDP United Nations Development Programme
UNEP United Nations Environment Programme
UNFCCC United Nations Framework Convention on Climate Change
USD United States Dollars
WBG World Bank Group
WFP World Food Programme
ivExecutive Summary
The United Nations Framework Convention on Climate Change (UNFCCC) represents the global umbrella
for undertaking negotiations on climate change. The adoption of the Paris Agreement in 2015 is considered
a historic turning point in the negotiations, and significant progress has been made since then to
operationalize the agreement. Key negotiated items include the nature of nationally determined
commitments for pursuing climate action, and the responsibility for developed countries to provide
financial and non-financial resources to support climate action by developing countries.
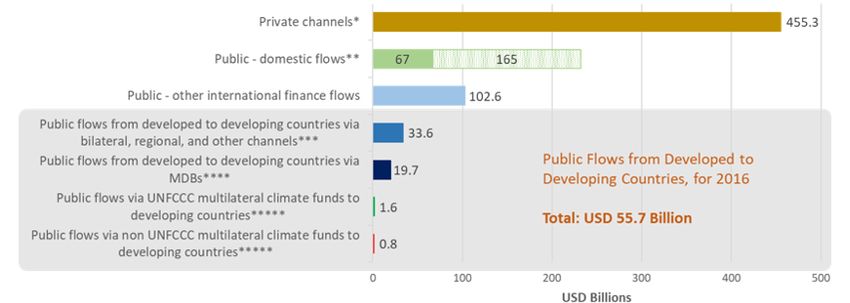
The most recent global data published by the UNFCCC identified USD 681 billion in climate finance flows
in 2016. Private finance accounts for two-thirds of flows identified by the UNFCCC. Of the global total,
just USD 55.7 billion were public international flows from developed to developing countries in 2016.
Bilateral, regional and other flows from one source country to another country or group of countries were
the largest source of public international climate finance flows from developed to developing countries in
2016, and represented USD 33.6 billion of this total.
Five multilateral climate finance funds serve as the financial mechanisms of the UNFCCC and its Paris
Agreement, namely the Green Climate Fund (GCF), the Global Environment Facility (GEF), the Adaptation
Fund (AF), the Least Developed Countries Fund (LDCF) and the Special Climate Change Fund (SCCF).
The GEF manages the LDCF and SCCF. In practice these funds have been complex and slow to access. In
2016, these five funds collectively accounted for USD 1.6 billion of the USD 55.7 billion in public
international climate finance flows to developing countries that was attributable to developed countries.
Specifically, a regional dataset accounting for USD 31.3 billion of the USD 33.6 billion in bilateral, regional
and other flows found that Arab States received USD 4.6 billion bilateral flows in 2016, including USD 3.7
billion for mitigation, 0.7 for adaptation, and 0.3 billion for cross-cutting actions. This includes USD 1.4
billion in non-concessional loans, USD 2.3 billion in concessional loans, and just USD 0.7 billion in grants,
with the remaining USD 0.35 classified as “other.”
The distribution of climate finance among countries within the Arab region was also very uneven, with
94% of reported bilateral flows in 2016 going to just five countries: Egypt, Qatar, Morocco, Tunisia and
Jordan. Distribution was also uneven over time both regionally and by recipient state, with total bilateral,
regional and other flows reported to the region increasing 162% in one year from USD 1.8 billion in 2015
to USD 4.6 billion in 2016. Limited improvements were also witnessed in 2018 and 2019 with Bahrain and
the State of Palestine, respectively, awarded GCF projects in those years.
However, there are important accounting weaknesses underlying these totals, which are self-reported by
developed country donors, multilateral development banks and multilateral climate funds.
• There is no way to measure the additionality of climate finance, because it is not differentiated from
official development assistance (ODA), humanitarian aid, and other official flows, creating a risk
that existing flows will be double counted as climate finance without mobilizing separate and
additional finance flows;
• Most developed countries report committed finance, not disbursed finance, inflating reported totals
as climate finance ramps up, and creating risks of double counting;
• Non-concessional finance is counted on par with concessional finance, despite fundamental
differences in their value added to climate action; and
• Reported totals are not verified, despite potential for double counting and smoothing.
These accounting weaknesses mean that the quantity of finance flowing to the Arab region, and to other
global regions, may be lower than is apparent from reported totals. This exacerbates the existing shortage
of finance repeatedly reported by many Arab states and other developing countries.
vThere are also important substantive gaps found at both the global and regional level, and across bilateral
and multilateral channels. The Paris Agreement calls for “a balance between adaptation and mitigation,
taking into account country-driven strategies, and the priorities and needs of developing country Parties”.
The Arab region needs more adaptation and grant finance, yet UNFCCC data on developed country support
to Arab States through bilateral, regional, and other channels shows:
• Finance for mitigation exceeds finance for adaptation by a factor of 5 to 1 even though the Paris
Agreement seeks a balance between finance for adaptation and mitigation;
• Loans exceed grants by 5 to 1, despite the need for grant support in many Arab States, particularly
Arab LDCs, which received just 2% of these flows to the Arab region despite their need; and
• From a sector perspective, just 14% of these flows are for water and sanitation projects, compared
to 76% for energy, transport, and infrastructure.
Globally, developed countries provide 20 times more support bilaterally than through the multilateral
financial mechanisms of the UNFCCC by a factor of 20 to 1. This creates a risk that the supply is contingent
on the priorities of the parties providing the finance, which may not be fully consistent with the nationally
determined priorities of recipient states.
Financial resources need to be significantly scaled up to meet the pressing needs of developing countries to
respond to climate change challenges. Accessing international public climate finance flows is a priority for
Arab States and other developing countries. Yet, developing countries, including Arab States, are taking
action. They are piloting and adopting locally or globally innovative financing mechanisms to mobilize
additional climate finance resources for nationally determined climate actions. Many of these financing
instruments are not new but may represent new approaches to climate finance for a given country or sector.
For example, de-risking tools for investors, like political risk insurance or investment guarantees, can help
unlock new sources of investment. The use of green bonds and sharia compliance green sukuk is growing
quickly, providing an option to quickly raise debt for projects that will generate a cashflow to repay
investors. Other non-traditional sources with proven ability to unlock new sources of funding include
ecosystem services, results-based financing, and debt for climate swaps, among others.
In sum, the type of finance provided to Arab States is not consistent with national priorities. This mismatch
of climate finance supply and demand is a quality problem. Additionally, while global climate finance flows
remain challenging to measure, available data suggests that total amount of international climate finance
flows do not yet meet the total financing need of the region. Accordingly, it is both the quantity and quality
of flows to Arab States that is not yet sufficient. It will also likely remain insufficient as Parties to the
Convention continue to negotiate an annual collective quantified goal for increasing the Paris Agreement
climate finance target from a floor of USD 100 billion in 2020. Many critical details of the transparency
mechanism for reporting on climate finance formats has also yet to be elaborated, with underlying
unresolved questions about how to define climate finance.
viI. Introduction
This technical report examines existing and potential flows of climate finance to Arab States. The introduction
provides an overview of international negotiations related to climate finance. Chapter II reviews existing
climate finance flows as reported under the United Nations Framework Convention on Climate Change,
including the most recently reported data on financial flows from developed countries to Arab States, as well
as data on flows via multilateral development banks and private sector flows. Chapter III reviews other climate
financial instruments that may help to attract and mobilize additional finance to support the achievement of
nationally determined climate actions and priorities. Key findings and conclusions are then provided in the
final chapters. Redistributive and national budgeting policies are beyond the scope of this report.
A. Evolution of International Negotiations related to Climate Finance
Climate change negotiations
Negotiations to develop a climate change agreement were first initiated in 1988 during the World Conference
of the Changing Atmosphere: Implications for Global Security in Toronto, Canada, where discussions focused
on the need to develop a global pact to protect the atmosphere and take immediate actions to reverse climate
change. The Conference called for cutting global carbon dioxide (CO2) emissions by 20% by 2005 and
establishing a world atmosphere fund financed in part by a tax on fossil fuels.
In 1992, the United Nations Conference on Environment and Development (Earth Summit) was held in Rio
de Janeiro and concluded with the signature of the United Nations Framework Convention on Climate Change
(UNFCCC), which entered into force in 1994. The Convention serves as the global umbrella for climate change
negotiations. The Conference of the Parties (COP) to the Convention meets each year to make decisions on
the implementation of the Convention. The first COP meeting (COP 1) was held in 1995 in Berlin. Preparatory
meetings are undertaken prior to each COP to support the negotiations.
In 1997 at COP 3, the Kyoto Protocol was adopted. The Protocol focuses on climate change mitigation and
includes binding commitments for developed countries, which are recognized as the main emitters of
greenhouse gases that contribute to man-made climate change. The Protocol entered into force in 2005 and
covered commitments for emission reductions between 2008 and 2012.
In 2007 at COP 13, the Bali Action Plan was adopted as a new plan for climate change mitigation involving
both developed and developing countries. In 2009, during COP 15, the Copenhagen Accord was prepared,
which endorsed the continuation of the Kyoto Protocol and stated that “developed countries shall provide
adequate, predictable and sustainable financial resources, technology and capacity-building to support the
implementation of adaptation action in developing countries.” However, while the Parties agreed to “take note
of” the accord, it was not endorsed and is not legally binding.
In 2010 at COP 16, the Cancun Agreements were adopted. Parties through these agreements committed to a
maximum temperature rise of 2 degrees Celsius above pre-industrial levels, and to consider lowering that
maximum to 1.5 degrees in the near future. Furthermore, “Parties affirmed that adaptation must be addressed
with the same level of priority as mitigation” and adopted the Cancun Adaptation Framework, which
established the national adaptation plan (NAP) process as a voluntary process.1 COP 16 also decided to
establish the Green Climate Fund.
In 2011, at COP 17, preparations for a new climate change agreement were initiated with the establishment of
the Ad Hoc Working Group on the Durban Platform for Enhanced Action.
1 UNFCCC, 2011. FCCC/CP/2010/7/Add.1.
1In 2012, at COP 18 in Doha, the Doha Amendment to the Kyoto Protocol was introduced to cover emission
reductions between 2013 and 2020, but the amendment did not enter into force as it was not been ratified by
at least three-fourths of the Parties to the Kyoto Protocol.
In 2013, at COP 19 in Warsaw, Parties agreed to draft a new negotiating text for a climate change agreement.
Parties also agreed to convene biennial high-level ministerial dialogues on climate finance starting in 2014 and
ending in 2020.
In 2014, COP 20 adopted the draft negotiating text and requested Parties of the Convention to submit their
Intended Nationally Determined Contributions (INDCs) before COP 21, also referred to as the Lima Call for
Climate Action. In 2015, 187 Parties (including 19 Arab countries) out of 196 Parties to the Convention
submitted their INDCs, listing their conditional and unconditional contributions to limit emissions by 2030.
Many country submissions also include commitments on adaptation.
In 2015, COP 21 saw what was called a historic turning point in the negotiations with the adoption of the Paris
Agreement on 12 December 2015, less than three months after global consensus on the 2030 Agenda for
Sustainable Development. The Agreement aims to combat climate change by adopting policies and actions
that would reverse its implications. It includes both binding and non-binding clauses for developed and
developing countries, in addition to guiding means to implement the Agreement. The Paris Agreement also
formalized the requirement for Parties to submit an adaptation communication (Articles 7.9 and 7.10), which
may be in the form of a NAP, as established under the Cancun Adaptation Framework. Under the Agreement,
a national adaptation communication should be submitted in addition to a Nationally Determined Contribution
(NDC). By December 2019, 187 Parties to the Convention had ratified the Paris Agreement.
In 2018, COP 24 agreed on rules to implement the Paris Agreement that will enter into force in 2020. These
rules are sometime referred to as the Katowice Package and define modalities, procedures and guidelines to
implement the enhanced transparency framework, in accordance with Article 13 of the Paris Agreement. This
include rules on how to measure and report on efforts to cut carbon emissions, with biennial reporting required
beginning in 2024 to track progress on NDC implementation. The rules also define how to measure and report
on financing, technology transfer and capacity building support provided, mobilized and received, in
accordance with Articles 9, 10, and 11 of the Paris Agreement.
In 2019 at COP 25, further focus was placed on means for operationalizing the Paris Agreement, with specific
focus placed on Article 6 related to partnerships and cooperative mechanisms for assisting countries meet and
raise the climate ambition. This included negotiations on possible market and non-market mechanisms for
carbon trading; however, no substantive agreement was reached. Similarly, negotiations on reporting
requirements and timelines for transparency were not concluded, with many decisions delayed for further
negotiation at COP26 in 2020, under rule 16 of the UNFCCC process.
This progression is illustrated in figure 1.
Figure 1 Evolution of Climate Change Negotiations
Source: Modified based on ESCWA, ESCWA Water Development Report 7: Climate Change Adaptation and Disaster Risk Reduction,
E/ESCWA/SDPD/2017/3.
2Climate finance
The evolution of climate finance followed a parallel track to that of climate change negotiations. Financial
resources are needed for climate change adaptation and mitigation, and to address loss and damages caused by
climate change. The issue of climate financing was first discussed in
1992 with the adoption of the UNFCCC. The Convention “The developed country Parties and
acknowledged the historical responsibility of developed countries for other developed Parties included in
the majority of emissions, and “the common but differentiated Annex II shall provide new and
responsibilities and respective capabilities” of developed and additional financial resources to
developing countries, explicitly establishing that developed countries meet the agreed full costs incurred
are responsible for securing financial resources to help developing by developing country Parties in
countries cope with climate change (see box). This issue was reiterated complying with their obligations
in the Kyoto Protocol – in which references to particular articles from under Article 12, paragraph 1.”
the Convention were made. The Global Environment Facility was
established in 1992 by the World Bank, ahead of the Rio de Janeiro (UNFCCC, Article 4, paragraph 3)
Earth Summit that adopted the UNFCCC.
The issue of climate financing was again addressed in the Copenhagen Accord in 2009 (COP 15) and, for the
first time, developed countries listed under Annex II of the UNFCCC (Annex II parties) pledged to mobilize
USD 100 billion climate finance per year to developing countries not listed in Annex I (non-Annex I parties)
by 2020 from public and private sources.2 While the Copenhagen Accord was not endorsed, the same pledge
was reiterated in Cancun during COP16 in 2010 and in the ensuing Cancun Agreements which recognized
that, "developed country Parties commit, in the context of meaningful mitigation actions and transparency on
implementation, to a goal of mobilizing jointly USD100 billion per year by 2020 to address the needs of
developing countries.”3 Parties also decided to establish the Green Climate Fund in 2010 at COP 16, but it did
not begin operations until 2015.
In 2015, the Paris Agreement adopted the financial mechanisms of the UNFCCC and its operating entities as
the Financial Mechanism of the Agreement. The Paris Agreement text does not quantify developed countries’
financial commitment, but COP decision 1.CP/21 that adopts the Paris Agreement “strongly urges” developed
countries to mobilize USD 100 billion annually by 20204 and to scale-up this amount beyond 2025.
Furthermore, developing countries have argued that funds mobilized for climate change under this goal should
be separate and additional to development aid and should not be counted towards developed countries’
commitment to allocate 0.7% of their gross national income for official development assistance under the
Addis Ababa Action Agenda.5 The Paris Agreement recognized the responsibility of developed countries to
mobilize climate finance and welcomed voluntarily contributions from developing countries. Article 2.1c of
the Paris Agreement also establishes a goal of “making finance flows consistent with a pathway towards low
greenhouse gas emissions and climate-resilient development.” This scope is broader than the goal of
mobilizing USD 100 billion in finance annually by 2020, with different policy implications.
While long term finance has been on the agenda all COPs since Paris (22, 23, 24 and 25), Parties have been
unable to reach an agreement on a higher long-term target beyond 2020 for climate finance mobilization. In
2016, at COP 22 in Marrakesh, the 2nd High-level Ministerial Dialogue on Climate Finance noted the need to
increase climate finance, particularly adaptation finance.6 While long term climate finance was on the agenda,
this potentially included targets above USD 100 billion in financing per year by Annex I parties after 2020;
however, no specific agreement on targets past 2020 was reached. In 2017 at COP 23 in Bonn, long term
climate finance was again on the agenda, and again no specific agreement on targets for mobilizing finance
past 2020 was reached by the Parties. In 2018, at COP 24 in Katowice, the 3rd High-level Ministerial Dialogue
2 UNFCCC 2010. FCCC/CP/2009/11/Add.1.
3 UNFCCC, 2011. FCCC/CP/2010/7/Add.1. p. 17.
4 UNFCCC, 2016. FCCC/CP/2015/10/Add.1.
5 UNGA, 2015. The Addis Ababa Action Agenda of the Third International Conference on Financing for Development was adopted in
July 2015.
6 UNFCCC, 2018b.
3on Climate Finance7 discussed long term climate finance, and, as with the previous two high-level ministerial
dialogues, once again did not agree on any specific targets. The parties also did not agree to a definition of
how to measure whether climate finance flows are additional to existing development aid flows. The features
for defining climate finance also remained vague, although figure 2 outlines a general understanding of the
characteristics of climate finance.
Figure 2 Climate Finance Characteristics
Developed Countries have a Provided to Developing Country
responsibility to mobilize climate Parties, with a priority to the most
finance vulnerable to climate change
Financial Mechanisms
of the Convention
Balanced in allocation between Scaled-up, new and additional and
adaptation and mitigation predictable
At COP 24 in Katowice, however, progress was made on transparency mechanisms. The Conference of the
Parties serving as the meeting of the Parties to the Paris Agreement (CMA) agreed to require developed
countries to biennially communicate information on financial support provided and mobilized, including inter
alia the type of support (e.g., concessional or non-concessional), recipient countries, funding channels,
recipient sectors and subsectors, purpose (e.g., adaptation or mitigation) and funding commitments versus
disbursements. This improved transparency framework will make it easier to comparably track and measure
global, regional and national climate finance flows and gaps. Information will be posted on a dedicated online
portal managed by the UNFCCC Secretariat. Furthermore, the Parties agreed to provide “underlying
assumptions, definitions and methodologies, as applicable, used to identify financial support provided and
mobilized,” including methods for calculating concessionality.
Parties also agreed in 13/CMA.1 “that the Adaptation Fund shall exclusively serve the Paris Agreement and
shall no longer serve the Kyoto Protocol once the share of proceeds under Article 6, paragraph 4, of the Paris
Agreement becomes available.”8 As of 1 January 2019, the Adaptation Fund formally serves the Paris
Agreement instead of the Kyoto Protocol. The Parties, in decisions 3/CP.24 also urged “developed country
Parties to continue to scale up mobilized climate finance” and to achieve more balance between adaptation and
mitigation finance9 and agreed in 14/CMA.1 to “initiate…deliberations on setting a new collective quantified
goal from a floor of USD 100 billion per year…” in 2020.10 This decision on negotiating resource mobilization
from a floor of USD 100 billion per year did not differentiate between the responsibilities developed and
developing countries.
The transparency rules agreed to at Katowice in 2018 under Decision 18/CMA.1, enter into force in 2020 and
require parties to provide “Information on … how a Party has determined finance to be concessional and/or
ODA, including by using information such as grant equivalency, institution and/or instruments-based
approaches.”11 It is not clear if this will be sufficient to ensure comparability, as the Parties have not yet
finalized the specifics of the methodology agreed to at Katowice.
International development finance negotiations
Climate change negotiations related to climate finance have occurred in parallel with the international
development finance negotiations. While these are separate processes, they provide important context to
understanding positioning of climate finance flows under the Paris Agreement in relation to other global
7 UNFCCC, 2018b.
8 UNFCCC CMA 1-3, 2018.
9 UNFCCC COP 24. 2018.
10 UNFCCC CMA 1-3, 2018.
11 UNFCCC CMA 1-3, 2018.
4sustainable development finance flows. The evaluation of development finance negotiations is thus elaborated
below.
In 2002, the Monterrey Consensus on Financing for Development was adopted at the first International
Conference on Financing for Development. It recognized the importance of increasing international aid to meet
the Millennium Development Goals (MDGs) and established a target for donor countries to allocate at least
0.7% of their gross national income (GNI) to Official Development Assistance (ODA).
In 2008, developed countries reaffirmed their commitment to mobilize ODA at the Second International
Conference on Financing for Development. Resulting consensus in the Doha Declaration affirmed the
importance of nationally defined development strategies, and the mobilization of international, domestic and
private sources of finance to achieve development objectives.
In 2015, the Third International Conference on Financing for Development led to the adoption of the Addis
Ababa Action Agenda (AAAA), which committed strong international support for public services “building
on country-led experiences” (Article 12). The AAAA notes that developed countries need to step up efforts to
meet ODA targets of 0.7% of GNI overall, including 0.15% of GNI allocations to Least Developed Countries
(LDCs).12 However, while recognizing the special challenges faced by LDCs and Small Island Developing
States, (SIDS), it does not commit new financial resources to them.
As of 2016, ODA allocation by five European countries reached or exceeded the target of 0.7% GNI, but on
average remains below this target at an average of 0.31% of GNI among the 29 members of the Development
Assistance Committee (DAC) of the Organization for Economic Co-operation and Development (OECD).13
Turkey and the United Arab Emirates, which are not members of the DAC, allocated over 0.7% of their GNI
to ODA in 2017.14
Beginning in 2019, the OECD will only measure the grant component of concessional loans when calculating
ODA. The OECD-DAC agreed to this change in 2014 to “guarantee a fairer picture of provider effort.”
Previously, concessional loans (loans with at least a 25% grant element) were counted as ODA, rendering it
difficult to evaluate the true amount of grant finance within ODA compared to loan finance. The OECD reports
this approach was adopted because it “provides a more realistic comparison of loans and grants, and encourages
the use of grants and highly concessional loans as these will continue to play a key role in mobilising resources
to support the Sustainable Development Goals (SDGs).”15 For comparability over time, the OECD will also
continue to calculate ODA using the pre-2019 method as a reference statistic.16
The exclusion of the loan component of ODA through this updated method of accounting will likely result in
a significant downward revision of OECD estimates of ODA. By comparison, the UNFCCC Biennial
Assessment of Climate Finance flows does not yet disaggregate the grant component of concessional loans.
Furthermore, non-standard reporting formats used by parties in biennial reports make it difficult to
disaggregate grant equivalents across the board.
B. Climate Change in the Arab Region
The Arab region is particularly vulnerable to climate change and suffers from significant socio-economic and
environmental challenges. Countries in the region have varying adaptive capacities to address the
repercussions of climate change. The region suffers from increasing temperatures, severe water scarcity,
increasing frequency and intensity of extreme events such as floods, droughts, heat waves.17 Water scarcity
and the decrease in annual rainfall make most of the region arid or semi-arid.18 The region also suffers from
12 UNSG, 2015. Addis Ababa Action Agenda, para. 51.
13 OECD, 2018d.
14 OECD, 2018a.
15 OECD, 2018c.
16 OECD, 2018c.
17 ESCWA et al., 2017a. E/ESCWA/SDPD/2017/RICCAR/Report.
18 ESCWA et al., 2017a. E/ESCWA/SDPD/2017/RICCAR/Report.
5acute poverty, a significant sustainable development challenge that burdens governments and hinders their
capacities to address climate change implications. This is manifested in both urban and rural areas, where over
50% of the region’s population live in cities, but 67% of the region’s poor live in rural areas with the rural
population account for 48% of the region’s population.19
The repercussions of climate change on national and local development exercise significant pressure on
governments to achieve water, energy and food security for current and future generations. These impacts
exacerbate the development challenges posed by persistent conflicts and occupation, which are exerting
significant pressures on the several governments to meet basic needs in a region that hosts more than 53% of
all refugees and 37% of displaced populations in the world.20 Furthermore, the most vulnerable communities
are among the most affected by climate change, including the Arab region’s Least Developed Countries
(LDCs).21
Continuing with the current business-as-usual practices, average temperatures in the Arab region are likely
increase by up to 5o Celsius by the end of this century compared to the start of the 21st century, threatening the
health and livelihoods of urban and rural communities alike. This is despite the fact that the Arab region emits
around 5% of global greenhouse gas emissions, although its carbon footprint is increasing rapidly.22 Adaptation
is thus a priority for the Arab region, which was a key message at the 2019 Arab Forum for Sustainable
Development (Beirut, April 2019). Furthermore, precipitation levels are expected to decrease in most of the
region, heat extremes are expected to increase, drought and flood occurrences are expected to increase in some
areas.23 These repercussions extend beyond the realm of climate change and affect many sectors. For instance,
the negative impact of climate change on water availability, increasing droughts and desertification have a
direct impact on agriculture and livestock; the increasing temperature is even causing wider transmission of
some neglected tropical diseases.24
Financing climate change requires large investments in mitigation and adaptation projects in the Arab region.
While climate change adaptation is a priority, costs are significant (particularly up-front investment costs) and
available resources are stretched. Arab governments are pressured to mobilize significant resources to lessen
the impact of climate change. Domestic public resources are constrained and burdened by increasing fiscal
deficits (consolidated fiscal deficit stood at 9.9% of GDP in 2016)25 and geopolitical instability in many
countries. Private sector involvement in adaptation and mitigation projects may be able to supplement, but not
replace public sector expenditure, but is also still limited. Access to public international climate finance is
insufficient in terms of both quantity and quality, as the type of finance supplied is not consistent with the
priorities of the Arab region (a quality problem), and the scale of support remains insufficient (a quantity
problem).
19 ESCWA, 2017c. E/ESCWA/EDID/2017/1.
20 ESCWA, 2017c. E/ESCWA/EDID/2017/1.
21 ESCWA et al., 2017a. E/ESCWA/SDPD/2017/RICCAR/Report.
22 ESCWA, 2019, E/ESCWA/SDPD/2019/1.
23 ESCWA, 2017a. E/ESCWA/SDPD/2017/RICCAR/Report
24 ESCWA, 2017a. E/ESCWA/SDPD/2017/RICCAR/Report.
25 ESCWA, 2017c. E/ESCWA/EDID/2017/1.
6II. International Climate Finance Flows
The text of both the UNFCCC itself and of the Paris Agreement recognize the responsibility of developed
countries to mobilize public resources to finance climate change projects in developing countries. This is based
on the historical responsibility of developed countries for greenhouse gas emissions. To date, the target to
mobilize USD 100 billion international public climate finance flows from developed (Annex II) to developing
(non-Annex I) countries has not been met, and current flows do not meet the estimated financial need.
The UNFCCC 2018 biennial assessment and overview of “Acknowledging that the largest share of historical
climate finance flows (BA) estimates total 2016 flows of global emissions of greenhouse gases originated in
international public climate finance from developed developed countries and that, owing to this
countries to developing countries, including both grants historical responsibility, developed country Parties
and concessional loans, to be USD 55.7 billion (grey must take the lead in combating climate change and
background in figure 3). This includes USD 33.6 billion the adverse effects thereof”
through bilateral, regional, and other channels from (UNFCCC, 2010, FCCC/CP/2010/7/Add.1)
Annex II to non-Annex I countries, USD 19.7 billion
through multilateral development banks from OECD- “Developed country Parties should continue to take
DAC members (minus the Republic of Korea) to OECD- the lead in mobilizing climate finance from a wide
variety of sources, instruments and channels,
DAC eligible recipients, and USD 2.4 billion through
noting the significant role of public funds, through
Multilateral Climate Funds from Annex II to non-Annex- a variety of actions, including supporting country-
I countries, including 1.6 billion through the funds of the driven strategies, and taking into account the needs
UNFCCC Financial Mechanism.26 and priorities of developing country Parties. Such
mobilization of climate finance should represent a
More broadly, the 2018 BA estimates total international progression beyond previous efforts.”
public and private climate finance flows to have been (Paris Agreement, Article 9, paragraph 3)
USD 681 billion in 2016, including USD 455.3 billion in
private finance, or two thirds of total flows, and nearly 9 “International public finance plays an important
times more than the USD 55.7 billion in public role in complementing the efforts of countries to
international finance from developed countries to mobilize public resources domestically, especially
in the poorest and most vulnerable countries with
developing countries.27 While public and private finance
limited domestic resources. Our ambitious agenda
are distinct, and have different roles in an efficient puts significant demands on public budgets and
scenario, this scale clearly shows that private financing capacities, which requires scaled-up and more
plays a critical role in climate finance. effective international support, including both
concessional and non-concessional financing.”
A large majority of global climate finance flows have (Addis Ababa Action Agenda, Annex II, paragraph 50)
been committed to renewable energy and energy
efficiency investments, estimated at USD 526.8 billion in
2016, primarily through private finance. This represents 77% of total climate finance flows reported by the
UNFCCC that year.28Furthermore, for all financing channels, more finance flows to mitigation projects than
to adaptation projects. Flows to adaptation only account for 29% of bilateral flows from Annex II parties to
the UNFCCC, 25% of flows from multilateral climate funds and just 21% of finance provided by multilateral
development banks (MDBs).29
26 UNFCCC SCF, 2018, p. 56.
27 UNFCCC SCF, 2018, p. 56.
28 UNFCCC SCF, 2018, p. 57.
29 UNFCCC SCF, 2018, p. 80.
7Figure 3 Global Climate Finance Flows Reported by the UNFCCC, by Source, 2016
Notes: Data on public international flows reported by the UNFCCC includes risk capital as well as grant finance. While reporting
formats are not standard, many biennial reports submitted by the parties include Official Development Assistance (ODA) as well as
Other Official Flows (OOF).
a The UNFCCC notes “High-quality data on private investments in mitigation and finance in sectors such as agriculture, forests, water
and waste management are particularly lacking.”
b USD 67 billion is officially reported by the UNFCCC Standing Committee on Finance, based on a 32-country dataset. While
comprehensive data is not available for all countries, the UNFCCC Standing Committee on Finance estimates USD 157 billion in
domestic public expenditure by developing countries and USD 75 billion by developed countries, giving a global total of USD 232
billion.
c Developed countries are defined as OECD-DAC members, except the Republic of Korea. Developing countries are defined as
countries that are not members of the OECD-DAC. MDBs are multilateral development banks. Flows are attributed to developed
countries based on their ownership share in MDBs, and only include the own resources of MDBs; funds from other sources channelled
through MDBs are not counted.
d Developed countries are defined as those listed in UNFCCC Annex II. Developing countries are those not listed in UNFCCC Annex
I.
e Developing countries are defined as those countries not listed in UNFCCC Annex I
Source: Elaborated by ESCWA based on UNFCCC Standing Committee on Finance 2018 Biennial Assessment and Overview of
Climate Finance Flows Technical Report.
However, at existing levels of climate finance flows, the need for both adaptation and mitigation finance across
all sectors remains unmet. For example, the IPCC estimated in 2018 that annual energy-related investments of
USD 830 billion (in 2010 USD values) will be required as part of efforts to limit warming to 1.5°C, but does
not provide an estimate of other mitigation costs.30 The Fifth Assessment Report of the IPCC (2014) estimated
annual adaptation costs in developing countries of at least USD 70 to 100 billion, while noting that adaptation
costs are likely to increase if mitigation targets are not met. 31 In 2016, the United Nations Environment
Programme (UNEP) estimated the annual, global adaption finance need to be between USD 140 and 300
billion, with a projected increase to USD 280 to 500 billion by 2050.32 In 2018, UNEP emphasized that these
projections likely underestimate the need.33
Data on regional finance flows is also incomplete. This is complicated by the fact that different regional
segmentations are used by different institutions and sources of information. However, available data shows
that global trends on the distribution between adaptation and mitigation, as well as the type of financing (grants,
concessional, or non-concessional) appear to be applicable to climate finance flows to Arab States. The
following sections review climate finance flows from the following sources in more detail:
• International public finance from developed to developing countries
• International private finance flows
• Dedicated climate funds
30 IPCC, 2018.
31 As referenced in UNDESA, 2016.
32 UNFCCC SCF, 2018, p. 96.
33 UNEP, 2018.
8The sections provide an overview of current trends globally and in Arab countries, including the degree to
which Annex II parties are fulfilling their commitment to non-Annex I parties. International public flows are
examined in the greatest detail, particularly flows through UNFCCC Financial Mechanism and progress
towards the target of USD 100 billion in annual climate finance flows from developed to developing countries
by 2020.
A. International Public Climate Finance Flows from Developed to Developing Countries
The UNFCCC reports34 that international public climate finance flows totalled USD 158.2 billion in 2016, the
most recent comprehensive reporting year. This includes 55.7 billion in public flows from developed to
developing countries, plus 102.6 billion in other public flows (e.g., developing to developing, and developed
to developed country flows).
The high bound estimate of USD 55.7 billion in public international flows from developed countries to
developing countries represents an increase of 14% from the estimated USD 48.7 billion in international public
climate finance flows in 2015. This section focuses on the USD 55.7 billion in international public finance
flows from developed countries to developed countries.
The majority of the USD 55.7 billion in public international climate finance flows from developed to
developing countries in 2016 flowed through multilateral, bilateral, regional, and other channels. Flows
through the dedicated climate funds that are the financial mechanisms of the UNFCCC only accounted for
USD 1.6 billion in 2016, or less than 3% of public international flows that year, and less than 0.2% of the USD
681 billion in global climate finance flows reported in 2016, drawing upon the totals presented in figure 3. The
amount flowing through the dedicated UNFCCC climate funds increased through 2018, with over USD 2
billion committed by the Green Climate Fund (GCF) alone, roughly double 2017 GCF commitments.
Nevertheless, flows through dedicated UNFCCC climate funds continue to be a fraction of global flows.
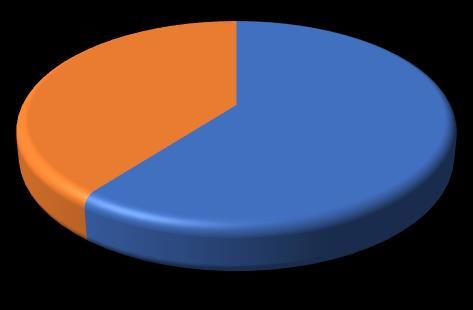
The Paris Agreement seeks a balance between finance for adaptation and mitigation, but across all international
public financing channels, the majority of funds are committed to mitigation projects (figure 4). This is
particularly the case among MDBs, which commit 79% of finance to mitigation projects. While additional
research is necessary, this may reflect that there is a higher share of bankable projects in the mitigation sector
than the adaptation sector.
While loans account for the majority of mitigation finance, adaptation finance typically has higher
concessionality. According to the UNFCCC, grants accounting for 62% of adaptation finance provided through
bilateral channels and multilateral climate funds in 2015, increasing to 94% in 2016. In comparison, grants,
accounted for just 9% of MDB adaptation finance in 2016, highlighting a different approach to adaptation by
these banks.35 Conversely, grants accounted for just “25 per cent of bilateral flows, 31 per cent of multilateral
climate fund approvals and 4 per cent of MDB investments.”36
The distribution of global climate funds is also uneven across sectors. Most global climate finance flows were
committed to renewable energy and energy efficiency investments, estimated at USD 526.8 billion in 2016,
primarily through private finance. This represents 77% of total climate finance flows that year.37
34 UNFCCC SCF, 2018.
35 UNFCCC SCF, 2018, p. 80.
36 UNFCCC SCF, 2018, p. 80.
37 UNFCCC SCF, 2018, p. 57.
9Figure 4 Segmentation of International Public Finance Flows from Developed to Developing
Countries: Annual Average for 2015-2016
Bilateral and regional finance flows from developed to developing countries
Developed countries listed in Annex II of the UNFCCC Figure 5 Climate Finance Flows from
provided USD 49.4 billion to non-Annex I developing Developeda to Developingb
countries in 2016, including USD 37.5 billion in climate- Countries
specific finance and USD 11.9 billion of “’core general’ public
financial support to multilateral institutions that Annex II USD billions
parties are unable to confirm as climate-specific.”38
USD 33.56 billion of the USD 49.4 billion was provided
through bilateral, regional, and other parties (figure 5). The 11.91
remaining USD 15.87 billion of the USD 49.4 billion is
attributed to financing channelled by Annex II countries to 3.96
33.56
developing countries through multilateral institutions, of which
only USD 3.96 billion is climate specific.39 The USD 37.5
billion climate-specific flows in 2016 represented a 14%
increase from USD 33 billion in climate-specific finance Climate Specific: Bilateral, Regional, and Other
reported for 2015.40 Similarly, finance during the period 2015-
2016 represented a 17% annual increase from the period 2013- Climate Specific: Multilateral Channels
2014.41 Core General (Not Climate Specific):
Multilateral Channels
Accounting practices in Biennial Reports (BRs) submitted by a Refers to UNFCCC Annex II Parties
Annex II countries to the UNFCCC vary. Of parties that b Refers to UNFCCC non-Annex I Parties
reported financing sources, some include only ODA in their Source: Developed by ESCWA based on UNFCCC
SCF, 2018.
38 UNFCCC SCF, 2018, pp. 63-64.
39 UNFCCC SCF, 2018, p. 64.
40 UNFCCC SCF, 2018, p. 63.
41 UNFCCC SCF, 2018, p. 63.
10BRs,42 while others also included non-concessional finance.43,44 Reported totals provide a useful indication of
financial flows, although the UNFCCC notes that there are outstanding challenges with transparency,
comparability, and consistency of data, particularly with regard to private sector mobilization, but also
including public finance flows. The transparency mechanisms adopted by the Katowice package are designed
to improve transparency, comparability, and consistency of bilateral climate finance reports once they are
implemented. The specific methodology, including whether to disaggregate OOF from ODA, has not yet been
finalized.
Given that there is an existing target for developed countries to provide 0.7% of GNI to ODA flows, reiterated
by the Addis Ababa Action Agenda, stakeholders from developing countries have often argued that the goal
for Annex II countries to provide USD 100 billion in new and additional climate finance per year to developing
countries by 2020 should not include ODA flows under the 0.7% target. However, it is also important to note
that the Katowice Package and refers to a “collective quantified goal” for future negotiations, without reference
to differentiated responsibilities.45
a) Bilateral, regional, and other public international climate finance flows to Arab States
The UNFCCC maintains an online database of bilateral, regional and other climate finance flows based on the
Biennial Reports (BRs) submitted by developed countries that are members of Annex II, as well as BRs
optionally submitted by other countries. “Bilateral, regional, and other” refer to flows from one Annex II
country to a state, a region, or other grouping of multiple countries. Flows in this category are self-reported by
each Annex II party, and do not include finance flows through multilateral channels (multilateral climate funds
or multilateral development banks).
Annex II parties report that they provided USD 33.6 billion in climate specific finance globally through
bilateral, regional, and other channels in 2016, and USD 29.9 billion in 2015. Details on the recipient countries
or regions, type of finance, and type of activity is provided for USD 31.3 billion of this amount in 2016. Data
for USD 1.9 billion in flows from the United States in 2016 is not available. An analysis of bilateral, regional,
and other climate finance flows reported to Arab States, as well as flows reported to the Middle East and North
Africa region, is presented below based on this partial dataset. Box 1 presents a summary of the data source
and limitations, and a detailed methodology is presented in Appendix A.
Bilateral, Regional, and Other Climate Finance Flows Data Set: Source and Limitations
The data analyzed by ESCWA is self-reported information provided by UNFCCC Annex II parties in their Third
Biennial Reports. ESCWA has not attempted to verify the reported data or definitions and has noted the data limitations
defined below. The information presented herein does not necessarily reflect the views of ESCWA, the United Nations,
nor the authors, who make no judgement as to the completeness, accuracy, or correctness of the underlying data.
Rather, ESCWA presents this analysis to disseminate the information reported by the UNFCCC parties in a more
accessible format and with a regional focus, for review by any relevant stakeholders. Furthermore, neither the data
presented herein, nor the underlying definitions and assumptions used by the Annex II parties in preparing the Biennial
Reports, have been validated by the recipient states. As such, the data, definitions, and assumptions may not reflect
the recipient state’s nationally determined definitions nor their national estimates of climate finance flows.
This chapter analyzes the self-reported information submitted by parties to the UNFCCC in their third biennial reports.
Annex I parties were “requested” to submit the Third Biennial Report by 2018, covering the 2015-2016 reporting
period. This information has been compiled into a single database by the UNFCCC and published on the Biennial
Reports Data Interface (BR-DI) under the Bilateral, Regional and Other Channels page of the Financial Support
section. This is based on the information reported by each Annex II party in table 7(b) of the common tabular format.
The UNFCCC SCF notes that it has not verified or validated this self-reported information.
42 Under OECD definitions through 2018, ODA includes grants and concessional loans (at least 25% grant element).
43 UNFCCC SCF, 2018, p. 64.
44 OECD, 2018b.
45 UNFCCC CMA 1-3, 2018.
11You can also read