CO-DIGESTION FEASIBILITY STUDY CO-DIGESTION FEASIBLITY STUDY - FOR THE DISTRICT OF COLUMBIA FOR THE DISTRICT OF COLUMBIA
←
→
Page content transcription
If your browser does not render page correctly, please read the page content below
CO-DIGESTION
  FEASIBILITY STUDY
               FOR THE DISTRICT OF COLUMBIA

      CO-DIGESTION
   FEASIBLITY STUDY
PREPARED BY:              COMMISSIONED BY:

CO-
                                   Department of
   1
               FOR THE DISTRICT OF COLUMBIA
                                    Public Works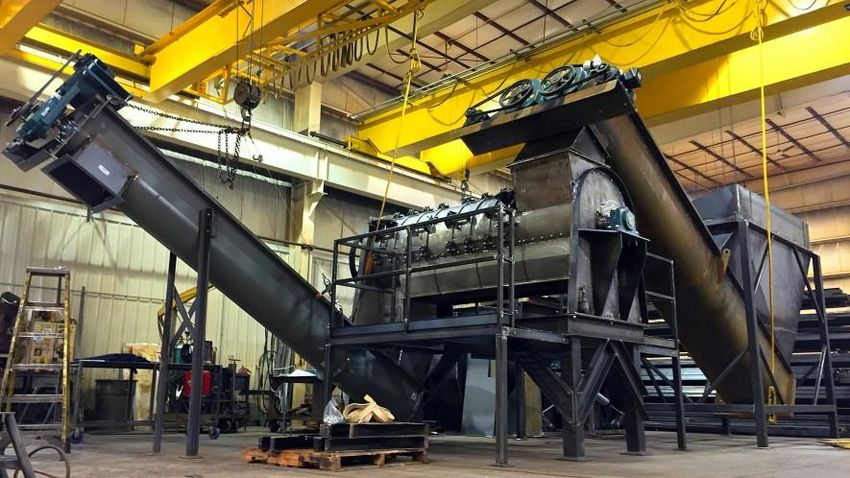
EXECUTIVE SUMMARY
The District of Columbia has a goal of reaching an 80% solid waste diversion rate. Organic waste diversion is an
important part of that goal. In May 2017, the District issued a Compost Feasibility Study that assessed the
implementation of a curbside organics collection program and the siting of an in-district composting facility.
Additionally, the District is considering the use of co-digestion at DC Water’s Blue Plains Wastewater Treatment
Facility (Blue Plains) to process food waste from Industrial, Commercial, and Institutional (ICI) sources. This study
evaluated the operational and financial feasibility for managing a portion of the organic waste generated in the
District, including determining costs of developing a pre-processing facility to prepare and deliver ICI food waste
for co-digestion at Blue Plains.

An evaluation of waste generated by the ICI sector during this study determined that 85,195 tons of ICI food
waste are generated per year in the District. An estimated 42,000 tons of this food waste are generated by the
largest generators and are highly available for collection. The majority of food waste is generated by the
Commercial and Institutional sectors, while the Industrial sector generates negligible volumes of this material. The
generation rates presented are estimates and the actual amount may vary. The capture rates will depend strongly
on supportive policy levels and outreach and education efforts.

Operationally, co-digestion of 78,000 tons per year (tons/year) of C&I waste is possible using current excess
capacity at Blue Plains. As described in the ICI section of this report, 78,000 tons is slightly below the level of
organic waste generated by the C&I sector in the District (approximately 5,600 entities). Achieving a 100%
capture rate is most likely not realistic, however for financial comparison purposes, this report assumes eight-five
thousand tons of annual throughput which equates to a daily rate of 200 additional tons per day of slurry (“wet
tons”) at the WWTP. A pre-processing facility would need to be constructed to convert as-collected C&I food
waste into that slurry at 14% total solids for the co-digestion process.

Financial analysis is based on a throughput of 78,000 tons of food waste per year. At that rate, the tipping fee
required by DC Water would be $16/wet ton. Once the program surpasses 42,000 tons, which is the estimated
quantity generated by the largest commercial generators in the District, the additional tonnage comes from a much
larger number of smaller generators. Increasing the number of commercial generators equates to more difficult
collection and higher administrative and program execution costs. Therefore, this report places additional focus on
the publicly financed option with lower annual tonnages and tipping fees that were required to support the
project.

The selection of a pre-processing site within hauling distance of the Blue Plains plant is crucial to the financial
viability of this project. The Project Team focused on the Benning Road Transfer Station site as it is in close
proximity to Blue Plains and is co-located with existing District-operated waste processing infrastructure. Financial
analysis shows that capital costs are significantly lower for constructing a pre-processing facility at the Benning
Road Transfer Station as opposed to developing a greenfield site, which would require considerable time and
additional costs for new facilities and site infrastructure ($7.5M versus $16.4M, respectively).

The pre-processing facility entails development, capital, and operational costs that range based on the site
selected and the financing method chosen. Several scenarios were evaluated:

    •   Building the facility at the Benning Road Transfer Station versus at a greenfield site;
    •   Using public-private financing versus public-only financing; and

                                                          2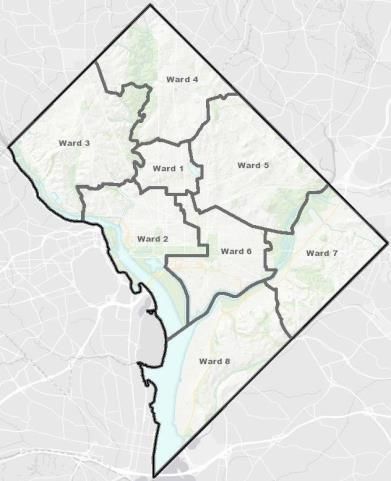
•   Running the co-digestion system at 42,000 tons/year on the low end; 55,000 tons/year as mid-range; and
        78,000 tons/year on the high end.

The highest-cost scenario is associated with the development of a pre-processing facility on a greenfield site using
private funding and results in a tipping fee of $114/dry ton. The lowest-cost scenario is associated with the
development of a pre-processing facility at the Benning Road Transfer Station using public financing for a total
tipping fee of $60/dry ton.

Two key benefits to this project emerged. Based on DC Water's modeling, the addition of food waste to the
digesters would generate approximately one additional megawatt (MW) of electricity. The digesters also produce
Class A biosolids for beneficial reuse in land application and as soil amendment.

This report further recommends that the District develop a comprehensive Organics Site Management Plan that
addresses the following facility-related topics:

    •   Determining the co-location and symbiotic relationship between an in-District compost site, a pre-processing
        site for co-digestion, and co-digestion at Blue Plains WWTP;
    •   Permitting and zoning requirements for pre-processing facility;
    •   Environmental emissions impacts including storm water runoff, air pollution and greenhouse gas (GHG)
        reductions from organics diversion;
    •   Health and safety regulations; and
    •   Organics Processing Facility reporting requirements.

Providing one comprehensive plan provides clarity for differently classified generators, illuminates areas for
mutual efficiencies, alerts to areas of potential competing priorities and adverse impacts, and allows for whole
cloth consideration of planning and impacts as the District works toward its waste diversion goals. It is also
recommended that the District consider the role of supportive policy in implementing a co-digestion program to
both ensure proper feedstock and address community and environmental justice concerns.

                                                          3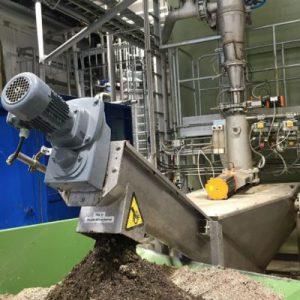
TABLE OF CONTENTS
Contents
Background and Purpose ................................................................................................................................................................ 5
Feasibility Analysis Results............................................................................................................................................................... 8
  Part 1: ICI Waste Stream Evaluation ....................................................................................................................................... 8
  Part 2: Technology Recommendations .................................................................................................................................... 10
  Part 3: Pre-Processing Site Criteria ........................................................................................................................................ 12
  Part 4: Financial and Operational Feasibility ...................................................................................................................... 13
     Financial and Operational Analysis of Co-Digestion at Blue Plains ............................................................................ 13
     Financial and Operational Analysis of Slurry development at A Pre-Processing Facility ...................................... 14
  Part 5: Supportive Policy Recommendations ......................................................................................................................... 20
  Part 6: Financing and Implementation Recommendations .................................................................................................. 22
Conclusion ......................................................................................................................................................................................... 25
Appendix A ...................................................................................................................................................................................... 26
Appendix B....................................................................................................................................................................................... 28
Appendix C ...................................................................................................................................................................................... 29
Appendix D ...................................................................................................................................................................................... 33
Appendix E ....................................................................................................................................................................................... 34

List of Figures
FIGURE 1: BLUE PLAINS SOLIDS PROCESSING FACILITY BLOCK DIAGRAM ............................................................................................. 7
FIGURE 2 DC REGION ............................................................................................................................................................................................ 7
FIGURE 3: PROCESS FLOW DIAGRAM FOR PRE-PROCESSING SITE ........................................................................................................11
FIGURE 4: MODEL ASSUMPTIONS ....................................................................................................................................................................13
FIGURE 5: TIPPING FEE INPUTS ..........................................................................................................................................................................14
FIGURE 6: SENSITIVITY ANALYSIS .....................................................................................................................................................................18
FIGURE 7: PUBLIC-PRIVATE FINANCING MODELS .........................................................................................................................................23
FIGURE 8: SENSITIVITY ANALYSIS RESULTS .....................................................................................................................................................30
FIGURE 9: SYSTEM LIMITATIONS .......................................................................................................................................................................31

List of Tables
TABLE 1: POTENTIALLY AVAILABLE FOOD WASTE GENERATION BY SECTOR (TONS PER YEAR, ROUNDED) ................................. 9
TABLE 2: PERCENT OF TOTAL FOOD WASTE GENERATION BY SECTOR ................................................................................................10
TABLE 3: PRE-PROCESSING FACILITY OPERATIONAL COSTS .....................................................................................................................15
TABLE 4: BENNING ROAD DEVELOPMENT COSTS ........................................................................................................................................16
TABLE 5: BENNING CAPITAL COST ASSESSMENT .........................................................................................................................................16
TABLE 6: BENNING ROAD PRE-PROCESSING FACILITY COST ANALYSIS USING PRIVATE FINANCING .........................................17
TABLE 7: BENNING ROAD PRE-PROCESSING FACILITY COST ANALYSIS USING PUBLIC FINANCING ...........................................17
TABLE 8: NEW GREENFIELD SITE DEVELOPMENT COSTS ............................................................................................................................18
TABLE 9: NEW GREENFIELD SITE CAPITAL COST ASSESSMENT .................................................................................................................18
TABLE 10: GREENFIELD FACILITY PRE-PROCESSING FACILITY COST ANALYSIS – PUBLIC-PRIVATE FINANCING .........................19
TABLE 11: GREENFIELD FACILITY PRE-PROCESSING FACILITY COST ANALYSIS – PUBLIC-ONLY FINANCING ..............................19
TABLE 12: SENSITIVITY ANALYSIS DATA ..........................................................................................................................................................29

                                                                                                       4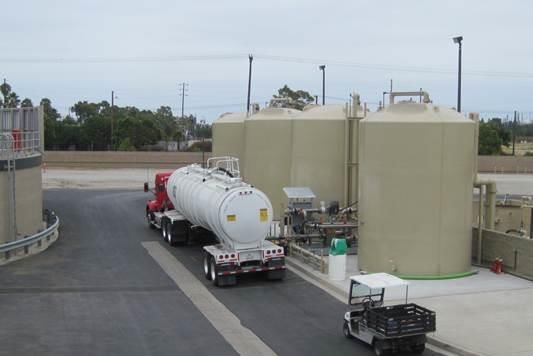
BACKGROUND AND PURPOSE
INTRODUCTION
The District of Columbia was directed to develop a plan for reaching an 80% diversion rate from landfills and
waste-to-energy.12 As part of the efforts to achieve this zero-waste future, the District turned its attention toward
organic waste diversion solutions. In May 2017, the District issued a Compost Feasibility Study that assessed the
implementation of an organics curbside collection program and the siting of an in-district composting facility. In
addition to composting, the District considers the use of co-digestion at DC Water’s Blue Plains Wastewater Treatment
Facility (DC Water) for Industrial, Commercial, and Institutional (ICI) food waste. To evaluate the feasibility of co-
digestion, the District’s Department of Public Works (DC DPW) commissioned RRS to conduct this study to assess the
potential opportunity for managing a portion of the organic waste generated in the District through co-digestion at
DC Water.

OBJECTIVE AND METHOD OLOGY
This report presents the results of the economic and logistical feasibility of diverting commercial food waste
generated by the IC sector in DC via anaerobic digestion at DC Water.

The study builds on learnings from the Compost Feasibility Study conducted a year prior by RRS, including furthering
the analysis of the ICI waste stream and evaluating the use of co-digestion as a complementary approach to
composting for managing organic waste generated in the District. This study identifies and evaluates the fundamental
aspects required for a successful co-digestion program at DC Water. These fundamental aspects included:

     •     ICI Waste Stream Evaluation. Detailed assessment of the quantity and composition of the District’s ICI waste
           stream.
     •     Operational Feasibility. Technical feasibility of co-digestion within existing site constraints and
           infrastructure at DC Water; plus, considerations for additional equipment, processes, and adjustments at the
           DC Water facility; and additional modelling.
     •     Financial Feasibility. Financial evaluation of full-system costs (defined as pre-processing activities and co-
           digestion) to determine an all-inclusive per-ton tipping fee, which was compared against current District
           refuse tipping fees to determine “financial feasibility”.
     •     Pre-Processing Needs. Identification of the need for design, build, and operation of a separate pre-
           processing facility to turn food waste into a slurry that is compatible for entry into the co-digestion system
           at DC Water.
     •     Technology Recommendations. Technology evaluation to identify best-suited equipment for the pre-
           processing site and DC Water facility.
     •     Site Criteria. Minimum site requirements for a pre-processing facility.
     •     Supportive Policy. Policy recommendations to ensure a suitable quantity and quality of feedstock for the
           co-digestion process, and to remove barriers to implementing an ICI source-separated collection and
           processing program.

1Read more about Zero Waste in the District at https://zerowaste.dc.gov/
2Additionally, the Budget Support Act of 2016 requires the District to complete a study to assess the feasibility of sending organic waste to
DC Water for processing. This study is designed to fulfill this requirement.

                                                                      5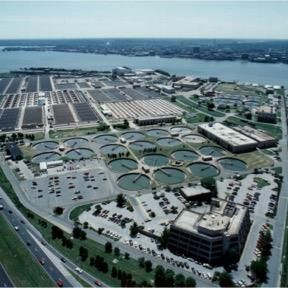
• Implementation Recommendations. Recommendations for financing and operating a stand-alone pre-
processing facility and co-digestion at DC Water.
CO-DIGESTION
Wastewater from residential, industrial and commercial sources requires treatment prior to being released into the
environment. As part of the treatment process, solids are separated from the treated effluent, and are referred to
as sewage sludge. Removed sludge can be further treated through anaerobic digestion in which microorganisms
break down organic material in absence of oxygen and pathogen reduction is achieved through high temperatures.
This process creates biogas which can be used to generate heat and electricity, and a biosolids product which can
be beneficially reused as a soil amendment or fertilizer.
Co-digestion refers to the process in which organic waste materials are added to wastewater digesters that have
excess capacity. Organic food waste has higher methane production potential than sewage sludge, resulting in higher
biogas yield when added to existing wastewater digesters. The addition of organic food waste to existing
wastewater digesters results in the production of additional biogas, reduced greenhouse gas production, and the
diversion of organic waste from landfills.
Other material, including yard waste, is not a viable feedstock for co-digestion due to difficulties with conveyance
and handling, as well as low biogas yield potential. There are limitations to the co-digestion material’s consistency
and characteristics based on DC Water’s existing solids handling system and equipment that restrict the acceptable
material to food waste.
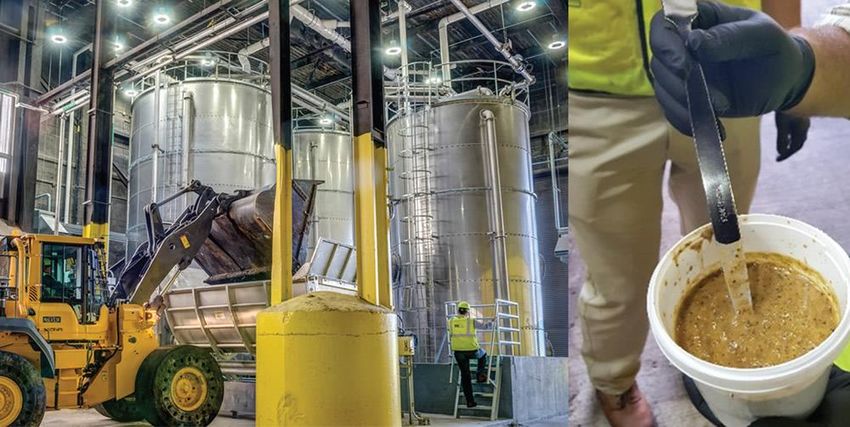
DC WATER BLUE PLAINS WASTEWATER TREATMEN T FACILITY
DC Water maintains and operates the Blue Plains Advanced Wastewater
Treatment Facility located in Washington, DC, designed to treat 370 million gallons
of wastewater per day. Blue Plains is one of the largest and most advanced
wastewater treatment plants in the world. The plant was first operated as a
primary treatment facility in 1937, and has since expanded to include secondary
treatment, nitrification and denitrification, multimedia filtration, and chlorination.
In 2015, DC Water expanded the facility’s solids processing system to include
dewatering, thermal hydrolysis (THP), and anaerobic digestion (MAD) of organic
matter to produce both methane for electricity and Class A biosolids product3. The
electricity helps power the facility’s operations and the resulting biosolids are sold
as a valuable soil amendment and fertilizer. There is a potential to convert this operation to co-digestion with the
introduction of food waste to DC Water’s anaerobic digesters to produce additional gas, thereby reducing grid
dependence.
The Blue Plains solids processing system is shown in the figure below, followed by a detailed description of the
process.
3 Class A biosolids, as defined in the US EPA, Part 503 Rule, must achieve high pathogen reduction levels and must also comply with strict
standards regarding metals, odors and vector attraction reduction. Class A biosolids meet the US EPA guidelines for land application and
can be legally used as fertilizer or compost.
6
Power
                                                                       Generation

    Pre-THP
                              THP                   MAD                Dewatering           Biosolids Out
   Dewatering

                                                                         Liquors

Figure 1: Blue Plains Solids Processing Facility Block Diagram
Solids from primary and secondary treatment are dewatered and sent through a thermal hydrolysis process (THP).
This process subjects the solids to high temperature and pressure, instigating cell lysis and destruction of pathogens.
This results in increased gas production, increased digester capacity and reduction in biosolids mass. Following THP,
solids enter the mesophilic anaerobic digesters (MAD). The digesters generate biogas which is captured and
combusted in 3-5 MW turbines, producing a net 10 MW of electricity through the combined heat and power system.
Based on DC Water's modeling, the addition of food waste to the digesters would generate approximately one
additional MW of electricity. The digesters also produce Class A biosolids for beneficial reuse in land application
and as soil amendment.

Based on modeling and analysis, DC Water has indicated there is available capacity within the existing equipment
and treatment process to introduce organic waste feedstock to the solids handling systems and accommodate co-
digestion. This would result in additional renewable energy production at the facility, further reduce greenhouse gas
production and provide tipping fee revenue for DC Water.

GEOGRAPHY CO VERED
The District of Columbia spans nearly 70 square miles and is bordered by
Montgomery County, Maryland to the northwest, Prince George’s County,
Maryland to the east, and Arlington and Alexandria, Virginia to the south. The
District is divided into eight planning sections, or Wards, which are home to
approximately 5,600 commercial and institutional generators. The Blue Plains
WWTP is located in the southern end of the District in Ward 8, bordering the
Potomac River. The two transfer stations owned and operated by District
government are the Benning Road Transfer Station, located in eastern
Washington DC along the Anacostia River, and Fort Totten located in northern
Washington DC. As reported in the Compost Feasibility Study, there are only
six sizeable composting facilities within 40 miles of the District, and only two
are accepting food waste and yard waste.
                                                                                   Figure 2 DC Region

                                                           7
FEASIBILITY ANALYSIS RESULTS
Part 1: ICI Waste Stream Evaluation
Industrial, Commercial, and Institutional (ICI) food waste is pre- and post-consumer food waste that originates from
non-residential sources, such as:

        •    Restaurants                •    Colleges/universities                       •    Hospitals
        •    Hotels                     •    Supermarkets                                •    Shopping malls
        •    Industrial facilities      •    Schools                                     •    Food manufacturers
        •    Cafes                      •    Government buildings                        •    Airports
        •    Office buildings           •    Nursing homes                               •    Conference centers and
                                                                                              sports facilities

This sector provides an excellent opportunity for low contamination collection in what is often referred to as “back
door collection” or “back of house collection”, referring to collection that occurs in the kitchens of restaurants, schools,
colleges, universities, and other institutions. George Washington University is currently managing back door collection
at two Starbucks locations on campus and diverts 150 pounds per day in coffee grounds from the landfill. These
organics are being composted at the Prince George’s County facility. Examples of other entities in the District that
already are composting food waste include the Smithsonian, Whole Foods, and Mom’s Organics.

When developing estimates for proposed processing facilities, an analysis of potentially available tons is required.
This approach involves the identification of specific locations by business type as identified by the North American
Industrial Standard Classification (NAISC) and the associated number of employees. There are several databases
that provide commercial business data, including the number of employees at each location.

This analysis includes a calculation of the potentially available waste by quantifying the various waste streams based
on the employment numbers from site specific commercial locations in the District of Columbia. The research team
compiled NAISC data for target commercial operations and applied pounds per employee per day waste
generation standards. This information was aggregated to the DC metropolitan level for the following sectors:

    •       Grocery stores
    •       Restaurants
    •       Nursing homes
    •       Hospitals
    •       Public Schools
    •       Colleges/Universities

The quantities of waste estimated in this evaluation represent the amount of material that is generated based on
location specific data. The analysis does not calculate the net quantity of material that may be available after
consideration of current uses of specific waste streams. The quantification of any specific waste stream within the
numerous types of generators cannot be determined without assessments of individual waste streams from a specific
generator because each generator exhibits a wide variety of inputs with different qualities of material.

                                                             8
The estimate for total food waste generation from the Commercial and Institutional sector illustrates that 85,194 tons
of food waste are potentially available from approximately 5,600 C&I generators4. Usually, materials from these
sources will only be available by contracting with large waste haulers that have contracts to collect this type of
material or with large institutions that have large amounts of waste. This material is not currently collected; collection
guidelines and requirements will need to be developed to ensure that the source separated organics (SSO) material
to be collected has low contamination that is within the specifications of feedstock required by a co-digester and
preprocessing facility.
The quantity of food waste generated by the largest commercial generators in the District of Columbia, and therefore
the most highly and easily available, represents 42,000 tons of material and is therefore an attractive source of
material.
A small portion of organics, under 1,500 tons per year, is generated in the industrial sector and not included in the
estimated tonnage capture. Organics generated by the industrial sector are generally different in nature from the
commercial sector, tending to include much higher moisture content. As a result, organics from the industrial sector
can be more difficult to manage and thus are often not included in SSO diversion programs unless they can be
“dewatered”.
Table 1: Potentially Available Food Waste Generation by Sector (Tons per Year, rounded)
NUMBER OF GROCERY COLLEGES/ NURSING RUNNING
RESTAURANT SCHOOLS HOTELS HOSPITALS TOTAL
EMPLOYEES STORES UNIVERSITIES HOMES TOTAL
5,000 -
- - 19,742 - - - 2,187 21,929 21,929
10,000
1,000 -
- - 5,040 - 767 - 2,005 7,812 29,741
4,999
500-
- - 741 - 450 - 328 1,520 31,261
999
200-
- 1,235 226 238 3,470 881 273 6,324 37,585
499
100-
- 2,955 - 431 605 344 174 4,509 42,094
199
75-99 112 2,807 62 264 1,050 82 - 4,377 46,471
50-74 75 7,623 316 369 691 152 62 9,288 55,759
25-49 351 10,958 88 192 537 134 30 12,290 68,049
15-24 195 5,278 41 120 152 48 15 5,849 73,898
10-14 187 3,095 28 43 88 15 11 3,467 77,365
Less
1,812 5,663 66 70 111 87 20 7,830 85,195
than 10
TOTAL 2,733 39,614 26,350 1,728 7,922 1,743 5,106 85,194 85,195
4 A study released in 2017 estimated 114,365 tons per year are generated by the ICI sector. This estimate was done using ReFED
supported generation rates applied to the generalized Business Census data. The total number of employees by each commercial category
can vary significantly from US Business Census data due to the aggregation of data within the census into ranges.
9Approximately 50% of the material is generated by the largest 100 establishments or 2% of the total establishments;
colleges and universities generate approximately 30% of that material. Although nearly 46% of the food waste is
generated in the restaurant sector nearly half of this quantity is generated by smaller restaurants that present a
challenge when developing programs to collect that material.
Table 2: Percent of Total Food Waste Generation by Sector
PERCENT
GROCERY COLLEGES/ NURSING
NO. OF EMPLOYEES RESTAURANT SCHOOLS HOTELS HOSPITALS TOTAL OF
STORES UNIVERSITIES HOMES
TOTAL
Greater than
0% 0% 0% 0% 0% 0% 0% 0% 0%
10,000
5,000-10,000 0% 0% 23% 0% 0% 0% 3% 26% 26%
1,000- 4,999 0% 0% 6% 0% 1% 0% 2% 9% 35%
500-999 0% 0% 1% 0% 1% 0% 0% 2% 37%
200-499 0% 1% 0% 0% 4% 1% 0% 7% 44%
100-199 0% 3% 0% 1% 1% 0% 0% 5% 49%
75-99 0% 3% 0% 0% 1% 0% 0% 5% 55%
50-74 0% 9% 0% 0% 1% 0% 0% 11% 65%
25-49 0% 13% 0% 0% 1% 0% 0% 14% 80%
15-24 0% 6% 0% 0% 0% 0% 0% 7% 87%
10- 14 0% 4% 0% 0% 0% 0% 0% 4% 91%
Less than 10 2% 7% 0% 0% 0% 0% 0% 9% 100%
PERCENT OF
3% 46% 31% 2% 9% 2% 6% 100%
TOTAL
In summary, analysis of the sector reveals that an estimated 85,000 tons of food waste are potentially available for
source separated collection within the Commercial and Institutional sectors annually, and 42,000 tons are highly
available. This material is generated both from food preparation areas and front of house consumers and collection
guidelines and requirements will need to be developed to ensure that SSO material has low contamination. The
Industrial sector produces negligible amounts of food waste and is therefore an unlikely candidate to pursue for co-
digestion. The generation rates presented are estimates and the actual amount may vary. Capture rates will depend
strongly on supportive policy levels and outreach and education efforts.
Part 2: Technology Recommendations
PRE-PROCESSING FAC ILITY
The pre-processing of C&I food waste involves turning the food waste that is segregated and collected into a suitable,
refined feedstock, ready for introduction to the digestion process at DC Water. Pre-processing operations can
include, but may not require all the following activities:
10• Debagging and/or shredding of the materials;
• Manual inspection for physical contaminants;
• Manual and/or mechanical removal of recyclables and/or wastes;
• Particle size reduction;
• Addition of amendments (e.g. water or low solids organic wastewaters) for slurrying; and
• Degritting to remove physical contaminants that made it through other activities in the process.
The extent of pre-processing is a function of the feedstock, the processing technology used, and the ultimate
disposal/outlet for the materials.
Pre-processing involves several sequential steps to convert as-delivered food waste into a slurry at 14% TS. The
process flow diagram below outlines the steps and equipment needed. Inputs include the incoming material (the
source separated food waste) and supplemental water. The incoming material is unloaded onto a tipping floor, fed
into a hopper, shredded (optional), fed through a turbo separator for particle size reduction and contamination
removal, and stored in onsite storage tanks before being hauled in a tanker truck to DC Water’s Blue Plains WWTP.
Figure 3: Process Flow Diagram for Pre-Processing Site
In the case of the pre-processing technologies, the equipment categories can be broken down into hammer mills,
pulverizes, pulpers, and extruders. These technologies have their various pros/cons associated with capital costs,
operational costs, removal efficiency, throughput, uptime/availability, space requirements, etc. Based on the
feedstocks that are projected from the sources outlined earlier, the expected tonnages from the DC area and the
11level of contamination expected, an integrated hammer mill operation would be highly appropriate. Appendix A
contains a detailed description of equipment options and their function in pre-processing, and Appendix B delivers
technology recommendations for Blue Plains WWTP.
Part 3: Pre-Processing Site Criteria
The selection of a pre-processing site within hauling distance of the Blue Plains WWTP is crucial to the financial
viability of this project. Ideally, the pre-processing site would be located within the District, in close proximity to the
Blue Plains WWTP, and adjacent to or co-located with existing District-operated waste processing infrastructure,
such as the Benning Road Transfer Station. This allows for the utilization of existing infrastructure and offsets the need
to develop a new facility from scratch. As shown in the financial analysis above, costs are significantly (200%) lower
to construct a pre-processing facility at the Benning Road Transfer Station as opposed to developing a greenfield
site.
Nevertheless, there are factors that need to be considered when selecting a site, such as setback, ingress and egress,
internal traffic flow, size, zoning, consistency, proximity to transfer stations, proximity to sensitive receptors, storm
water management, composting operations, site layout, etc.
The space required for the site is a direct function of tonnage throughput. At an estimated 78,000 tons/year,
approximately 15,000 square feet of enclosed building space would be required. To facilitate truck access, odor
control, office space, and more, the open area required would be one-half to two acres depending on the shape of
the site. The site would be required to be zoned heavy industrial to facilitate the type of operation proposed. It
should be noted that if the tonnage to be processed was lowered to 42,000 to 55,000 tons/year, it would not have
any impact on the space requirements as the equipment would be the same, but the operational hours would likely
be reduced.
Organics pre-processing requires electricity to allow for the operation of the processing equipment, as well as a
water source to facilitate wash-down of the facility; however, gray water that is stored for moisture adjustment can
be used for this purpose. All wash-down water could also be collected and subsequently used for moisture adjustment
thus negating the need for any wastewater treatment system.
Depending on the receiving hours and loadout timing, the facility could initially be staffed as a one-shift operation,
but as the tonnage increases, the facility may require two shifts. Staffing consists of a receiver/load operator and a
supervisor to ensure that the materials are received and processed. The transportation and delivery of the organic
slurry from the pre-processing site to Blue Plains WWTP could occur through third party permitted contractors.
If the pre-processing facility is co-located with a composting operation, then the combined facility would need the
following:
• Heaviest Industrial Zoning (PDR – Production, Distribution, and Repair)
• 5-10+ acres
• Water & Sanitary Sewer
• Utilities (electricity, and natural gas a nice to have)
• Truck traffic – current and expandable
• Local Engagement
Regardless of the type of facility, it is important to ensure that land is acquired and environmental assessment work
is finalized prior to engaging with design-build partners, as the uncertainty of the land and permitting status will
add risk to the project.
12Part 4: Financial and Operational Feasibility
Financial and operational feasibility are two critical factors used to determine the viability of co-digestion as an
organic waste diversion strategy for the District. Financial feasibility is assessed by determining the tip fee that would
be required to make co-digestion cost-effective for DC Water, and combining it with related system costs, such as
pre-processing costs and slurry transport (also calculated as a tipping fee per ton). Distilling the analysis down to a
dollar-per-ton figure enables the District to understand the cost of delivering material at the WWTP on a unit-basis
and compare it to current solid waste disposal tip fees at transfer stations within the District, once the costs of other
related project factors (such as pre-processing) are included.
Operational feasibility considers operations at both DC Water and at a pre-processing facility. An analysis at DC
Water determines whether or not the co-digestion system at the WWTP can handle food waste being introduced to
it, quantities it can tolerate, and under what circumstances. All else equal, Blue Plains has the operational capability
of processing food waste, as long as the food waste is delivered as a slurry at 14% total solids (TS), according to
model analysis. The next set of questions to be answered concern the limitations, parameters, and criteria of the co-
digestion facility, equipment, site footprint, and infeed material. These factors are evaluated in this study as a function
of financial feasibility and are described below.
FINANCIAL AND OPERATIONAL ANALYSIS OF CO- DIGES TION AT BLUE PLAINS
Part of this evaluation relies on a model developed by DC Water. DC Water’s model, which was thoroughly reviewed
for relevance and application to the subject matter at hand, incorporates a range of technical and financial
characteristics and allows users to test scenarios by adjusting inputs and assumptions. Based on these variables, the
Blue Plains model reveals the limitations, advantages, and impacts of introducing food waste into the solids processing
system for different scenarios. Therefore, the model can be used to determine which components of the system act
as limiting factors, which can in turn be used to define critical knowledge such as the specifications that are needed
for infeed material, maximum quantities and throughput, and where opportunities exist or do not exist for system
modifications. The model ultimately calculates the tipping fee that would need to be charged at the door to customers
delivering pre-processed slurry, which lends insight into the overall financial feasibility of co-digestion.
BLUE PLAINS MODEL ASSUMPTIONS AN D INPUTS
Many of the technical inputs in the Blue Plains model are based on
experiments performed at Bucknell University. The team at Bucknell MODEL ASSUMPTIONS
conducted research for DC Water using a bench scale model of the
thermal hydrolysis process and anaerobic digesters. The team used • Infeed of 200 tpd at 14% TS
samples of DC Water’s biosolids in combination with different feedstocks • 7 days/week operation
to determine many of the parameters included in the electronic model that • Food waste arrives in slurry
was developed to aid in DC Water’s internal decision-making process. form
This research also aided in understanding the feasibility of accepting food • Slurry is delivered directly to
waste by providing an indication on the available capacity of the existing Blue Plains
equipment and systems, as well as, how the facility’s treatment process
and sludge production would be affected. This research indicated that
excess capacity does exist to allow for the acceptance of food waste. Figure 4: Model Assumptions
The model currently assumes DC Water would receive an organics feed of 200 tons per day (tpd) – 73,000 tons
per year – at 14% total solids (TS), seven days per week. The model also assumes that the food waste will arrive
pre-processed, in slurry form, to the receiving station at Blue Plains. Preliminary cost estimates and conceptual
13drawings indicate that the slurry would pass through a screening process and pulper before being fed to the existing
Cambi5 process.
DC Water has estimated that the receiving station will cost approximately $4,000,000 to construct and includes a
pre-engineered building, multiple screen presses for screening, two storage tanks, progressive cavity pumps for
transport of material, pulpers and an electrical building. In addition to this capital investment, the system would
impart additional operational and maintenance costs, and the added operational risk of accepting food waste. In
return, DC Water would require a tipping fee per gallon of food waste accepted that would result in net positive
cash flow in order to be considered financially feasible. In addition, the cost of the receiving facility must result in a
payback of less than 10 years in order to be considered a viable project.
The parameters defined here are the basis of the Blue Plains model and are therefore integral to determining a
dollar-per-ton tipping fee.
TIPPING FEE DETERMIN ATION
Under the model scenario described above, the key assumptions
outlined result in a tipping fee of $0.067 per gallon of slurry at $4M
14% TS, or $16 per wet ton. 200 capital
tpd, cost
14% TS
SENSITIVITY PARAMETERS AND ADDITIONAL
10-year
CONSIDERATIONS ROI
A sensitivity analysis was performed on many of the technical and
financial inputs of the Blue Plains model to identify the parameters
that would have the most significant impact on the required tipping
fee, and therefore the feasibility of the project. The sensitivity
analysis used a base case of a $16/wet ton tipping fee at 14% $16/wet ton
solids.
The analysis revealed that sludge yield is the most sensitive
parameter, followed by the price of power, co-digestate feed rate, Figure 5: Tipping Fee Inputs
and percent total solids. Detailed results of the sensitivity analysis are
provided in Appendix C.
FINANCIAL AND OPERAT IONAL ANALY SIS OF SLURRY DEVELOPMENT A T A PRE-
PROCESSING FACILITY
The second part of the financial and operational feasibility analysis evaluates the capital and operating costs of
building and operating a pre-processing facility that accepts food waste as-delivered, converts it into a slurry at
14% TS, and transports the slurry to DC Water for co-digestion.
Costs vary significantly based on the site selected for pre-processing. This study evaluates two scenarios:
5 The Cambi process is a sludge stabilization system that utilizes thermal hydrolysis to instigate cell lysis and disinfection. This process makes
the sludge more biodegradable which improves digestion performance.
14(1) Building the pre-processing facility at the Benning Road Transfer Station, which has useful built infrastructure
in place6; and
(2) Developing a new site and building a pre-processing facility and all related infrastructure as a stand-alone
pre-processing facility would require considerable time and additional costs for new facilities and
infrastructure.
The first set of financial indicators considered are the costs of operating the pre-processing facility. These costs
include the $16/wet ton tipping fee for slurry delivered to the Blue Plains WWTP, among the other operating costs
shown below in 7. Operating costs are intentionally the same across the two scenarios evaluated here (Benning Road
and a greenfield site), given that a greenfield site assumes generic hauling costs since site location is not known.
Table 3: Pre-Processing Facility Operational Costs
OPEX COST
Plant Manager $117,000
Plant Staff (4 staff)7 $208,000
Pre-Processing Installation Maintenance $188,500
Insurance $20,000
Administration $20,000
Lease Payment - -
Testing $25,000
Emissions + Regulatory Testing $40,000
Electricity8 $168,192
Rolling Stock Lease Payment9 $82,000
Rolling Stock Fuel10 $90,000
Property Taxes -
Slurry Disposal Cost $16/Wet Ton
Slurry Hauling Cost As per Proforma
Residuals Disposal Costs As per Proforma
Diverted Loads As per Proforma
TOTAL OPEX $958,692
OPEX Contingency 10%
6 The Benning Road site was used as a proxy site to demonstrate benefits of co-locating a pre-processing facility with an
existing waste transfer station where infrastructure is already present (scales, electricity, water, etc.), for which the land is
appropriately zoned, and on which space theoretically exists to house both traditional waste transfer and pre-processing
operations for co-digestion. While it is useful for the purposes of modelling the feasibility of co-digestion, additional analysis
would be needed to determine the specific costs to upgrading the Benning Road site for this purpose as the study does not
consider the existing layout or the existing condition of the Benning Road Transfer Station as part of the analysis.
7 Includes 30% for overhead
8 Accounts for 120kw at 16 cents per KWH
9 Includes lease of a loader to feed the hammermill
10 Assumes diesel; co-usage of simultaneous water and gas injection (SWAG) may lower costs
15BENNING ROAD PREPROC ESSING FACILITY ANALYSIS
The cost of preprocessing commercial food waste within the District suggests serious consideration should be made
for developing a composting or anaerobic digestion (AD) facility as close to the generators as possible. If this facility
were located within the District, commercial collection vehicles could direct haul to the facility and residents could
drop-off at the same location.
The operating proforma used in this analysis includes development, capital, and operating expense estimates,
including site development costs. The proforma also includes a two-year development process including engineering
and permitting, an eight-month construction period, and ramping up the operations of the facility once it is constructed
over another two-year period.
In addition to the operating costs shown in Table 3, analysis included the development and capital costs assumed in
Tables 4 and 5.
Table 4: Benning Road Development Costs Table 5: Benning Capital Cost Assessment
ITEM COST ITEM COST
Legal and Admin
Land Costs -
Land Acquisition -
Feedstock $40,000 Detail Engineering -
Engineering Contracting $100,000 Site Works $500,000
Other $50,000 Pre-Processing $3,000,000
TOTAL LEGAL AND ADMIN $190,000
Reception Building $500,000
Engineering
Air & Noise $50,000 Slurry Tank $250,000
Civil $25,000 Piping & Equipment $300,000
Process $150,000
Electrical Controls $500,000
TOTAL ENGINEERING $225,000
Other Construction Insurance $100,000
Environmental Permitting $75,000 Construction Management/Wrap Costs $500,000
Feedstock Testing $10,000 Working Capital $150,000
Additional Consulting / $100,000
Contingency (30% of costs) $1,740,000
Third-Party Reports
TOTAL OTHER $185,000 Financing Costs -
TOTAL $600,000 TOTAL $7,540,000
Table 6 details the results of the financial analysis. A minimum tip fee of $80/ton is required to support a private
sector investment in a facility to preprocess commercial and institutional food waste infrastructure at a 23.3% rate
of return. The model accounts for a ramp-up of SSO collection between 2020 and 2022. Although the C&I waste
stream analysis shows that 85,000 tons of food waste are realistically available for collection, the model uses a
maximum of 78,000 tons, due to the 200 TPD capacity limit of DC Water’s co-digestion process.
In all likelihood, a tip fee at $80/ton guaranteed over a contract period of 10 to 20 years with the inputs of 78,000
tons per year of raw material, would support a capital investment of approximately $7.54 million. The rate of
return on a private sector equity investment would need to be in the 20-25% range, at a minimum, depending on
16the structure of the financing and tax expense. The rate of return will be risk adjusted depending on the term of the
feedstock supply agreement and the “put or pay” provisions that are ultimately agreed upon.
Table 6: Benning Road Pre-Processing Facility Cost Analysis Using Private Financing
ITEM COST
Capital Expense $7,540,000
Development Expense $600,000
SSO Processing Tip Fee ($/Ton) $80.00
2020 2021 2022-2040
DC DPW Food Waste Processed (Tons) 9,425 43,875 78,000
Annual Revenue (Tip Fee) $754,000 $3,510,000 $6,240,000
Annual Operating Expense $1,090,988 $2,627,533 $3,850,955
NET (EBITDA*) -$336,988 $882,467 $2,389,045
Cash Flow IRR 23.3%
*Earnings Before Income Tax, Depreciation, and Amortization
Overall, this type of facility investment could be undertaken as part of a public-private partnership often employed
to create investment opportunities in recycling facilities. A publicly owned facility that is financed through municipal
bonds or other municipal finance instruments could lower the annual cost by eliminating the higher return on investment
factors that are needed if the project is privately financed. In a publicly financed project at the Benning Road
Transfer Station, with an IRR of 5.7%, the tipping fee could be reduced to $60/ton assuming 78,000 tons/year of
food waste, as shown in the table below.
Table 7: Benning Road Pre-Processing Facility Cost Analysis Using Public Financing
ITEM COST
Capital Expense $7,540,000
Development Expense $600,000
SSO Processing Tip Fee ($/Ton) $60.00
2020 2021 2022-2040
DC DPW Food Waste Processed (Tons) 9,425 43,875 78,000
Annual Revenue (Tip Fee) $565,500 $2,632,500 $4,680,000
Annual Operating Expense $1,090,988 $2,627,533 $3,850,955
NET (EBITDA*) -$525,488 $4,967 $829,045
Cash Flow IRR 5.7%
For greater clarity, if the 42,000 tons of food waste is utilized as the base level of material to be processed under
the publicly financed pre-processing facility, the tipping fee would increase to $80/ton to allow for the facility to
cover itself or the facility could offer a tipping fee of $70/ton if it could attract 55,000 tons of food waste per
year.
In an effort to show the sensitivity of the project, the project was modelled at 55,000 tons/year of food waste and
a tipping fee of $70/ton. Based on these assumptions the project achieved a pre-tax unlevered return of 6% which
would allow it to cover itself and be able to handle some volatility on the key parameters including disposal costs,
capital costs, tipping fees to attract material, and annual throughput:
17S E N S I T I V I T Y A N A LY S I S
Disposal Cost
CapEx
Tip Fees
Throughput (Annual Tonnage)
0 5 10 15 20 25 30
PTUL return %
Figure 6: Sensitivity Analysis
GREENFIELD PRE-PROCESSING FACILITY ANALYSIS
The development of a new greenfield facility at a publicly owned location would experience a different cost profile
than a development at the Benning Road Transfer Station due to increased site infrastructure and building
development requirements, which results in a capital cost more than 200% higher than at Benning Road. The
breakdown of Development and Capital Costs are included Tables 8 and 9, respectively. If this facility were located
within the District, commercial collection vehicles could direct-haul to the facility.
Table 8: New Greenfield Site Development Costs Table 9: New Greenfield Site Capital Cost Assessment
ITEM COST ITEM COST
Legal and Admin Land Costs $0
Land Acquisition $0 Site Works $500,000
Feedstock $40,000
Pre-Processing $7,000,000
Engineering Contracting $100,000
Weigh Bridge $200,000
Other $50,000
TOTAL LEGAL AND ADMIN $190,000 Reception Building $2,000,000
Engineering Slurry Tank $250,000
Air & Noise $50,000 Piping & Equipment $300,000
Civil $125,000 Electrical Controls $500,000
Process $250,000 Construction Insurance $200,000
TOTAL ENGINEERING $425,000 Construction
$1,500,000
Other Management/Wrap Costs
Environmental Permitting $150,000 Working Capital $150,000
Feedstock Testing $10,000 Contingency 30% $3,780,000
Additional Consulting / Third-Party Financing Costs $0
$200,000
Reports
TOTAL OTHER $360,000 TOTAL $16,380,000
The proforma analysis includes the same ramp up schedule as the two-year development process scenario including
engineering and permitting, an eight-month construction period, and ramping up the operations of the facility once
it is constructed over another two-year period.
18shows the financial analysis for a public-private financing scenario at a 23.1% IRR, whereas Table 11 presents a
financing scenario using only public funding.
Table 10: Greenfield Facility Pre-Processing Facility Cost Analysis – Public-Private Financing
ITEM COST
Capital Expense $16,380,000
Development Expense $975,000
SSO Processing Tip Fee ($/Ton) $114.00
2020 2021 2022-2040
DC DPW Food Waste Processed (Tons) 9,425 43,875 78,000
Annual Revenue (Tip Fee) $1,074,450 $5,001,750 $8,892,000
Annual Expense $1,253,055 $2,870,633 $4,094,055
NET (EBITDA) -$178,605 $2,131,117 $4,797,945
Cash Flow IRR 23.1%
*Earnings Before Income Tax, Depreciation, and Amortization
Table 11: Greenfield Facility Pre-Processing Facility Cost Analysis – Public-Only Financing
ITEM COST
Capital Expense $ 16,380,000
Development Expense $975,000
SSO Processing Tip Fee ($/Ton) $80.00
2020 2021 2022-2040
DC DPW Food Waste Processed (Tons) 9,425 43,875 78,000
Annual Revenue (Tip Fee) $754,000 $3,510,000 $6,240,000
Annual Expense $1,253,055 $2,870,633 $4,094,055
NET (EBITDA) -$499,055 $639,367 2,145,945
Cash Flow IRR 8.8%
A minimum tip fee of $114/ton would be required to support a private sector investment in a facility to preprocess
C&I food waste infrastructure. In all likelihood a tip fee at this level, guaranteed over a contract period of 10 to 20
years with the inputs of 78,000 tons per year of raw material, would support a capital investment of approximately
$16.4 million. The rate of return on a private section equity investment would need to be in the 20-25% range, at
a minimum, depending on the structure of the financing and tax expense. Given a public-only financing scenario with
a much lower IRR, a reasonable tip fee could fall in the range of $80/ton.
CHALLENGES
The financial analysis above is based on a throughput of 78,000 tons of food waste per year. As described in the
ICI section of this report, 78,000 tons is just below the C&I sector organics generation in the District (from
approximately 5,600 entities). Achieving a capture rate of this level requires aggressive program implementation,
strong supportive policies, extensive education, and enforcement. Once the program surpasses 40,000 tons, which is
19the estimated quantity generated by the largest commercial generators in the District, the additional tonnage comes
from a much larger number of generators. More generators equate to more difficult collection and higher
administrative and program execution costs. Therefore, additional focus was placed on the publicly financed option
with lower annual tonnages and tipping fees required to support the project.
SUMMARY
In the first scenario, a tipping fee of $80/ton would be required for financial project independence using private
financing and $60/ton using public-only financing and assuming 78,000 tons/year of food waste. In the second
scenario, $114/ton is required for private financing and $80/ton for full public financing assuming 78,000 tons/year
of food waste. These tipping fees are reflective of rates for comparative co-digestion projects across the industry
but are higher than current refuse disposal tipping fees at District-operated transfer stations. The higher rates ($114
and $80) may hinder public support for the program. However, certain financing strategies and supportive policies
may create a more favorable economic environment for co-digestion. For example, analysis shows that a 10%
change in the slurry disposal costs (raising or lowering the $16/wet ton slurry tipping fee by $1.6/ton) results in a
1% change in return, which makes the project increasingly more attractive to prospective financers. If a private
developer is willing to accept lower returns, the tipping fees can be respectively lowered. Additionally, if the costs
of development and construction can be reduced or shared with an in-District composting facility the economics may
tip in favor of the project. Finally, the District has the option of setting tipping fees based on levels that would
encourage participation, not based on actual cost. The other area to focus on would be the minimum tonnages that
would be committed to the project such as assuming that the 42,000 tons of food waste was used as the base level
of material to be processed under the publicly financed pre-processing facility. This would lead to a tipping fee of
$80/ton to allow for the facility to cover itself, or the facility could offer a tipping fee of $70/ton if it could attract
55,000 tons of food waste per year. These ideas are explored more fully in the Supportive Policy and Financing
and Implementation sections.
Part 5: Supportive Policy Recommendations
A C&I organics collection and co-digestion program would be most successful with the support of policy. If leveraged,
supportive policies around feedstock regulation, facility siting, community and environmental justice, and financing
can contribute to creating a more cost-effective and optimally designed co-digestion program.
FEEDSTOCK REGULATION
The co-digestion program requires a reliable and consistent volume of organic material to maintain efficiencies of
scale, warrant investment, and contribute toward the District’s zero waste goals. Several policies can accomplish this
goal.
C&I Food Waste Landfill Ban. It is recommended that the District enact a landfill ban for food waste generated by
the C&I sector in the District. Such a policy will help to ensure the success and development of new organics recycling
infrastructure. As of early 2017, similar legislation has been passed in six states. Furthermore, the Sustainable Solid
Waste Management Amendment Act of 2014 provides the Mayor with the ability to promulgate regulations to
require C&I organic materials to be diverted towards appropriate organics processing facilities.
Hauler Licensing and Reporting . There should be a provision for hauler licensing that requires haulers to offer
mandatory SSO collection services and report annually to the District. A licensing structure like this ensures that all
generators in the District have access to SSO collection services.
Flow Control. Flow control regulates the movement of solid waste within and between jurisdictions. It is recommended
that the District investigate options for flow control of organic waste generated in the District to ensure adequate
20You can also read