Colombia's Natural Capital - GROW Colombia Project Report 1 Socio-Economics of Biodiversity Programme
←
→
Page content transcription
If your browser does not render page correctly, please read the page content below
Colombia’s
Natural
Capital
GROW Colombia Project
Report 1
Socio-Economics of
Biodiversity Programme

               January 2020
GROW
COLOMBIA
PROJECT
SERIES
Authors
Kerry Turner
                                                                              Colombia’s
                                                                              Natural Capital
Valeria Toledo-Gallegos
Silvia Ferrini
Jaime Erazo
Corrado Di Maria
Natalia Valderrama

                                                                              GROW Colombia Project Report 1
Federica Di Palma                                 This QR code links to the
                                                  GROW Colombia website
                                                  where you can download
This report should be cited as:                   this document and other
Turner, R. K. et al., 2020. Colombia’s Natural    resources of the project.
Capital. Report 1. GROW Colombia Project
Series. GROW Colombia Project UKRI GCRF
Grant BB/P028098/1. Norwich, UK.
Acknowledgements:
The authors would like to acknowledge
support from the UK Research and
Innovation (UKRI) Global Challenges
Research Fund (GCRF) GROW Colombia grant
via the UK’s Biotechnology and Biological
Sciences Research Council (BB/P028098/1).
Research support: Saskia Hervey, Adam
Ciezarek, Sasha Stanbridge, Keila Guillén-
Oñate, Rossella Atzori, Juan Azcárate.
Operations support: Richard Doyle.
Editorial Design: David Alejandro Reina                                       Socio-Economics of
Caviedes and Carolina Gómez Andrade.
Copyrights:                                                                   Biodiversity Programme
           Attribution (CC BY)
This work, with the exception any content
                                                                              January 2020
marked with a separate copyright notice,
is licensed under a Creative Commons
Attribution 4.0 International (CC BY 4.0). With
this licence you can distribute, remix, tweak,
and build upon your work, even commercially,
as long as you credit the original creation.
To see the complete licence visit https://
creativecommons.org/licenses/by/4.0/
© Copyright 2020 – The Authors. Please
use cited reference shown above.
Photography
© Shutterstock.com and their respective
authors, unless stated otherwise.
For further information,
please contact:
GROW Colombia Project
Phone: +49 (0) 1603 450001
Email: www.grow-colombia@earlham.ac.uk
Website: www.growcolombia.org

ISBN Print 978 1 9163470 0 7
ISBN Digital 978-1-9163470-1-4
                                                  Funders
https://doi.org/10.6084/m9.figshare.11762190.v1

                                                                                                         BRIDGE
January 2020
Content
Colombia’s Natural
                                           3
                                           pg. 22
                                                    Drivers and Pressures
                                                    of environmental
                                                    change
                                                    3.1.     Population growth
                                                             and demography
                                                    3.2.     Economic growth

Capital / Report 1                                  3.3.
                                                    3.4.
                                                    3.4.1.
                                                             Climate change
                                                             Biodiversity threats
                                                             Agriculture expansion
January 2020                                        3.4.2.   Cattle ranching intensification
                                                    3.4.3.   Deforestation and
                                                             degradation of forest
               pg. 10   Executive                   3.4.4.   Overfishing
                        Summary                     3.4.5.   Mining and oil extraction

               1                           4
                        Decision support            State and impact:
                        systems for                 Natural capital
                        natural capital             and ecosystem
               pg. 12   planning and                services
                        management         pg. 48   4.1.     Biodiversity of biomes
                                                             and ecosystems
                                                    4.2.     Biodiversity of species
                                                    4.3.     Forests and land use
                                                    4.4.     Fisheries
                                                    4.5.     Nature-based tourism
                                                             and eco-tourism

               2                           5
                        Geographic                  Policy
                        context and                 Response
                        climate                     5.1.     Environmental networks
               pg. 16                                        and institutions
                                           pg. 62   5.2.     Environmental policy and
                                                             Payment for Ecosystem
                                                             Services (PES)
                                                    5.3.     Other initiatives for
                                                             biodiversity conservation

                                           pg. 72   References &
                                                    Annexes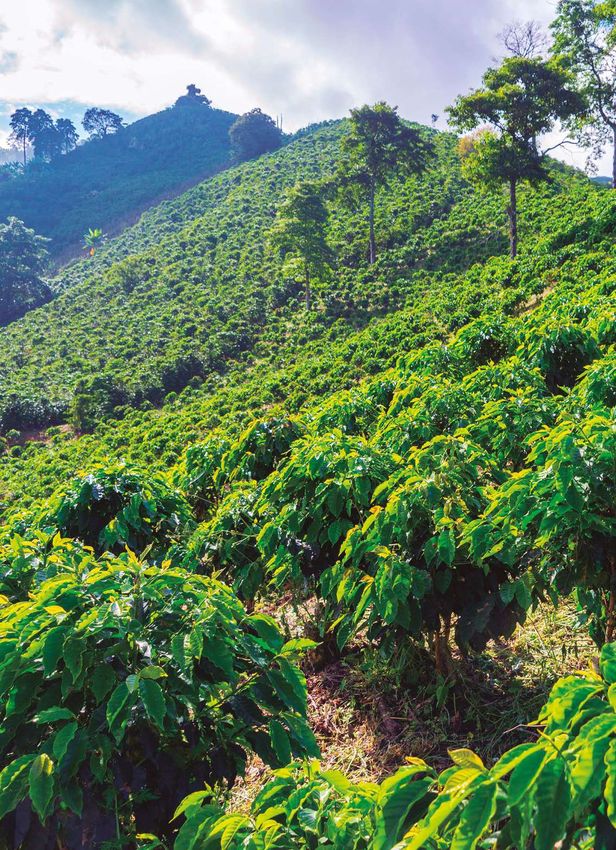
Colombia’s Natural Capital / Report 1

    Colombia’s
    Natural
    Capital / Report 1
    T   he present report provides an
        extensive review of Colombia’s
    Natural Capital and uses the Driver-
                                              of its topography, hydrology and
                                              climatic conditions (section 2). This
                                              is followed by section 3, which
    Pressure-State-Impact-Response            summarises the most important
    (DPSIR) framework to describe the         driving forces of environmental
    interactions between society and          change and describes ways
    the environment in Colombia. This         in which they apply pressures
    review is important to highlight          (section 3.4) on the country’s
    the key environmental, socio-             natural environment. Afterwards,
    economic and institutional features       section 4 assesses the current
    that can pose challenges to the           state and trends of biodiversity,
    future sustainable development            natural capital, and ecosystem
    of Colombia. A subsequent                 services in Colombia. The final
    report 2 will concentrate on the          section (section 5) aims to present
    policy responses investigated by the      examples of relevant institutional,
    GROW Colombia team to promote a           political and academic responses
    switch from current unsustainable         to fight back the environmental
    agriculture and economic practices        change and degradation in
    toward bio-economy strategies.            Colombia. This last section also
                                              presents a historical review of the
    The report is organised as follows:       use of payment for ecosystem
    the following section describes           services in the country as a
    the problem-structuring DPSIR             legal instrument to counter the
    framework and its utility for             biodiversity loss and degradation
    understanding the causes of               of biodiversity and natural capital
    environmental change in Colombia.         (section 5.2). Finally, section 5.3
    Prior to the definition of the DPSIR      of the document refers to other
    components, this document                 initiatives playing a vital role in
    describes the geographical                the promotion of biodiversity
    context of the country in terms           conservation in Colombia.

8                                                                                                              9
                           GROW Colombia Project / Socio-Economics of Biodiversity Programme   January 2020
Colombia’s Natural Capital / Report 1                                                                                                                                               Executive Summary

                     Executive
                     Summary                                                                  sustainable development,
                                                                                              based on rising levels of
                                                                                              employment and improved
                                                                                                                                        Colombia has particular
                                                                                                                                        geographical and climate
                                                                                                                                        characteristics, which have
                                                                                              living standards. Colombia’s              also conditioned the prevailing
                                                                                              biodiversity is a vast store of           governance processes relevant
                                                                                              wealth, providing humanity with           to environmental policy and

                    G     ROW Colombia is a four
                          year bioscience research
                     and capacity building project to
                                                          that countries like Colombia
                                                          face in the 21st-century. The
                                                          future development of Colombia
                                                                                              multiple benefits - known as
                                                                                              ecosystem services - including
                                                                                              food, shelter, livelihoods, cultural
                                                                                                                                        management. A key role in these
                                                                                                                                        processes is played by SINA, which
                                                                                                                                        is a network of institutions that are
                     preserve, restore and manage         will be dependent on domestic       and other gains, together with            at the forefront of environmental
                     biodiversity through responsible     policy decisions and the effects    the life support system itself.           policy and strategy. To date,
                     innovation in Colombia. This         of international trade and global                                             policy responses have included
                     multidisciplinary initiative is      environmental governance.           In order to bring together the            payments for ecosystem services
                     funded by the UK Government’s                                            range of issues that surround             schemes in which landowners
                     Global Challenge Research Fund       The second report will look at      Colombia’s future development             are paid to conserve elements of
                     and involves a wide, international   future policy responses in more     and to link together the factors          biodiversity instead of expending
                     collaboration of academic and        detail, for example, switching      likely to cause environmental             or intensifying of the land uses, as
                     civil society partners united        away from current agricultural      changes to nature and human               well as other policy measures.
                     in a shared vision to conserve       regimes to more sustainable         well-being, this report uses
                     biodiversity, achieve sustainable    production systems for sugar        the “DPSIWR framework”. The               Although we recognise that
                     prosperity and secure lasting        cane and cocoa, and developing      analysis is sequential and                contemporary environmental
                     peace in Colombia. The project       more ecotourism. A third report     circular: it starts with the drivers      challenges faced by all countries
                     has a strong socio-economic          will present case studies of        and pressures (DP) causing                demand urgent action, including
                     component involving the              selected green policy switches,     the state of the environment              consideration of social limits
                     Earlham Institute, University        through projects seeking to         to change (S), then examines              to growth, we advocate not
                     of Sydney, Universidad de            change land use practices           the pressures of these changes            a sharp macro policy switch,
                     Los Andes and led by the             and promote new income              on human well-being (IW), and             but an evolutionary transition
                     University of East Anglia.           and employment streams.             completes the circle by including         towards a sustainable, low carbon
                                                                                              possible policy responses (R)             bioeconomy, facilitated by a
                     This report is the first in a        Colombia is the second most         to mitigate or adapt to the               national “Green Growth” investment
                     series from GROW Colombia’s          biodiverse (in terms of plants,     changing environment. Policy              strategy. This approach will promote
                     socio-economic team. It              animals and habitats) country       changes, when implemented,                economic development, maintaining
                     contains a scoping exercise to       on Earth. Its natural capital       will have consequent effects              incomes and improving livelihoods,
                     understand the environmental         offers great opportunities for      on Colombia’s environment                 whilst conserving biodiversity
                     challenges and opportunities         wealth creation and accelerated     and socio-economics.                      resources for future generations.

10                                                                                                                                                                                                       11
                                                                                                                     GROW Colombia Project / Socio-Economics of Biodiversity Programme    January 2020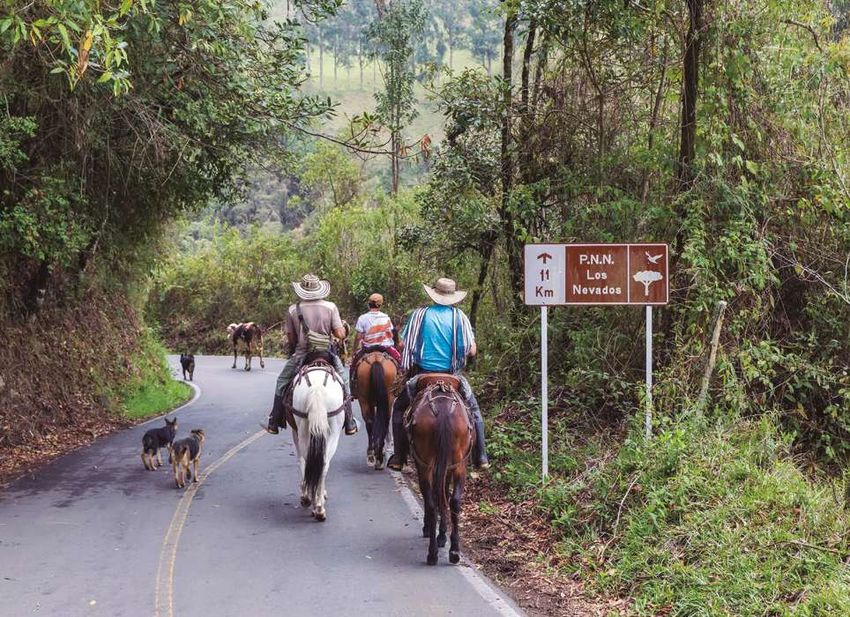
Decision support
systems for natural
capital planning
and management
Colombia’s Natural Capital / Report 1 Decision support systems for natural capital planning and management
1
semi-natural areas, which lead quantity flow problems may be
to increased release of nutrients further exacerbated by urban
(Nitrogen and Phosphorus) and infrastructure expansion
into watercourses and loss of with increased demand for
Decision support
biodiverse wetlands and forested water storage and supplies
lands. The watercourses and and accentuated rates of
their ecosystem services may also runoff. Policy makers can
systems for
be impacted by the release of mitigate these pressures and
sewage after accidental leakages impacts implementing a set of
and stormwater overflows. The adequate policy instruments.
natural capital
end result is a change in water
quality, reducing the potential This report focuses on the
quality of drinking water, and drivers, pressures and impacts Figure 1.
biodiversity, recreation and on Colombia’s environment and
planning and
Natural and
ecological
amenity benefits with adverse economy. A subsequent report boundaries
welfare consequences. The concentrates on policy responses and the
extended DPSRI
water quality impacts and within a green growth strategy.
management
framework
O G ICAL SYSTEM
OL S
C
E nvironmental change and environmental issues and human E Na
tu
consequent impacts on human actions, and has been modified r
SOCIAL SYSTEMS
al
welfare nationally and regionally, and enhanced over succeeding
Va
can be scoped and assessed years (Elliott et al., 2017). It
ria
DRIVERS OF CHANGE
b il
using a natural capital approach provides a scoping framework to (e.g. Population growth,
ity
encompassed within a so-called highlight the indicators needed economic growth,
climate change)
DPSIWR (Drivers-Pressures- to enable feedback to policy ACTIVITIES
State-Impact-Welfare-Response) makers on pressures and drivers RESPONSES FEEDB
ACK (e.g. residential
development, agricultural
framework. This is an indicator- of environmental quality changes (policy measures) innovations)
based framework which brings and resulting socio-economic
together information (in a causal impact of the choices currently
chain) covering changes in socio- made (policy responses), or
economic systems (drivers and to be made in the future. IMPACTS PRESSURES
(mechanisms of change
pressures) with consequential (e.g. changes in
e.g. nutrient enrichment
state changes and welfare impacts In the water resource context, the human welfare)
of water bodies)
on humans. As illustrated in Figure DPSIWR assessment could take
1 the loop is completed by policy the following form: drivers such
CHANGE
responses and systems feedback. as population growth and food IN STATES
security concerns can stimulate (e.g. enviromental
The initial DPSIR framework agricultural change activities such characteristics)
was adopted by the European as new fertiliser regimes and use
Environment Agency in 1995 rates, expansion of agricultural
(later expanded to DPSIWR) to link areas into previously natural /
14 15
GROW Colombia Project / Socio-Economics of Biodiversity Programme January 2020
Geographic
context and
climate
Colombia’s Natural Capital / Report 1 Geographic context and climate
2
mostly swampy with the reed- industrial establishments that
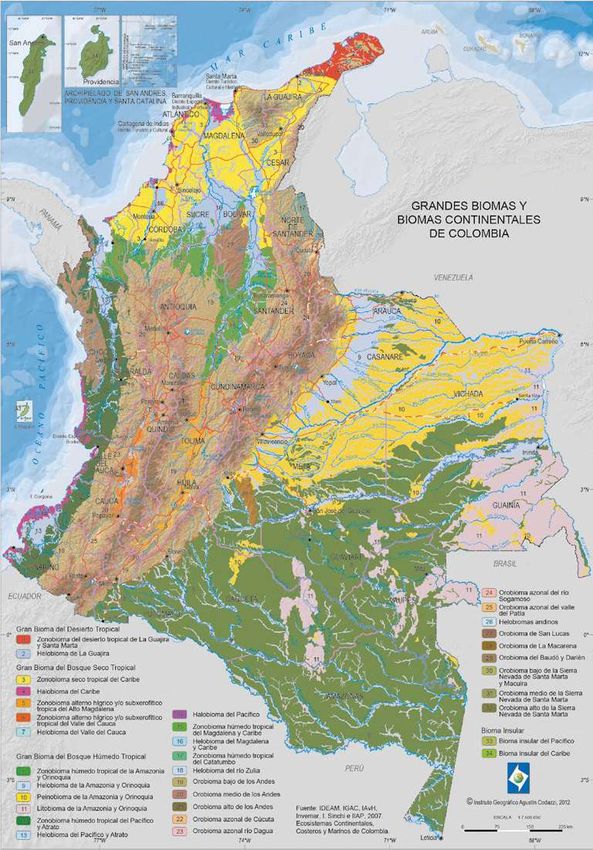
Figure 2.
filled marshes. In the east the produce much of the country’s Geographical
Guajira Peninsula is semi-arid. national wealth. Northeast of map of Colombia
Source:
To the north of Bogotá, there are the Magdalena river, there is the Wikipedia.
two densely populated basins Santander Department, which Available
at https://
named Chiquinquirá and Boyacá is a spacious open valley, used commons.
which contain fertile fields, for intensive agriculture. The wikimedia.org/
wiki/File:Mapa_
productive mines, and large southern side of the country de_Colombia_
(relieve).svg
Geographic
context and
climate
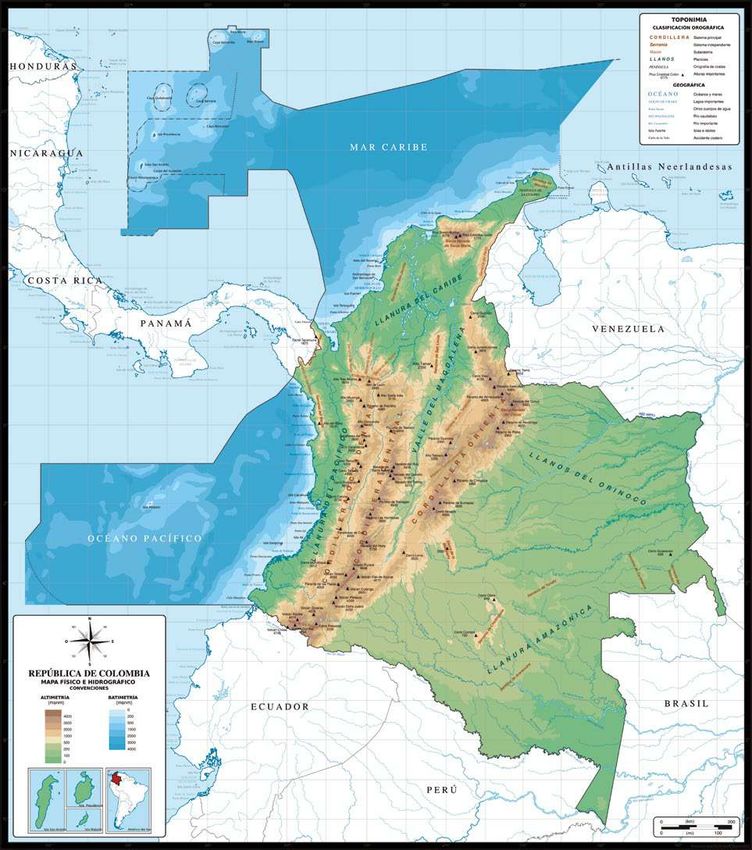
C olombia is a Latin American
country with an extensive
coastline bordering both the
region, the Cauca River represents
an important natural feature which
sustains riparian agricultural areas.
Pacific Ocean and the Caribbean The central mountain range is the
Sea. Colombia’s landscape is highest of the three branches of
very complex and diverse and the Colombian Andes. The eastern
has played an essential role mountain range is moderately
in driving human settlements high, and different from the other
and economic activities. two, in that it contains several
large basins. The Magdalena
Three mountains (the Cordillera River is the main river in the
Occidental, Oriental and Central) country. It stretches from the
occupy the central south part of Andean Cordilleras Central and
the country (see Figure 2). The Oriental in the south to the
northern part of the country Caribbean Sea in the north.
(St. Marta) has the highest peak
of the country, named Pico In eastern Colombia, the land is
Cristobal Colon (5775 m). In the flat (or gently rolling) and mostly
western part of the country, there covered by forests. Colombian
are mountains (the Cordillera lowlands represent almost 60
Occidental – top 4,670 m) which per cent of the country’s total
separate the ocean lowland region land area. The lowlands in the
from the Cauca valley area. In this western part of the country are
18 19
GROW Colombia Project / Socio-Economics of Biodiversity Programme January 2020Colombia’s Natural Capital / Report 1 Geographic context and climate
contains the Orinoco region, of Ecosystem Services (ES). country. The north of Colombia
which mainly comprises flooding Currently, market forces are (region sharing a border with
savannas which share the same trying to shift this land use Panama) is covered by the
ecological and environmental towards palm oil plantation or rice Northern Paramo forest, whereas
function as wetlands. This area production (Vargas et al. 2015). the southern part of the country
has been extensively used for contains the Amazonian forest
cattle ranching with severe The Caribbean lowlands region that leads to other Latin American
impacts on their provision has the longest coastline in the countries. The northeast region
(around Cucuta) has well-
established communication and
Figure 3. transport routes with Venezuela.
Climatic zones
Source: In the Caribbean Sea, the country
IDEAM, has the peninsular archipelago
IGAC, IAvH,
INVEMAR, of San Andres Island and the
SINCHI (2008) Insular Territories of Colombia.
These areas are crucial for
experimentation and research
in different fields (e.g. genetics,
medical treatments), as well as
representing a strategic piece
of land for military purposes.
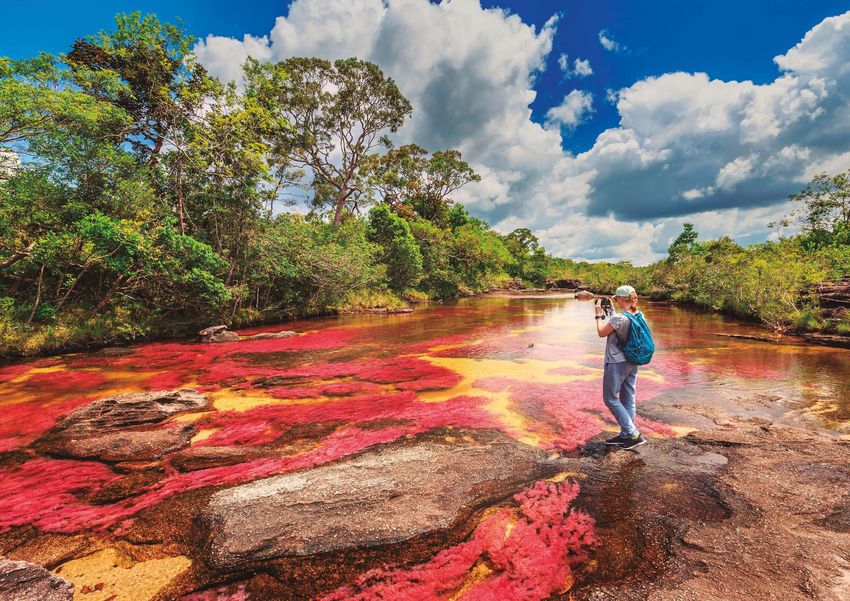
Colombia is one of the wettest
countries in the world, particularly
in the Pacific region. Nonetheless,
other regions can suffer from
drought or extreme events. For
example, Food and Agriculture
Organization of the United Nations
(FAO) reports that between
the years 2015 and 2016 more
than 87.000 hectares of land
were affected by El Niño, which
impacted the country’s coffee,
cotton and potato production
The sunset
(FAO, 2017). In the central and at Tarapoto
oriental zones average temperature lake. (Photo
taken Jaime
is warmer (Figure 3), and at the Erazo during
higher elevations of this zone, the the Amazon
Expedition in
agriculture production systems August 2018)
benefit from two wet and two
dry seasons each year.
20 21
GROW Colombia Project / Socio-Economics of Biodiversity Programme January 2020Drivers and Pressures of environmental change
Colombia’s Natural Capital / Report 1 Drivers and Pressures of environmental change
3
important drivers of environmental demographic transition in which
change in the Colombian context: the number of young people is
reducing, and that of the elderly is
3.1. Population growth increasing. From 1985 to 1990, the
and demography birth rate (number of births per
100,000 inhabitants of childbearing
The preliminary results of the age) was 28.8 births. However, the
National Census (DANE, 2018)1 national birth rate projected for
Drivers and released in November 2018
indicate that Colombia has a
population of 42.8 million, of
the years 2015 to 2020 was only 18
(Vargas, 2017). The life expectancy
in Colombia has changed
Pressures of
whom 48.6% are male, and 51.4% significantly. It has increased from
are female. In terms of education, 62.3 years in 1974 to 76.1 years at
DANE (2018) reported that La present (Vargas, 2017). The place
environmental
Guajira, Sucre, Córdoba, Vichada of residence of the population
and Chocó are the departments in Colombia has also changed
with the lowest literacy rates in the drastically in the last century. In
change
country (between 83% and 90%). 1938, 70% of the inhabitants were
located in rural areas, while 30%
Canoes and
Colombia’s demography is lived in the cities. However, by the port facilities
changing. The country is currently 2005 census, 74% were located in in front of
the main
going through the final phase of a urban areas, in contrast to 26% of Cathedral
people living in rural areas (Vargas, in Quibdó
T
(Photo
he drivers of change in the D-P- In Colombia, for example, 2017). The most recent statistics taken by
S-I(W)-R framework, refer to population change, economic 1
The preliminary results include a geographical developed by DANE (2018) indicate Jaime Erazo
during the
individuals ‘basic human needs’ growth, urban development, coverage of 99.8% of the territory. that from the total number of Cocoa Chocó
for shelter, food and water; as agricultural change, and climate Expedition in
March 2019)
well as the need for mobility, change are all relevant drivers of
entertainment and culture. Drivers environmental change that have
of change can be immediate or caused significant environmental
longer term, and they usually changes (pressures). These include
lead to human activities (e.g. biodiversity loss, deforestation,
transportation, food production) the overexploitation of fishery
which are developed to meet and mineral resources. Increasing
society’s needs. As a result of the understanding of the most
the production or consumption important drivers of ecosystems
processes, these economic changes in Colombia, as well as the
activities exert pressures on pressures and impacts they cause
the environment, such as the leading to natural capital and
exploitation of environmental ecosystem services degradation,
resources, accelerated changes is vital to understand their effect
in land use, and the rise in on human wellbeing (Millennium
emissions of greenhouse gases, Ecosystem Assessment, 2005).
chemicals, waste, radiation, Similarly, it is relevant to develop
noise, to the air, water and soil. policies that aim to safeguard the
In other words, a pressure is a natural capital and to maintain
means by which at least one the provision of ES in Colombia.
driver causes or contributes to Therefore, the following section
the environmental state change. presents some of the most
24 25
GROW Colombia Project / Socio-Economics of Biodiversity Programme January 2020Colombia’s Natural Capital / Report 1 Drivers and Pressures of environmental change
censed households, 78.4% reside agricultural activities (e.g. coffee
in the municipal capitals, 15.0% growing) are left short of workers
were found in dispersed rural areas during the harvest season. It has
and 6.6% in populated centres. been estimated that in the period
2005 and 2014, the number of
Despite the dynamic of rapid inhabitants in the dispersed rural
modern urbanisation, regionalism communities (areas dedicated
and local identification continue to agriculture and livestock) “Chiva”
(Photo taken
to be an important reference fell from 7 million inhabitants by Jaime
point for classifying cultural to 5.1 million (Vargas, 2017). Erazo during
the ex-
differences among Colombians. In combatants
the countryside, the urbanisation Currently, Colombia has five workshop in
July 2019)
phenomenon has led to a drastic cities with more than one million
fall in the size of the population inhabitants: Bogotá (7,150,000
which means that several inhabitants), Medellin (2.4 million),
Cali (1.9 million), Barranquilla centre and south-west households
and Cartagena (Vargas, 2017). have predominantly less than
The Andean region of Colombia three people (DANE, 2018).
Figure 4. has the largest concentration of
Population by
geographic
the population (Figure 4) (DANE, Colombia, together with Brazil,
region 2018). The majority of Colombians Peru and Mexico, is a country that
Source:
DANE (2018) C ARIBE live in or around Bogota, or in the possesses an important cultural
Cantidad de personas
mountainous western portion of the heritage related to the indigenous
10.000.000
INSUL AR country, as well as in the northern population (Arango and Sánchez,
5.000.000
coastline. The southern and eastern 2004). By 2005, the national
1.000.000
100.000
regions of the country contain census estimated the indigenous
sparsely inhabited tropical rainforest population at 1,378,884 people,
and inland tropical plains containing which represents 3.3% of the total
ANDINA large livestock farms, oil and gas national population (MADS and
production land, small farming PNUD, 2014). Indigenous people
communities and indigenous tribes. reside in the tropical forest and the
ORINOQUÍA natural savannas of the Amazon and
The highest proportions of the Orinoquia, the mountain ranges
people under 15 years old of the Baudo (Pacific); the peninsula
are concentrated in Vichada, of La Guajira; the northwest of
La Guajira, Vaupés, Guainía, the department of Cauca and the
Amazonas and Chocó. The highest Sierra Nevada de Santa Marta. In
concentration of population in the other regions of the country,
PACÍFIC A the productive age range (15 to the indigenous people live in small
64) is located in the centre and
southwest of the country. Finally,
AMA ZÓNIC A
part of the Andean region, Valle Colombia poses a rich
and Nariño have the highest
population proportions of people and diverse cultural asset
aged 65 and above (DANE, 2018).
Regarding the household size,
including indigenous
the north and east of the country
have larger households (more
communities who still
than three people), whereas in the occupy natural areas
26 27
GROW Colombia Project / Socio-Economics of Biodiversity Programme January 2020Colombia’s Natural Capital / Report 1 Drivers and Pressures of environmental change
100% increased the demand for palm oil The population of Colombia is
90%
13%
15% plantations in different areas of at high risk from climate change
27% Primary sector
the country (Colombia is already impacts since the main settlements
80% a leading producer). Thus the have been established in coastal
11%
association of palm oil producers zones which are prone to flooding,
70%
Industry Buildings has suggested raising its production as well as in unstable lands in the
21% to a level which will require 743,000 elevated Andes where there is
60%
ha of land by the year 20203. a propensity to water shortages
50% (PNUD Colombia, 2010). Moreover,
Transport, communications
and public services The city of Cartagena is the Colombia has a high incidence
40% 56%
49% main seaport in the country with of extreme natural disasters that
30% Commerce
important petrochemical and might become more recurrent
20%
tourism activities. Santa Marta with changing climatic conditions
Finances and is a smaller seaport and tourist (Pardo Martínez and Alfonso Pina,
10% other services city in the country. Barranquilla 2018). Nonetheless, the government
city (located 25 miles from the has developed a Low Carbon
0%
Caribbean coastline) is a more Development Strategy, which aims
1970 1977 1984 1991 1998 2005 2012
developed city with a greater to i) identify and assess low-carbon
number of industries and alternatives and opportunities; ii)
Figure 5. commercial places (e.g. metalwork design of low-carbon plans, policies
Colombia’s
PIB evolution and construction). Barranquilla’s and measures; as well as design and
Source: Pérez- communities or in areas where the coast. Inland from these cities, inhabitants have the highest construction of a measurement,
Rincón (2016)
mestizo2 population predominates. there are swamps, small streams, education level in the region, and reporting and verification system
There are more than 83 indigenous and shallow lakes that support the city is well-known as the starting (UNDP, 2019). To the date, the
tribes who speak approximately banana and cotton plantations. point of the country’s development country has formulated 12 Nationally
68 languages and 292 dialects in (phones, public lighting, air mail, Appropriate Mitigation Actions
Colombia (MADS and PNUD, 2014). The Airport in Bogota city has planes and industrial works). (NAMAs) of which 50% are developed
the largest cargo volume in Latin in the energy supply sector, 15% in Figure 6.
3.2. Economic growth America and registers the highest 3.3. Climate change the transport sector and 7.5% in the Sectoral
distribution of
number of tourists (per year) in the agriculture industry (see Figure 6). Colombia’s NAMAS
Colombia’s primary industries country. A project to build a second Climate change is one of the most Source: NAMA
Database (2019)
are textiles, chemical products, airport in Bogota city is also being significant challenges humanity is
metallurgy, cement, cardboard discussed. Bogota is the principal currently facing. During the last two
containers, plastic resins and economic, trade and industrial decades, Colombia has experienced 8%
Industry
beverages. The services sector centre of Colombia. In 2016, a rise in greenhouse gas (GHG)
in the country has become Bogota attracted the attention of emissions. The highest contributors 12%
increasingly important (Figure the World Cities Study Group and to GHG emissions in the country Waste
5), currently representing 60.3% Network (GaWC) who defined it are the agriculture, silviculture and
of the GDP and employing as an important world city that other related land uses. The energy
69.9% of the workforce (Nordea links major economic regions into sector (i.e. transportation sector
Trade Portal, 2018). The trade the world economy (called Alpha- and energy generation) also has
routes in the country go through cities). Bogota is a modern city with a significant contribution to the 50% 15%
Energy Transport
Cartagena, Barranquilla, Santa an extensive and comprehensive national GHG emissions (Pardo supply
Marta, and the other ports network of bike paths. Colombia Martínez and Alfonso Pina, 2018).
located along the Carribean has other “green projects”. For
instance, it has increased its biofuel
blend mandate to 10 per cent for 7.5%
2
Mixed race individuals, having
most of the country (Conlon and 3
The area of land used for palm
Agriculture
7.5%
Spanish and indigenous descent. Gomez, 2018). This policy has oil in 2011 was 427,000 ha. Buildings
28 29
GROW Colombia Project / Socio-Economics of Biodiversity Programme January 2020Colombia’s Natural Capital / Report 1 Drivers and Pressures of environmental change
3.4. Biodiversity threats replacement by invasive species. The of infrastructure, the mining 2005 and 2010 are the Andes
environmental transitions shown in industry (8.5 million ha in 2010), and Amazons regions.
Areas where primary vegetation this figure caused an 18% change hydrocarbon extraction (oil b) Expansion of the agricultural
has been replaced by homogenous in species composition over the production increased by a third sector: between 2000 and
vegetation covers such as crops and whole country, but mainly, in areas and natural gas production by 2011, the total harvest
grasslands (see the yellow areas where anthropic presence is more 70%), livestock farming (35% area reached 6.7 million
in Figure 7 which represent the extensive such as the Andean region. of the Colombian territory), hectares; and between 2005
agricultural land) have experienced the agricultural industry, and and 2010 at least 55.7%
significant loss of biodiversity. Red The most critical economic logging (WWF-Colombia, 2017). of the transformation of
areas suggest a reduction in species pressures to biodiversity in the land cover area can be
composition, due to reductions Colombia relates to the unplanned According to MADS and PNUD attributed to this driver.
in the number of species or and uncontrolled development (2014) the activities identified as
drivers of biodiversity loss are:
a) the agroindustry expansion,
which generates homogenous Biodiversity is an
landscapes dominated by
important store of
Figure 7.
Change
in species monocultures; b) the expansion
composition due
to changes in
the use of land
of mining areas which occupied
35% of the Colombian territory wealth and should
Source: Moreno
et al. (2016)
(40 million hectares between
solicitations, granted and strategic
be protected.
areas) in 2012, and generates
land use conflicts as mining areas
overlap with agricultural and forest c) Livestock farming: 35% of
conservation areas; c) hydropower the Colombian territory is
generation, which changes being used for livestock
hydrological regimes and affects farming, but only 50% of
species migration and influence this area is suitable for
wetlands and other flooding areas; herding. Extensive livestock
d) urbanization, that might result farming is a crucial factor
in adverse environmental effects leading to deforestation and
on surrounding rural areas; and land degradation outside
e) overfishing that generates natural savannahs, where
ecosystems’ deterioration and 54% (1.18 million hectares)
overexploitation and has led of plant cover in wetlands
to significant reductions on is affected by this driver.
the total catches (e.g. the 2010 d) Mining and energy
catch represented only 25% production: mining titles had
of the 83,000 tons estimated increased from 1 million in
for the 1972 production). 2000 to 8.5 million in 2010.
Coal production doubled
Other threats affecting between 2000 and 2011,
biodiversity loss identified by turning the country into the
WWF-Colombia (2017) are: first most significant producer
of Latin America (11th
a) Deforestation: responsible worldwide). Around 90% of
for most impacts on socio- mining operations of precious
ecological systems. The most metals in the Pacific Coast
deforested areas between are illegal, and this activity
30 31
GROW Colombia Project / Socio-Economics of Biodiversity Programme January 2020Colombia’s Natural Capital / Report 1 Drivers and Pressures of environmental change
A Green Growth i) Climate change: Colombia
emits 0.4% of worlds total
Some of the drivers that
generate changes over coastal
d) Discharge of pollutants
by tributary rivers:
strategy can help to greenhouse gas emissions.
However, large-scale
and marine ecosystems, and
associated ecosystem services
tributaries that flow into
the Colombian Caribbean
transition to a more changes are expected in the are (INVEMAR, 2018): and Pacific coasts bring
sustainable low country and in particular in
the Andes and the Caribbean a) Inadequate use of fishing
with them pollutants
produced by the socio-
carbon economy region. In these regions,
the weather is projected to
resources: overfishing
led to a decline in fishing
economic activities that
develop along its basin
shift from semi-humid to yield of the Pacific and (e.g. agriculture, livestock,
degrades 79,000 hectares. semiarid in the next century. Caribbean coasts; also, mining, industry). The
There are also mining titles Climate change can increase it has caused reductions marine ecosystems receive
that have been requested the number of threatened in fish abundance due organic matter, suspended
inside protected areas. species in tropical mountains to high levels of capture. solids, hydrocarbons, Low sanitation
e) Wood and charcoal: illegal There is also a decline heavy metals, and condition in
and cause extinctions the river of
extraction is a significant (Moreno et al., 2016). in the income obtained other contaminants Quibdó (Photo
taken by Jaime
threat to biodiversity since j) Armed conflict: Attacks from using several fishing that deteriorate sea Erazo during
40% to 50% of lumber against oil pipeline techniques, and some environmental quality. the CacaoBio
Expedition
is taken this way. infrastructure have caused of them are lower than in Chocó in
f) Wildlife trafficking: this environmental damage. the minimum salary; March 2019)
driver is a cause of the The armed groups have b) Marine contaminants
decrease of local wildlife also deforested large areas from terrestrial sources:
populations in Colombia (i.e. to cultivate illegal crops the inadequate treatment
birds, mammals, reptiles, and open unauthorised of liquid and solid waste
amphibians, fish). Between highways in protected areas. from the populations and
1996 and 2010, Colombia The signing of a peace treaty socio-economic activities
was the second largest between the Colombian that take place both in
exporter of live reptiles (2.9 government and FARC coastal areas and in the
million) and reptile skins presents an opportunity to interior of the country. In
(9.6 million) in the world. manage natural resources addition to this, there are
g) Introduction of exotic more sustainably but also environmental emergency
species: accidental or could lead to large-scale events, such as spillage of
deliberate introduction of landscape transformation crude oil intentionally or
these species can generate processes, since the accidentally, with deficient
changes in structure and armed conflict served as a contingency plans.
composition of natural barrier to the exploitation c) Low sanitation coverage:
species, ecological of natural resources in a situation affecting most
imbalances, degradation several rural and difficult to municipalities in the Pacific
and loss of ecological access areas characterised coast and some of the
integrity and reduction by high biodiversity Caribbean coast, where
of genetic diversity. (Earth Institute, 2018). the is a lack of adequate
h) Water and soil pollution: in k) Water and soil pollution: management, treatment
2012, it is estimated that Colombia is ranked the and final disposal of
205 tons of mercury spilt third country in the world generated waste collected
to soils and waters from in terms of pollution due by the service provider.
179 municipalities in 15 to mercury emissions and As a result, there is the
states. This pollutant is the first country in the accumulation of solid
mainly used for gold (72%) world in terms of mercury residuals on beaches,
and silver mining (27%). emission per capita. mangroves and coral reefs.
32 33
GROW Colombia Project / Socio-Economics of Biodiversity Programme January 2020Colombia’s Natural Capital / Report 1 Drivers and Pressures of environmental change
e) An increase in some areas toxic dinoflagellates and 3.4.1. Agriculture expansion
of potentially harmful other potentially toxin
microalgae: in previous years producers’ microalgae. It Historically, agriculture has
there have been reports on occurs in specific areas been one of the main engines of
fish mortality increase from of bays, marshes and in Colombian economic development.
different microorganism like particular months, but The agricultural economic activity
cyanobacteria, potentially is increasing overall. contributes to 6% of the country’s
GDP and 5% of the value of
exports (World Bank, 2015).
Figure 8. Due to the government’s policy of
Agricultural subsidies and incentives, sugarcane
production
of the main crops for ethanol and African palm
products trees for biodiesel are increasing
Source:
SIG-OT rapidly, transforming tropical
(2008) forests or natural grasslands.
During the years 2006 to 2010,
the total agricultural production in
Colombia increased by more than
2.5 million tons (Figure 8). The recent
rate of transformation of tropical
savannas into agricultural land in
Colombia has been the highest in
the history of the country (100,000
ha/year) (MADS and PNUD, 2014).
Given this situation an in order to
control the agricultural expansion, for production, the total agricultural
the government has defined the production in 2016 was 23,363,324
“agricultural frontier” which identifies tons, of which 8,711,327 (37.3%) tons
the region where agriculture correspond to agro-industrial crops,
could be developed without 4,908,427 tons (21.0%) to tuber
compromising the biodiversity and plantain crops and 4,781,128
of the country (UPRA, 2018). tons (20.5%) to cereal crops.
According to the results of the Within the agro-industrial crops,
National Agricultural Census (DANE, the largest area is occupied by
2016), the total harvested area in coffee (42.9%) with 711,011 ha
Colombia is 4,618,644 ha, generating producing 830,723 tonnes and
a total agricultural production sugar cane (9.5%) with 156,960
of 23,363,324 million tons. Agro- ha producing 861,369 tonnes
industrial crops are using the largest and cocoa (6.6%) with 110,795
percentage of land (35.9% with ha producing 71,143 tonnes
1,658,598 ha producing), followed (DANE, 2016). Colombia has an
by cereals (22.0% with 1,014,095 average cocoa yield 0.5 (ton/ha.)
ha) and plantations forestry (17.9% of dry grains (DANE, 2014). The
with 827,582 ha). The type of crops departments with the highest
using the smallest percentage of participation in the production
land (0.1%) were the aromatic, of dry cocoa is Santander with
seasoning and medicinal plants. As 25.1%, followed by Nariño and
34 35
GROW Colombia Project / Socio-Economics of Biodiversity Programme January 2020Colombia’s Natural Capital / Report 1 Drivers and Pressures of environmental change
DOMAIN No. APU Planted Planted Planted Planted
No. APU - Planted area No. APU - No. APU - No. APU -
- Total area - Total area - area - area -
coffee - coffee cocoa rubber plantain
agroindustry agroindustry cocoa rubber plantain
Total National 860.147 3.006.466 385.871 902.424 88.567 199.549 8.413 42.108 319.155 915.987
Antioquia 71.622 294.126 44.523 132.448 5.049 15.517 1.049 6.801 33.840 134.022
Atlántico 344 1.000 0 0 0 0 0 0 292 397
Bogotá 0 0 0 0 0 0 0 0 0 0
Bolivar 9.893 51.203 818 1.219 1.959 4.067 42 258 7.249 18.481
Boyacá 28.734 81.527 6.871 9.511 2.014 3.199 15 14 4.298 4.718
Caldas 43.659 148.589 27.268 76.194 2.639 4.905 244 1.642 14.964 42.446
Caquetá 7.620 19.294 636 1.959 1.347 2.088 889 2.544 8.661 20.045
Cauca 133.437 235.888 71.983 98.321 3.946 4.918 66 88 37.754 45.972
Cesar 11.636 95.241 6.470 25.388 1.579 3.255 7 93 5.961 24.009
Cordobá 18.448 75.256 68 376 1.587 3.316 386 2.047 11.058 46.804
Cundinamarca 37.562 93.123 19.316 33.680 2.533 3.839 149 340 7.281 12.173
Chocó 17.452 37.099 184 500 3.841 5.847 131 184 26.188 31.966
Huila 87.436 233.774 54.070 136.853 5.433 13.591 5 1 13.454 23.511
La Guajira 5.266 11.869 2.121 5.538 699 981 0 0 3.321 6.314
Magdalena 8.573 64.045 4.183 16.917 559 1.199 3 15 5.677 19.079
Meta 11.313 264.936 1.157 2.536 1.901 6.260 537 12.133 9.604 90.078
Nariño 113.889 211.325 37.483 43.326 12.410 19.666 2.134 1.743 30.091 84.541
Norte de 18.720 75.703 9.916 26.020 3.196 13.128 42 209 4.075 9.506
Santander
Quindío 4.931 26.766 3.481 20.908 43 156 0 0 5.065 25.139
Risaralda 18.290 65.666 12.510 48.356 3.463 4.059 10 17 3.651 10.119
Figure 9.
Cacao Santander 81.396 273.324 26.677 46.177 15.605 46.767 1.456 6.809 6.866 18.691
production.
Source: Sucre 3.358 7.170 0 0 92 99 0 0 1.438 2.087
UPRA
(2016) Tolima 58.019 164.659 37.983 109.843 6.719 15.415 178 365 28.104 95.516
Valle del 32.342 311.481 14.983 62.254 2.789 5.610 113 213 13.389 41.258
Cauca
Table 1.
Number of Arauca 4.352 17.880 0 0 3.383 13.730 11 2 4.275 13.694
APU and area
for some Arauca with 8.4% and 7.9% By the year 2011, FEDECACAO Casanare 7.026 67.996 1.876 3.066 409 539 82 120 7.094 11.316
agroindustry respectively (Figure 9) (DANE, had 15,885 cocoa producers
crops and
plantain 2013 2014). Cocoa is considered registered in the country (SIC, Putumayo 13.023 25.868 1.294 1.035 3.916 4.113 150 375 9.924 17.348
Source:
Adapted from
to be a subsistence crop in 2011). Colombia had a total of * SAC&SC 95 39 0 0 0 0 0 0 204 98
DANE (2018) Colombia which demands high 3 million hectares dedicated to
Amazonas 3.042 7.821 0 0 537 1.083 20 9 3.164 29.299
labour inputs for its production. agro-industrial crops, with a total
According to FEDECACAO of 860,000 agricultural production Guainía 1.984 12.039 0 0 89 349 14 22 1.444 9.510
farmers obtain about 75% of units (APU) associated. Then, Guaviare 1.935 3.093 0 0 487 453 367 792 3.759 4.596
the household income from agro-industry is occupying nearly
Vaupés 2.135 1.780 0 0 92 22 5 2 2.597 3.308
its commercialisation, and 42% of total cropping area in the
approximately 35,000 families in country and 9% of total agricultural Vichada 2.615 26.891 0 0 251 1.378 308 5.270 4.413 19.949
Colombia live from this activity. and livestock production area. *San Andres, Providencia & Santa Catalina Archipielago
36 37
GROW Colombia Project / Socio-Economics of Biodiversity Programme January 2020Colombia’s Natural Capital / Report 1 Decision support systems for natural capital planning and management
1.000.000 450.000 In that ten-year period, the largest and cocoa produced 87,000
900.000 400.000 crop in the country was coffee, with and 23,000 tons each during
800.000 Area 350.000 nearly 766,000 hectares in 2007 2016. This graph also shows
Number of farms
700.000 APU and 777,000 hectares in 2016, with that rubber presented the
Hectares 300.000
600.000
250.000
a mean annual growth of 0.2% (see highest mean annual growth
500.000 Table A2 for details). In contrast, reaching 22.3% followed by
200.000
400.000 the rubber area showed the lowest cocoa with 4.8%. Plantain and
150.000
300.000 planted area for the four crops, coffee presented a lower mean
100.000
200.000 starting with nearly 3,000 hectares annual growth for production:
100.000 50.000 in 2007 and finishing with 18,432 2.7% and 0.3% respectively
0 0 hectares in 2016, with a mean (see Table A3 for details).
Coffee Other Oil Brown sugar Cocoa Rubber Cotton Tobacco
agroind. Palm sugar cane annual growth of 24.3%. Plantain
prod. cane area showed a mean annual Yield can be calculated as the
growth of 1.2% and the cocoa area relation between production and
had a mean annual growth of 5.4%. planted area. Yield for plantain,
Figure 10.
Area and cocoa and rubber showed a
agricultural Figure 12 shows that plantain had decrease between 2007 and
productive
units by main In Figure 10 we can see that the is grown for local consumption the most significant production 2016. Yield mean annual growth
agroindustry main crop for agroindustry is (nor for export) and occupied from all analysed crops, reaching for these crops was -0.9%, -0.6%
crops Figure 12.
Source: coffee, with nearly 0.9 million 915,000 hectares approximately, 3.7 million tons in 2016. Coffee and -1.6%. Coffee showed a Production for
Adapted
from DANE
hectares (30% of total agroindustry with nearly 319,000 APU. had a production of 0.8 million positive mean annual growth of coffee, plantain,
cocoa and
(2018) area) and 385,000 agricultural tons for 2016 while, rubber 2.5% (see Table A4 for details). rubber 2007-
production units (45% of total Figure 11 shows the evolution 2016 (tons)
Source: MADR
agroindustry APU). Cocoa and of the planted area for coffee, and AGRONET
rubber have a smaller share plantain, cocoa and rubber for (2017)
of agroindustry area: 10% a the period 2007 and 2016.4
(199,549 ha) and 1% (42,108
ha) for each crop. The mean 4,0
size of the farms that produce
coffee, cocoa and rubber are 3,5
4
Data used for historical evolution of
2.34, 2.25 and 5.01 hectares. crop’s area is based on AGRONET, which
reports information from the Ministry 3,0
of Agriculture. Slightly differences exist
Plantain is not included within
Production (million tons)
between AGRONET and DANE’s National
2,5
the agroindustry crops. Plantain Agricultural Census 2013-2014.
2,0
1,5
Figure 11.
Planted area 1.000
for coffee, 1,0
Area (thousand ha)
plantain, cocoa 800
and rubber
2007-2016 (ha) 600 0,5
Source:
MADR and 400
AGRONET 0,0
(2017) 200
2007 2008 2009 2010 2011 2012 2013 2014 2015 2016
_
2007 2008 2009 2010 2011 2012 2013 2014 2015 2016
Plantain Coffee Cocoa Rubber
Coffee Plantain Cocoa Rubber
38 39
GROW Colombia Project / Socio-Economics of Biodiversity Programme January 2020Colombia’s Natural Capital / Report 1 Decision support systems for natural capital planning and management
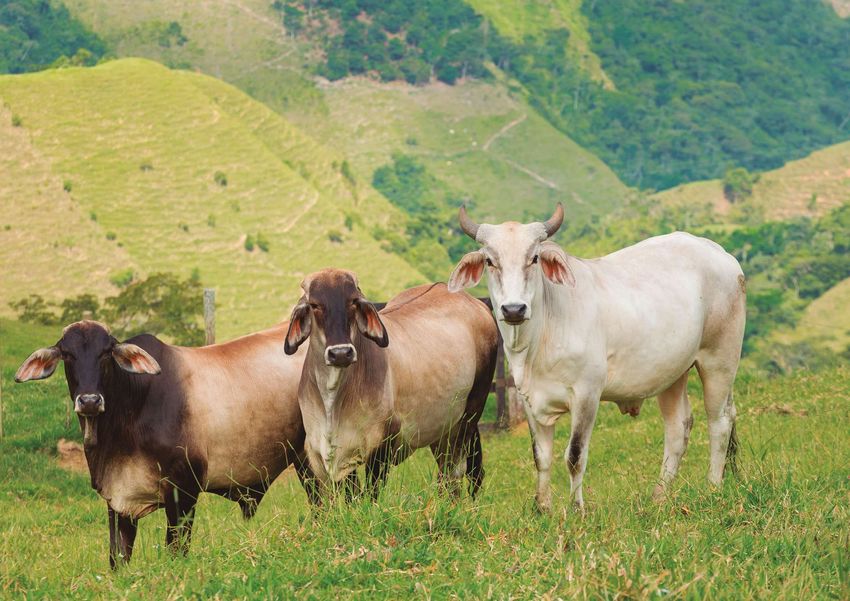
3.4.2. Cattle ranching and PNUD, 2014). According to the
intensification National Agricultural Survey, there
are more than 39 million hectares
Livestock occupies 38% of the total (35% of the territory) dedicated
area of the country (Figure 13), to the activity, although half of
generates 3.5% of GDP and accounts this area (53.8%) does not have
for 7% of national employment and the environmental characteristics
28% of rural employment (MADS which made it suitable for grazing.
Figure 13.
Environmental
Demand for
Colombian
Territory.
Source:
adaptation
from Colombia
Corine Land
Cover map
2010-2012
from IDEAM.
Figure 14.
Size of
livestock
herds in
Colombia
Source:
Pontificia
Universidad
Javeriana
(n.d.)
There is approximately 23.5 also contributes to the emission
million head of cattle in Colombia, of greenhouse gases and water
and the number of cattle among pollution (WWF-Colombia, 2017).
regions is heterogeneous.
However, the majority of the The rise of livestock farming
Colombian departments have activity has been at the expense
at least 100 animals (see Figure of the tropical forest. Degraded
14). Extensive livestock farming pastures have replaced tropical
is a determining factor in land forest. Livestock farming is the
degradation and deforestation most important driver of land
and is considered to be the main use change in wetlands since
engine of deforestation and loss of it affects 1.18 million hectares
biodiversity in the country (Lerner of permanent and temporary
et al., 2017). Livestock farming wetlands (WWF-Colombia, 2017).
40 41
GROW Colombia Project / Socio-Economics of Biodiversity Programme January 2020Colombia’s Natural Capital / Report 1 Decision support systems for natural capital planning and management
1.000
area or the Caribbean coast but 3.4.3. Deforestation and
Stocking rate (heads/ha)
0,800 also has a presence in areas of degradation of forest
agricultural frontier like Meta,
0,600 Caquetá, Putumayo and Vichada. It is reported that 68.7% of
Colombia’s surface is covered by
0,400 Fedegan reported a total of 22.6 natural ecosystems concentrated
million heads for 20165. In terms in the lowlands of the Amazon,
Cocoa plantation
0,200 Arauca
of the type of livestock production, Orinoco and the Pacific as well as along forest
Casanare
Caldas
Meta
Antioquia
Cesar
Risaralda
Amazonas
Bogotá
Vaupés
Vichada
Guainía
Guaviare
Caqueta
Córdoba
Nariño
Atlántico
Total National
Boyacá
Valle del Cauca
Cundinamarca
Sucre
Chocó
Tolima
Santander
*SAP&SC
Huila
Quindío
Norte de Santander
Cauca
Magdalena
Bolivar
Putumayo
La Guajira
cow-calf activities accounted for the Andean slopes. Approximately remnants and
a walking palm
nearly 8.7 million heads, while 50% of the Colombian forests have a (Socratea exorrhiza)
dual-purpose accounted for 7.9 collective form of management with (Photo taken by
Jaime Erazo during
million heads. Fattening activities 45.4% managed by indigenous, 7.3% the CacaoBio
accounted for 4.5 million heads, Expedition in Chocó
in March 2019)
while specialised diary accounted
Figure 15. only for 1.4 million heads. Figure
Cattle
ranching
16 and Figure 32 (see annex)
stocking rate If we consider that cattle ranching Norte de Santander, Cauca, show that cow-calf activities are
(heads/ha)
Source: activity can also be developed in Magdalena, Bolivar, Putumayo mainly developed in the foothills
DANE (2018) resting areas, total cattle ranching and La Guajira had a stocking of the Eastern mountain range, in
area was 34.4 million hectares rate below 0,52 heads/ha. That is, Meta, Casanare and Arauca but
in 2013, including grasses (see in those departments one head are also taking place in Vichada
Table 6 in the annex). The National of cattle occupy more than 2 and Guaviare, departments that
Population Census (DANE, 2018) hectares for livestock production belong to the Amazon biome. Dual-
reported that 648,000 agricultural (see details of cattle ranching purpose activities are developed
production units (APU) had nearly by department in Table A1). in the North and Centre of the
21.4 million heads of cattle. That country, in Cesar, Bolivar and
amount of cattle generated a Figure 16 shows that the largest Santander but it also has an
national stocking rate of 0.72 cattle herds can be found in essential share in departments
heads/ha (see Figure 15). Antioquia, Córdoba, Casanare that are in the agricultural
and Meta. That is, cattle ranching frontier like Caquetá, Meta and
Stocking rates in Arauca, Casanare, activities are developed in areas Guaviare, associated with the
Caldas and Meta, were over where there are low forest Amazon tropical rain forest and
0.8 heads/ha, while Quindío, remnants like in the Andean also Valle del Cauca and Chocó
in the Pacific Coast forests. The
specialized diary is developed at
Figure 16. 3,0 high altitude, so, departments
Herd size by
type of livestock
that presented this activity
2,5 Cow-calf Dual-pourpose Fattering Specialized diary
are Antioquia, Cundinamarca,
Herd size (million heads)
production and
departamento in
Colombia (2016)
2,0 Boyacá, Nariño and Cauca.
Source:
FEDEGAN 1,5
(2019)
1,0
0,5
0,0
Córdoba
Casanare
Caldas
Santander
Cesár
Caquetá
Cundinamarca
Magdalena
Arauca
Bolivar
Sucre
Boyacá
Tolima
Valle del Cauca
Huila
Norte de Santander
Nariño
Caldas
La Guajira
Guaviare
Cauca
Vichada
Atlántico
Putumayo
Chocó
Risaralda
Quindio
GUainía
Amazonas
Vaupés
* SAP&SC
Antioquia
5
DANE’s national agricultural census does
not provide information for cattle ranching
activities, then we used the National Cattle
Ranching Association (FEDEGAN) data.
42 43
GROW Colombia Project / Socio-Economics of Biodiversity Programme January 2020Colombia’s Natural Capital / Report 1 Decision support systems for natural capital planning and management
by Afro-descendant communities pastures replace forest ecosystems
and 1.9% by traditional farmers (Lerner et al., 2017). The Andes
(MADS and PNUD, 2014). and the Amazon regions presented
the highest rate of deforestation
Deforestation has been responsible (Figure 17) between the years
for most of the alterations to 2005 and 2010, which represented
Colombia’s natural capital. In the a loss of 41% of the natural
last 50 years, there has been an forests (WWF-Colombia, 2017).
increase in the number of hectares
used for livestock (from 14.6 million Legal and illicit activities drive
to 39 million hectares) where deforestation. The legal forestry
Figure 17.
Deforestation map
Source: IDEAM,
MADS, Patrimonio
Natural, Ecopetrol
and Gef - Banco
Mundial (2010)
Figure 18.
Variation
of coca
cultivation
Source:
UNODC
(2017)
industry represents 0.21% of the of the forest (Rincón-Ruiz and
GDP. The illegal deforestation is Kallis, 2013) and has an impact
a significant issue in the country on deforestation of tropical
since 40 to 50% of the total timber rainforests. Tumaco (Chocó),
extraction has been classified Puerto Asis (Putumayo), Tibu
as illegal (WWF-Colombia, (North of Santander), Valle
2017). It has been suggested de Guamuez (Putumayo) and
that 58% of deforestation that El Tambo (Cauca) are the
took place in the year 2014 municipalities with the highest
happened in the municipalities concentration of coca crops (Figure
with the highest levels of conflict 18), with respect to their area.
(Pineda Giraldo, 2017). Finally, the design of the road
system is generating deforestation
The development of illicit crops associated with the change in land
is also linked to the degradation use (Armenteras et al., 2013)
44 45
GROW Colombia Project / Socio-Economics of Biodiversity Programme January 2020Colombia’s Natural Capital / Report 1 Decision support systems for natural capital planning and management
3.4.4. Overfishing has experienced a rapid expansion Agricultural Census developed in respectively. When considering the
of the mining sector in recent years. 2014, the territory of ethnic groups total area occupied by these ethnic
At the national level, continental The titles for the extraction of coal in the country corresponds to 39.9 groups, 6.9% of it has agricultural
wild fishing is in decline. In 1972, increased by 87% between the million hectares. The proportion use (2.8 million ha), 0.1%
the catch of fish in Colombia was years 2004 and 2007. Similarly, the of natural forest in the indigenous corresponds to non-agricultural
83,000 tons, and by the end of 2010, titles for gold are five-times higher territory is 93.0%, whereas in use (0.03 million ha) and 2.2% to
the country only produced 25% of (Salamanca et al., 2013). According the black/Afro-descendant and other uses (0.9 million ha). Even
that amount. The fall of the fishery to Salamanca et al., (2013), by the ancestral raizal territory6 the though the non-agricultural land
is attributed to the deterioration of year 2012, 9,400 mining titles were proportion is 79.4% and 66.0%, use of the indigenous territory only
its ecosystems in combination with covering 5.6 million hectares of the occupies 2.3% of the indigenous
overexploitation (WWF-Colombia, country. Currently, there are more territory, this represents 0.93 Figure 19.
2017). Freshwater species are than 19,000 mining applications to million hectares which are at risk Mining and oil
6
Ethnic group who are descendants of extraction
threatened by persecution and be resolved. In total the declared Amerindians, Africans and Europeans of losing the vast natural capital Source:
Agencia
accidental capture. The main strategic mined areas found who populated the Archipiélago de San that these ethnic communities have Nacional
Andrés, Providencia y Santa Catalina y
threat to species living in marine in the Amazon and the Pacific, the Caribbean, and who built a society
preserved for many generations. de Minería
and Agencia
environments is their overharvesting account for 40 million hectares of with its own language and culture. Nacional de
combined with bycatch in trawling the continental territory (Figure Hidrocarburos
(2015).
operations (WWF-Colombia, 2017). 19) (MADS and PNUD, 2014).
In marine-coastal ecosystems, it According to Martínez, A. UPME
is estimated that a considerable (2015) the mining and hydrocarbon
part of all Colombian coasts are sector represented 8% of GDP
facing erosion; in the Caribbean at for the year 2011. These sectors
least 50% (1182 km) of the coast is present the highest growth
facing severe coastal erosion (more rate in the Colombian economy
than 1.5 m/yr) (Rangel-Buitrago and they represent 70% of the
et al., 2017). The Magdalena, total value of the country’s
Orinoco and Amazon river basin exports. Nonetheless, it has been
have suffered an alarming decline estimated that from the total gold
(above 80%) of their commercial production only 11% complies
fisheries (WWF-Colombia, 2017). with all associated legal processes,
which emphasise on the need to
3.4.5. Mining and improve the effectiveness on which
oil extraction the government regulates this
activity (MADS and PNUD, 2014).
Colombia has one of the largest
open-pit coal mines in the world Overlap of land used for
in the region of Cerrejon in the mining and oil extraction
Guajira Peninsula (belongs in with land for farming and
equal parts to BHP Billiton, Anglo conservation generates land-use
American and Glencore). Colombia conflicts and affects their provision
also has oil rigs and natural gas of ecosystem services (MADS
extraction in the eastern plains. and PNUD, 2014). Similarly, the
Colombia is the leading producer mining concessions affect the
of emeralds and has an important natural and cultural capital and
share in the production of gold, commonly overlap with protected
silver, iron, salt, platinum, petroleum, areas and the territory where
nickel, copper, hydropower, as well indigenous communities reside.
as uranium extraction. Colombia According to the third National
46 47
GROW Colombia Project / Socio-Economics of Biodiversity Programme January 2020You can also read