COLUMBIA, CANADA BACKGROUND CONCENTRATIONS OF PM2.5 AND OZONE IN BRITISH - IAN G. MCKENDRY
←
→
Page content transcription
If your browser does not render page correctly, please read the page content below
Background Concentrations of PM2.5 and Ozone in British
                Columbia, Canada
                            Ian G. McKendry
     Geography/Atmospheric Science, The University of British Columbia

                                Prepared for
               the British Columbia Ministry of Environment
                                March 2006
EXECUTIVE SUMMARY
Background concentrations may be defined as those pollutants arising from local natural
processes together with those transported into an airshed from afar (the latter may be both
natural or anthropogenic in origin). In the absence of “pristine” monitoring sites for fine
particulate matter (PM2.5) and ozone (O3) in British Columbia (B.C.), survey of the
current literature, together with cursory analysis of available monitoring data, provides an
estimation of the likely magnitude, and spatial and temporal variability of background
concentrations across the region. In addition, it is possible to identify the likely major
sources of short-term variations in background concentrations. These results are
summarised below.
Table: Summary of Background PM2.5 and O3 concentrations in B.C.
Estimated Mean Seasonal Short-term Average Trend
Background Background Peak Contribution
Range Background to ambient
-3
PM2.5 2 μgm 1-4 μgm-3 250 μgm-3 25% little
with Summer Local Forest evidence
Peak Fire (Jaffe et
al., 2005)
1
Ozone 20-35ppb 20-35ppb with 40-50 ppb variable (up to 0.5-
Spring Peak + Trans-Pacific 100%) 2%/ann
fire plume
(15ppb)
1
Vingarzan, 2004a, based on nearby clean sites on the Olympic Peninsula and Mount
Rainier; GVRD 2005
For PM2.5:
• Mean annual background concentrations of approximately 2 μgm-3 are low
compared to the Canada-wide Standard (CWS). They vary seasonally with a
summer peak and winter minimum. It is likely that precipitation variability is a
major control on background concentrations across the Province. Lower values
are likely in wet coastal areas while slightly higher values might be expected in
drier regions.
• Local forest fires represent the major and most frequent source contributing to
short-term peak background concentrations. (Forest fires in Kelowna during
2003 had peak hourly PM2.5 concentrations of 250 μgm-3). Episodic trans-Pacific
dust transport is rare but has the potential to elevate concentrations by
approximately 20 μgm-3).
• Mean background concentrations in air masses arriving in B.C. with north Pacific
trajectories are of the order of 1.5 - 2 μgm-3. This represents a significant
proportion of the overall background concentration in B.C..
• There is little evidence of an upward trend in background concentrations. It is
likely that background concentrations associated with regional or continental
scale transport are decreasing due to abatement strategies in urbanised areas.
iFor O3:
• The mean background is estimated to be in the range 20-35 ppb and varies
seasonally with a spring maximum. This level represents approximately 50% of
the CWS and given short-term variability in background sources, it is likely that
the CWS will occasionally be exceeded by either background sources alone, or
the additive effect of local anthropogenically generated ozone and background
levels.
• There is little evidence that stratospheric intrusions of O3-rich air contribute to
exceedances of the CWS at ground level in B.C. (Bovis, 2001). However this
source may contribute 20-40 ppb to short-term peak concentrations (but
generally in meteorological conditions not conducive to elevated concentrations
associated with local anthropogenic activities).
• Episodic trans-Pacific ozone transport (arising from either biomass burning or
the anthropogenic combustion sources in Eurasia) may episodically increase
short-term ground level concentrations by 5-15 ppb. In one case this has been
shown to lead to exceedance of an 82 ppb 8- hour standard.
• Mean background concentrations show an upward trend of 0.5 -2.0%/year.
Based on these results it is recommended that priorities for monitoring in B.C. should
include:
• establishment of a long-term pristine west coast baseline site (O3 and PM2.5, and
other atmospheric constituents if possible).
• collaboration with Environment Canada to continue and enhance high altitude
measurements at Whistler Peak, particularly O3 (but other atmospheric
constituents as well)
• Establishment of at least two other “clean” interior sites for O3 and PM2.5 (perhaps
interior plateau, and in the northeast).
Further information on background concentrations across B.C. may also be gleaned from
analysis of existing data and modelling studies.
iiTABLE OF CONTENTS
EXECUTIVE SUMMARY i
1. INTRODUCTION 1
2. OBJECTIVES 2
3. DEFINITIONS 2
4. BACKGROUND PM2.5 3
4.1 Sources 3
4.2 Mean Background Levels – Relevant Literature 4
4.3 Episodic Elevated PM2.5 Background 8
5. BACKGROUND OZONE 10
5.1 Sources 10
5.2 Ozone Background and Trends – Relevant Literature 10
5.3 Observed Episodes of Elevated O3 Background 11
6. RECOMMENDATIONS FOR MONITORING IN B.C. 14
7. SUMMARY AND CONCLUSIONS 15
8. REFERENCE CITED AND BIBLIOGRAPHY 17
APPENDIX 20
iii1. INTRODUCTION
Background concentrations may be defined as those pollutants arising from local natural
processes together with those transported into an airshed from afar (the latter may be both
natural or anthropogenic in origin). Ozone (O3) is an excellent example of a pollutant that
occurs both naturally in the troposphere (e.g. through photochemistry associated with
biogenic emissions of hydrocarbons and oxides of nitrogen, forest fires, intrusions of
ozone-rich stratospheric air into the troposphere, and lightning activity) and as a result of
anthropogenic emissions of precursor species (hydrocarbons and oxides of nitrogen
generated primarily by combustion). Similarly, fine particulate matter (PM2.5) has
numerous natural sources (e.g. desert dusts, sea salt, pollens) that complement the
anthropogenic burden much of which is generated by combustion processes. Given the
mixed natural and anthropogenic origin of these two priority pollutants deemed to have a
deleterious impact on human health, it is critical to define the nature, variability and
magnitude of “background” in the B.C. context.
In June 2000 the Canadian Council of Ministers of the Environment (CCME) adopted
ambient standards for PM2.5 and O3 that commit the federal and provincial governments
to reach specific ambient air quality targets by the year 2010. These Canada-wide
Standards (CWS) include numeric targets for PM2.5 and O3 and outline their associated
statistical forms:
PM2.5: 30 μgm-3, 24-hour (midnight to midnight) averaging time - 98th percentile
ambient measurement annually, averaged over three consecutive years.
O3: 65 ppb, 8-hour averaging time - 4th highest measurement annually, averaged over
three consecutive years.
In moving toward CWS for particulate matter, it is recognised that these levels are not
necessarily protective of human health given scientifically-based evidence that there is
no lower threshold limit for PM2.5 effects on human mortality and morbidity. In fact, the
Federal-Provincial Working Group on Air Quality Objectives and Guidelines
(WGAQOG) has determined that the target which would substantially reduce the risks to
human health for PM2.5 is 7.5 μgm-3 (24 hour averaging time), a value significantly lower
than the CWS. Given this relatively low value, and its proximity to background levels in
the US and Canada, WGAQOG has suggested that background levels are appropriate
targets for reducing risks to human health (CEPA, 1999).
In light of the movement to CWS, it is essential to explore the extent to which ambient
pollutant concentrations across British Columbia are influenced by “background
concentrations” that (a) are not amenable to “control” through local air quality
management strategies, and (b) which potentially may lead to violations of the CWS.
In examining the PM2.5 and O3 “background” across B.C. two overarching “facts”
underlie the conclusions reached herein:
(a) B.C. is relatively remote from other significant North American continental sources of
pollutants and is generally exposed to Pacific air masses (with the exception of the
northeast portion of the Province).
1(b) B.C. is a large area with a wide range of physical environments and climatic regimes
(e.g. the dry southern interior, wet forested coastal regions, and dry cold plains of the
northeast). Each region has characteristic local sources of pollutants and differing
exposures to marine and continental air masses. “Background” is therefore clearly
airshed-specific.
2. OBJECTIVES
As monitoring in B.C. is generally conducted at sites where local anthropogenic sources
are significant (e.g. the Lower Fraser Valley), determination of the exact magnitude of
background concentrations based on routine ambient monitoring is problematic. Given
this obstacle, it is the goal of the report to exploit all available data sources and research
to:
• provide best estimates of average PM2.5 and O3 “background” concentrations for
B.C.,
• examine spatial and temporal variability in background concentrations,
• identify the dominant sources affecting background concentrations including
those exhibiting significant short-term variability (e.g. forest fires) and
• make recommendations with respect to future monitoring priorities in order to
better define the magnitude and variability of backgrounds concentrations across
the Province.
Several approaches may be used to provide reasonable estimates of background levels in
the absence of monitoring from “clean” or “pristine” sites. These include:
(a) Survey of the extant literature on background levels in the region or in similar
settings: Published studies include special observational studies as well as
regional/global chemical modelling studies. Of relevance to this report are
observations at the coastal Cheeka Peak site (Washington State – western
Olympic Peninsula) and Crater lake (Oregon), and model “experiments” in which
sources (both natural and anthropogenic) may be varied in order to determine
background concentrations.
(b) Examination of routine monitoring data: Observations from relatively clean sites
provide indications of background concentrations. Furthermore, episodic cases of
elevated background concentrations may be identified (e.g. concentrations
experienced during known forest fires).
In this report, information from each of these sources is used to estimate background
concentrations across the region.
3. DEFINITIONS
The terms “background”, “natural background” and “baseline” concentrations are used
widely, and sometimes with subtle nuances in meaning, in the literature. In Atmospheric
Chemistry background concentration (level) is formally defined as:
“The concentration of a given species in a pristine air mass in which
anthropogenic impurities of a relatively short lifetime are not present. The
background concentrations of relatively long-lived molecules, methane,
2carbon dioxide, halocarbons (CF3Cl, CF2Cl2, etc.) and some other species
continue to rise due to anthropogenic input, so the composition of
background air is undergoing continual change. Background concentration
of a given species is sometimes considered to be the concentration of that
impurity in a given air mass when the contribution from anthropogenic
sources under study is absent. Synonymous with baseline concentration.”
1990, 62, 2175
IUPAC Compendium of Chemical Terminology 2nd Edition (1997)
In general usage, and for the purposes of this report, “background” concentrations are
defined as those ambient pollutant concentrations in an airshed that would occur in the
absence of local anthropogenic emissions. Thus “background” is the sum of local natural
emissions and those pollutants (generally long-lived species) advected into an area that
are of both natural and anthropogenic origin. This definition is somewhat broader than
some definitions that exclude all anthropogenic sources (including those arising from
landuse change and practices, e.g. forest fires).
In defining the nature of “background”, an important related concept is that of “chemical
weather”, a term that is gaining increasing acceptance and assuming greater importance
in the Atmospheric Chemistry community. Chemical Weather is defined as:
“local, regional and global distributions of important trace gases and
aerosols and their variabilities on time scales of minutes to hours to days,
particularly in light of their various impacts, such as on human health,
ecosystems, the meteorological weather and climate”.
- Lawrence et al. 2005
This definition arises from recognition that focus has previously been on the chemical
climate -- the long term mean concentrations of important trace gases and aerosols.
However, “Chemical Weather” recognises the tremendous short-term variability of the
atmospheric composition, resulting from the strong influence of meteorological
variability, chemical complexity, and regional and temporally varying emissions. In the
context of this report “chemical weather” implies that “background” concentrations are
not constant but instead are highly variable both spatially and temporally. Consequently,
events such as dust storms in Asia/Sahara, or forest fires in Siberia/Okanagan Valley, or
stratospheric ozone down-folding events over the North Pacific all contribute to the short
variability (chemical “weather”) of background concentrations.
4 BACKGROUND PM2.5
4.1 Sources
Particulate Matter (PM) originates from a wide variety of sources and includes particles
having diverse physico-chemical characteristics. Natural sources include forest fires,
windblown soil and dust, volcanic dust, sea spray, pollen, spores and bacteria. Associated
particles are typically found in the coarse fraction (PM2.5-10), although forest fires produce
predominantly fine particles (PM2.5). Anthropogenic sources of PM include fossil fuel
combustion, industrial processes, prescribed burning, wood stoves, and fugitive dust from
roads, construction sites and agriculture. PM derived from fossil fuel or biomass
3combustion is predominantly composed of fine particles, whereas fugitive dust is
characterized by coarse particles. In addition to the primary particles emitted directly into
the atmosphere, secondary particles are formed from physical or chemical
transformations that occur in the atmosphere, and are most often found in the fine
fraction (PM2.5). Precursor gases involved in secondary formation include sulphur
dioxide (SO2), oxides of nitrogen (NOx), ammonia (NH3) and various hydrocarbons
referred to as volatile organic compounds (VOCs).
4.2 Mean Background Levels - Relevant Literature
A recent report on monitoring of PM in B.C. (Suzuki and Taylor, 2003) notes the dearth
of information on natural background levels of PM in Canada due to the tendency for
monitoring to be concentrated in urban centres, or in the case of B.C., in resource-based
communities where local anthropogenic sources dominate. Consequently, few pristine
monitoring stations exist. However, an indication of the likely magnitude of background
concentrations is provided by a study of six remote rural locations in Alberta showing
PM2.5 concentrations between 1.7 to 3.8 μgm-3 with an average of 3.2 μgm-3 (Cheng et
al., 2000). In the western United States, natural background levels of 1 to 4 μgm-3 for
PM2.5 have been reported (US EPA, 1996; Trijonis et al. 1990). In B.C., emissions
inventories suggest that away from the Lower Fraser Valley (the major urbanised region)
natural sources of PM comprise ~25% of emissions of both PM2.5 and PM10 (Suzuki and
Taylor, 2003). Based on mean PM2.5 concentrations of approximately 5- 6 μgm-3 observed
across B.C. this would indicate a “first guess” estimate of mean background PM2.5 of
approximately 1- 1.5μgm-3, a value at the low end of estimates cited above for Alberta and
the western United States (see Table 5, Suzuki and Taylor (2003) – note: values in this table
have been subsequently adjusted downward by 3 μgm-3 , Suzuki, pers. comm).
Vingarzan (2004b) provides a comprehensive analysis of ambient PM concentrations
and background levels in Canada based on measurements from the Canadian National Air
Pollutant Surveillance (NAPS) Network from 1996-2001. Mean annual values are
presented in Figure 1 and are compared with estimated mean background levels for
Canada (2.5 μgm-3) and western North America (1-4 μgm-3). Vingarzan (2004b) notes
that for annual average PM2.5 concentration for the fourteen stations in B.C., two of the
stations, Powell River, Wildlife, and Victoria, Sooke Rd., fall within the range of
background levels cited above for Canada and the western United States. It is noteworthy
that these stations are in coastal non-urban settings where precipitation is relatively high.
At the urbanised and/or resource-based communities of Nanaimo, Victoria, Quesnel,
Kamloops, Chilliwack and Kelowna, concentrations are still within 2 μgm-3 of estimated
background levels. Prince George has the highest PM2.5 annual concentration at 9.2 μgm-3
(this relatively high value may be attributed to a combination of local industrial/resource-
based sources and the topo-meteorological factors affecting dispersion in the region).
4Figure 1: PM2.5 Annual Means for B.C. NAPS Stations - from Vingarzan (2004b)
Recently, the discovery that western North America is influenced by the trans–Pacific
transport of Eurasian aerosols (including desert dust) and Saharan dust (Husar et al. 2001;
Jaffe et al. 2005, McKendry et. al. Submitted) has prompted studies designed to measure
the magnitude and frequency of this background input. Jaffe et al. (2005) utilise a
trajectory approach to segregate data from the pristine Crater Lake (Oregon) IMPROVE
(Interagency Monitoring of Protected Visual Environments) site in order to define marine
background concentrations of PM2.5 along the west coast of North America. This
background component is assumed to reflect some combination of contributions from
Eurasian anthropogenic sources, natural marine emissions (including sea salt and non-sea
salt sulfate, from marine biogenic emissions of dimethyl sulfide), Eurasian vegetation
and/or Eurasian biomass burning. Background marine aerosol (referred to as CMA –
“Combined Marine/Asian”) is shown to have annual mean and median concentrations of
2.0 and 1.5 μgm-3, respectively, for PM2.5 . These values are very close to those obtained
for Cheeka Peak, on the west side of the Olympic Peninsula, Washington. This broad
spatial consistency provides support for the view that these values are applicable also to
B.C.. When trajectories are “local”, reflecting North American sources, annual mean and
median concentrations are somewhat higher at 3.7 and 3.2 μgm-3, respectively. It is
important to note that there is a seasonal pattern in all components of the aerosol mass
(shown in Figure 2), with a summer maximum and winter minimum. This pattern is most
likely due to the strong seasonal pattern in precipitation, which peaks in winter, combined
with enhanced sources in summer.
5Figure 2: From Jaffe et. al (2005) - Mean concentration by month for local, mixed and
CMA sample types as defined in text for fine particle mass (μgm-3)
On an annual basis, Keating et al. (2005) suggest that annual average background PM2.5
concentrations of 2 µgm-3 along the west coast of the United States are comprised of
approximately 40% organic aerosol, 20% sulfate, and 15–20% mineral dust; the
remainder comprises black carbon, nitrates, sea salt, mercury, and other metals. These
estimates are supported by modelling studies (USEPA) of trans-Pacific transport using
the Community Multiscale Air Quality (CMAQ) regional model. CMAQ suggests that
Asia contributes 0.6–1.6 µgm-3 to the monthly average PM2.5 in the West and 0.2–1.2
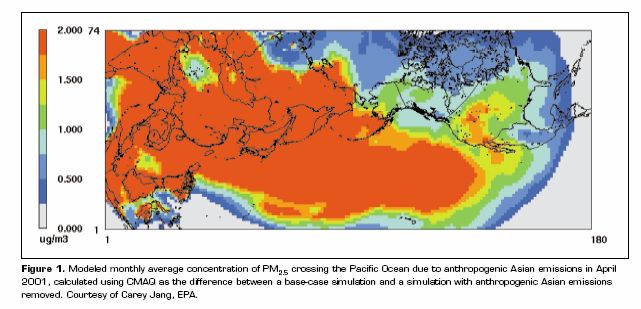
µgm-3 PM2.5 in the East (see Figure 3). The spatial distribution shown in Figure 3 for
April also suggests that the Asian contribution to background levels over B.C. may be
lower than further south.
Jaffe et al. (2005) report no trend in CMA since 1988 (despite increased emissions in
Asia) but note a decreasing trend in PM2.5 for air trajectories of local/continental origin.
This likely reflects documented decreasing emissions of PM10 in western regions over the
period.
Figure 3: from Keating et al. (2005)
610
8
6
-3
μgm
4
2
0
1 2 3 4 5 6 7 8 9 10 11 12
Month
Powell River Cranberry
Kelowna College
VanAir
CMA
Figure 4: Monthly PM2.5 concentrations at selected sites in B.C. and for
Combined Marine /Asian air masses (Jaffe et al; 2005)
Based on the assumptions that (a) B.C. is exposed regularly (especially in the non-
summer months) to Pacific marine air masses and (b) observations at both Crater Lake
and Cheeka Peak are applicable also to B.C., it is revealing to compare the results of Jaffe
et al. (2005) with B.C. observations. In Figure 4 the CMA (Combined Marine/Asian
Aerosol background) from Jaffe et al (2005) is superimposed on a graph showing
monthly mean PM2.5 values at selected stations in B.C.. Powell River Cranberry represents
a relatively clean coastal site (despite a local point source of anthropogenic PM) with low
average PM concentrations while Vancouver Airport and Kelowna represent urbanised
coastal and interior sites respectively. Several key points can be made:
• The “clean” Powell River Cranberry location (annual mean 3.6 µgm-3) shows the
same broad seasonal pattern as CMA at Crater Lake (annual mean 2.1 µgm-3).
This winter minimum/summer maximum pattern together with low concentrations
is indicative of a dominance of natural sources. Based on a comparison with CMA
this suggests that the “background” at this site is composed primarily of local
natural sources and combined marine/Asian sources in roughly equal proportions.
• The urbanised sites of Kelowna (annual mean 6.2 µgm-3) and Vancouver Airport
(annual mean 5.8 µgm-3) show the reverse pattern in which winter concentrations
are generally higher due to increased atmospheric stability (elevating near surface
concentrations associated with local emissions) and higher anthropogenic
emissions. The elevated concentrations apparent in Kelowna during August are
strongly influenced by the significant effect of forest fires in 2003 on seven-year
averages. At these sites the comparison with CMA implies that in spring and
summer, up to 50% of the monthly average could be attributed to marine and
Asian background sources.
7In summary, observational and modelling studies suggest that British Columbia is
exposed to average annual background concentrations of PM2.5 associated with marine
and Eurasian sources of the order of 1.5 - 2µgm-3. There appears to be no significant
trend in this background. Local natural background sources are likely of a similar
magnitude. These background levels show a seasonal variation characterised by a
summer maximum and a winter minimum. It is likely that there is some spatial variation
in these mean background values which is related to the variety and strength of local
sources as well as the exposure to marine air masses.
4.3 Episodic Elevated PM2.5 Background
From the previous section, it is apparent that exceedances of the CWS are unlikely to
arise from mean background values (which for PM2.5 are low). However, episodic events
that comprise “chemical weather” have the potential to elevate local concentrations
beyond the CWS. The major candidate background sources in B.C. are:
• Wind blown local crustal material. The most well known are the winter outflow
events in the eastern Lower Fraser Valley when strong winds (8-10 ms-1) mobilise
riverbed materials (McKendry, 2000).
• Local forest fires (predominantly summer) that affect mainly interior regions of
B.C. and neighbouring areas (including the USA).
• Trans-Pacific transport of dust (McKendry et al. 2001) arising from severe spring
dust storms in Eurasia: Eue to the long distance from source, the mean particle
diameter for this material is approximately 2.5μm and thus it can contribute
significantly to PM2.5 (Husar et al. 2001).
In Table 1, an estimate of the maximum short-term background concentrations for these
sources is provided on the basis of recent events. Of these, it is clear that forest fires in
the local region have the greatest potential to significantly elevate PM2.5 concentrations.
Forest fires affecting the Kelowna area (Okanagan Valley) in 2003 provide an example of
the potential impact of such events on PM2.5 concentrations (Figure 5).
Kelowna Forest Fires 2003
500
PM10
400 PM2.5
24 HR Average PM2.5
-3
300
μgm
200
100
0
8/17/2003 8/19/2003 8/21/2003 8/23/2003 8/25/2003 8/27/2003 8/29/2003 8/31/2003
0:00 0:00 0:00 0:00 0:00 0:00 0:00 0:00
Figure 5: Time series of particulate matter concentrations at Kelowna during August
2003 (data from B.C. Ministry of Environment data archive)
Near the source (i.e. Kelowna), hourly PM2.5 concentrations exceeded 250 µgm-3 while
24 hour averages exceeded the CWS level for several consecutive days. Although Asian
dust storms have the potential to add to the local PM2.5 burden by approximately 20 µgm-
3
(Hacker et al. 2001, U.S. EPA, 2002), such events appear to be rare due to the unlikely
8combination of factors required (i.e. a major dust storm in Asia, favorable transport
conditions across the Pacific and down-mixing mechanisms over B.C.).
Conversely, local dust storms, such as those seen in the eastern Lower Fraser Valley
during winter, when riverine and soil crustal materials are mobilised, are dominated by
coarse materials (PM2.5-10) and contribute little to the PM2.5 burden. Recent observations
of Saharan dust transport to B.C. indicate that such events are likely rare and have only
minimal impact on surface PM2.5 concentrations (McKendry et al. Submitted).
Table 1: Impact of episodic events on PM2.5 background
Maximum Duration Background Spatial Frequency
ambient PM2.5 of Event contribution Extent
Concentration to ambient
Kelowna 284 µgm-3 7 days 100% Regional interannual
August 2003
Forest Fires
April 1998 44 µgm-3 days 50%2 Continental rare
Asian Dust (decadal?)
1
Event
Chilliwack 2-5 µgm-3 days 0-50% Local annual
-3
local dust (PM10 50 µgm )
event (7 Jan
2005)
1
McKendry et al, 2001; Husar et al. 2001
2
U.S. EPA (2002) suggest an increase of 8.7± 2.3 µgm-3 during dust events, with mean
maximum dust contributions of 19.7± 8.4 µgm-3
95. BACKGROUND OZONE
5.1 Sources
Ground-level ozone is a secondary pollutant arising from complex chemical reactions
amongst precursor gases, principally NOx and VOC’s in the presence of sunlight. NOX
and VOC’s are emitted from a range of both anthropogenic and natural sources. NOx for
example is emitted during combustion processes (e.g. motor vehicles, industry, biomass
burning) or soil respiration. Similarly VOC’s may be emitted from various tree species
(so-called biogenic emissions) or be emitted during combustion and industrial processes.
Ozone in the troposphere may also form as a consequence of lightning or originate from
the natural intrusion of ozone from the stratosphere (where it exists in relatively high
concentrations, the so-called “ozone layer”).
5.2 Ozone Background and trends - Relevant Literature
A comprehensive survey of literature pertaining to background ozone concentrations and
trends relevant to Canada has been conducted by Vingarzan (2005). This detailed study
provides the foundation of this section. The key scientific findings arising from this work
are summarised online (http://www.ecoinfo.ec.gc.ca/reports/reports_AS_1_e.cfm) and
are reproduced verbatim below:
• The annual cycle of ozone at background sites in the Northern Hemisphere is
characterized by a spring maximum peaking during the month of May. Sites which
are affected to some extent by local ozone production exhibit a broad summer
maximum. There is no overarching consensus as to the origin of the spring maximum,
as evidence supports both enhanced photochemistry in the free troposphere and
stratospheric-tropospheric exchange.
• Modern day annual average background ozone concentrations over the mid-latitudes
of the Northern Hemisphere range between approximately 20-45 ppb, with variability
being a function of geographic location, elevation and extent of anthropogenic
influence.
• Annual average ozone concentrations at Canadian background stations fall between
23-34 ppb, a range similar to low elevation background sites in the US and around
the world.
• Background ozone levels over the mid-latitudes of the Northern Hemisphere have
approximately doubled from those measured over a century ago with the greatest
increase having occurred since the 1950s.
• Background ozone levels have continued to rise over the past three decades, and this
rise has been in the range of approximately 0.5-2% per year. Rising trends have not
been uniform, however, as the relatively steep trends of the 1970s and 1980s have
given way to more modest trends throughout the 1990s. The slower rate of increase,
or in some cases lack of an increase, over the past decade is believed to reflect recent
declines in ozone precursor emissions in North America and Europe.
• Modelling studies indicate that increases in NOx emissions since the 1970s account
for a 10-20% increase in background ozone over certain areas of the globe. Rising
10methane levels from industry and agriculture are believed to have increased global
ozone levels by 3-4%. Countering this, are estimates of declines in the ozone flux
from the stratosphere to the troposphere, resulting from stratospheric ozone
depletion.
• Recent global chemical transport model studies indicate that Asian pollution
contributes about 3-10 ppb to background ozone levels in the western United States
during the spring. A continued rise in anthropogenic emissions from Asia is expected
to increase the background level even further.
• Using five of the less conservative IPCC emission scenarios, the average global
surface ozone concentration is expected to be in the range of 35-48 ppb by 2040, 38-
71 ppb by 2060, 41-87 by 2080 and 42-84 ppb by 2100. Such increases would exceed
internationally accepted environmental criteria and have negative implications on
human health, crops and vegetation.
Clearly, the relationship between background and CWS is somewhat different for ozone
as compared to PM2.5. For PM2.5, mean background levels represent a small fraction of
CWS and there are no apparent trends. For ozone, background levels are a significant
proportion of the CWS (~50%) and display a significant upward trend.
5. 3 Observed Episodes of Elevated Ozone Background
From the previous section, it is apparent that exceedences of the ozone CWS (65ppb – 8
hour average) potentially may arise from a contribution of both mean background values
(20-35 ppb in B.C.) and episodic events that comprise “chemical weather”. The major
candidate episodic background sources in B.C. are:
• Intrusions of stratospheric ozone rich air during stratospheric downfolding events
(Bovis, 2003)
• Trans-Pacific transport of anthropogenically generated ozone (Jaffe et al. 2004).
• Trans-Pacific transport of ozone generated by bio-mass burning (Jaffe and
Keating, 2005).
• Locally generated “natural ozone” from lightning and forest fires.
It should be noted that when considering ozone concentrations in urban settings,
background ozone advected over cities may be depleted (titrated/scavenged) by local
emissions of nitric oxide (NO). The impact of elevated background concentrations may
therefore be greatest in rural or natural settings.
The potential impact of the four sources listed above on ambient ozone concentrations is
summarised in Table 2. Bovis (2003) has examined the impact of stratospheric ozone
intrusions on surface ozone concentrations in the Lower Fraser Valley by using 7Be (a
radionuclide measured in Vancouver as part of the Comprehensive Nuclear Test Ban
Treaty) as a tracer of stratospheric air. On the basis of this study it is apparent that
although stratospheric intrusions contribute to background levels in B.C., the episodic
impact on background concentrations at ground level is relatively small. No episodes of
significant elevation of concentrations were observed in the period 1996-2002. Jaffe et al.
(2003) have documented several cases of trans-Pacific transport of anthropogenic
pollutants (1993-2001) based on aircraft and ground observations (Cheeka Peak
11Observatory). Although episodic enhancements of mid-tropospheric O3 concentrations to
80-90ppb were observed there was little evidence of significant episodic enhancement at
ground level. Weiss-Penzias (2004) confirm that the enhancement of ozone due to Asian
sources at Cheeka Peak, Washington is of the order of 5 ppb and is at a maximum in
spring. Although the enhancement of ozone due to anthropogenic Asian sources of
precursor species appears relatively small, the impact of biomass burning plumes
originating in Eurasia seems to have the potential to significantly enhance background
levels and contribute to exceedances of the CWS. Jaffe et al. (2004) show that the
extensive wildfires in Siberia during summer of 2003 (the largest in a decade) likely had
a significant impact on O3 concentrations in the Washington/B.C. region. At Enumclaw,
Washington State, 8-hour average ozone concentrations reached 96 ppb on 6 June 2003,
of which 15 ppb was attributed to the Siberian fire plume (Figure 6). In the LFV O3
concentrations reached approximately 80 ppb during this event and were likely enhanced
to a similar extent.
Figure 6: From Keating et al. (2005)
The extensive Kelowna forest fires of 2003 provide an indication of the potential O3
enhancements associated with local biomass burning (Figure 7). At sites within the
Okanagan region (and recognising that O3 enhancements likely increase with distance
from source) during the peak of the event (21-23 August) concentrations decreased from
hourly maximum values of approximately 60 ppb to “background” values of 30-40ppb.
On this basis, it might be argued that at least locally, the forest fires were not responsible
for significant O3 enhancements and may have in fact reduced ambient concentrations.
Further research is required to assess the exact impact of the fires on local atmospheric
chemistry.
12Kelowna (ppb)
100 Vernon (ppb)
Kelowna Temp
(ppb) 80 Kamloops (ppb)
60
40
20
0
8/17/2003 8/19/2003 8/21/2003 8/23/2003 8/25/2003 8/27/2003 8/29/2003 8/31/2003
0:00 0:00 0:00 0:00 0:00 0:00 0:00 0:00
Figure 7: Time series of O3 concentrations at interior stations during forest fires of
August 2003 (data from the B.C. Ministry of Environment data archive)
Table 2: Impact of episodic events from different background sources on the O3
background
Background Maximum Duration Background Spatial Frequency
sources Ambient O3 of Event Contribution Extent
Concentration to Ambient
Stratospheric 30-40 ppb days 50-100% (20- regional Several
Intrusion1 40 ppb) times per
year
Trans-Pacific >80 ppb mid- Hours - 50% at mid- regional spring – 4-6
Anthropogenic troposphere days troposphere cases/decade
2
Ozone 40 ppb Ground 0-10%
Ground (5
ppb)
Trans-Pacific 96 ppb hours Siberian regional rare
Biomass plume 15%
Burning (15 ppb)
Plumes3 50%
“normal”
background
Local Forest 60 ppb days Uncertain but local inter-annual
Fires4 fire effect
likely small
1
Bovis 2001
2
Jaffe et al. 2003
3
Keating and Jaffe, 2005; Bertschi and Jaffe 2005, Bertschi et al. 2004, Jaffe et al. 2004
4
based on analysis of Kelowna 2003 event
136. RECOMMENDATIONS FOR MONITORING IN B.C.
Currently, monitoring in B.C. is largely restricted to urban settings or close to significant
anthropogenic point sources. In some cases (eg. Powell River Cranberry), monitoring
stations provide a reasonable estimate of concentrations experienced in “pristine”
settings. However, based on the findings described above, there is good justification for
the expansion of O3 and PM2.5 monitoring in B.C. to a limited number of “clean” sites in
order to:
(1) more accurately define the exact background concentrations which may affect the
application of CWS
(2) monitor trends in background concentrations that appear significant in light of
burgeoning emission sources (particularly in Eurasia).
The analysis above suggests that different monitoring strategies and priorities are
appropriate for O3 and PM2.5. For PM2.5, given that (a) concentrations are generally low
in B.C., (b) background concentrations are small (1-2µgm-3) compared to the CWS (c)
spatial variations in background appear to be negligible with respect to the CWS and (d)
there appears to be no discernible long term trend, there appears to be no urgent need for
monitoring at numerous “clean” sites across the Province. However, a good case can be
made for baseline monitoring stations spanning different physiographic regions (e.g.
West Coast, Interior plateau, Northeast) where the magnitude and variability of
“background” is not well-known. The highly variable location of forest fires makes it
difficult to site monitors specifically to address this aspect of the “background”.
For O3, mean background concentrations represent a significant proportion of the CWS
and there is an increasing trend. Furthermore O3 concentrations show significant
altitudinal variability. These factors imply a slightly different monitoring strategy than for
PM2.5. A top priority is the need to establish a long-term baseline pristine site (perhaps a
west coast Vancouver Island site analogous to Cheeka Peak) that would permit short-term
variations (chemical weather) and long term trends in “background” concentrations to be
identified, particularly in air masses with a trans-Pacific trajectory. The dependence of
ozone concentration on elevation and the importance of mid-tropospheric trans-Pacific
ozone transport suggest the need to also maintain a high altitude site (Environment
Canada already conducts chemical monitoring at Whistler Peak). Finally, strategically
located ozone monitors in two or three “clean” sites around the province (again perhaps
in major physiographic regions) would assist in determining the spatial impact of local
and long-range biomass burning plumes, Eurasian anthropogenic sources and
stratospheric intrusions.
Recommended priorities (in order) are:
(1) Establishment of a long-term pristine west coast baseline site (O3 and PM2.5,
and other atmospheric constituents if possible). West coast Vancouver Island
would be an ideal candidate.
14(2) Collaborate with Environment Canada to continue and enhance high-altitude
measurements at Whistler Peak, particularly ozone (but other atmospheric
constituents as well).
(3) Establishment of at least two other “clean” interior sites for O3 and PM2.5
(perhaps Interior Plateau, and Northeast).
In addition to the establishment of new monitoring sites, careful data analysis (including
stratification of data) from “non-pristine” existing monitoring sites may provide valuable
information on the magnitude, variability and source of background concentrations in
specific airsheds. By utilising trajectory analyses together with local wind data, it may be
possible to identify conditions when background (as opposed to local anthropogenic)
sources dominate. The impacts of forest fires on PM2.5 and O3 at the regional scale might
also be better defined.
7. SUMMARY AND CONCLUSIONS
In the absence of “pristine” monitoring sites for PM2.5 and O3 in British Columbia, survey
of the current literature, together with cursory analysis of available monitoring data,
provides an estimation of the likely magnitude, and spatial and temporal variability of
background concentrations across the region. In addition, it is possible to identify the
likely major sources of short-term variations in background concentrations. These results
are summarised in Table 3.
Table 3: Summary of background PM2.5 and O3 concentrations in B.C.
Estimated Mean Seasonal Short-term Peak Average Trend
Background Range Background Contribution
to ambient
PM2.5 2 μgm-3 1-4 μgm-3 250 μgm-3 25% little
Summer Local Forest Fire evidence
Peak (Jaffe)
Ozone 20-35 ppb1 20-35 ppb 40-50 ppb variable (up to 0.5-
Spring Peak + Trans-Pacific 100%) 2%/year
fire plume (15 ppb)
1
Vingarzan, 2004a, based on nearby clean sites Olympic Peninsula and Mount Rainier;
GVRD 2005
For PM2.5:
• Mean annual background concentrations of approximately 2 μgm-3 are low
compared to the CWS. They vary seasonally with a summer peak and winter
minimum. It is likely that precipitation variability is a major control on
background concentrations across the Province. Lower values are likely in wet
coastal areas while slightly higher values might be expected in drier regions.
• Local forest fires represent the major and most frequent source contributing to
short-term peak background concentrations. (Forest fires in Kelowna during
152003 had peak hourly PM2.5 concentrations of 250 μgm-3). Episodic trans-Pacific
dust transport is rare but has the potential to elevate concentrations by
approximately 20 μgm-3).
• Mean background concentrations in air masses arriving in B.C. with north Pacific
trajectories are of the order of 1.5 - 2 μgm-3. This represents a significant
proportion of the overall background concentration in B.C..
• There is little evidence of an upward trend in background concentrations. It is
likely that background concentrations associated with regional or continental
scale transport are decreasing due to abatement strategies in urbanised areas.
For O3:
• The mean background is estimated to be in the range 20-35 ppb and varies
seasonally with a spring maximum. This level represents approximately 50% of
the CWS and given short-term variability in background sources, it is likely that
the CWS will occasionally be exceeded by either background sources alone, or
the additive effect of local anthropogenically generated ozone and background
levels.
• There is little evidence that stratospheric intrusions of O3 rich air contribute to
exceedances of the CWS at ground level in B.C. (Bovis, 2001). However this
source may contribute 20-40 ppb to short-term peak concentrations (but
generally in meteorological conditions not conducive to elevated concentrations
associated with local anthropogenic activities).
• Episodic trans-Pacific ozone transport (arising from either biomass burning or
the anthropogenic combustion sources in Eurasia) may episodically increase
short-term ground level concentrations by 5-15 ppb. In one case this has been
shown to lead to exceedance of an 82 ppb 8- hour standard.
• Mean background concentrations show an upward trend of 0.5 -2.0%/year.
Based on these results it is recommended that priorities for monitoring in B.C. should
include:
• establishment of a long-term pristine west coast baseline site (O3 and PM2.5, and
other atmospheric constituents if possible).
• collaborate with Environment Canada to continue and enhance high-altitude
measurements at Whistler Peak, particularly O3 (but other atmospheric
constituents as well).
• Establishment of at least two other “clean” interior sites for O3 and PM2.5 (perhaps
Interior Plateau, and Northeast).
Further information on background concentrations across B.C. may also be gleaned from
analysis of existing data (see Appendix for proposed methodologies) and modelling
studies.
168. REFERENCE CITED AND BIBLIOGRAPHY
Bertschi, I.B. and D.A. Jaffe. 2005 Long-range transport of ozone, carbon monoxide and
aerosols to the NE Pacific Troposphere during the summer of 2003: Observations of
smoke plumes from Asian Boreal fires. J. Geophys. Res. 110, D05303, doi:
10.1029/2004JD005135.
Bertschi, I.B., D.A. Jaffe, L. Jaegle, H.U. Price, and J.B. Dennison, 2004
PHOBEA/ITCT 2002 airborne observations of trans-Pacific transport of ozone, CO,
VOCs and aerosols to the northeast Pacific: Impacts of Asian anthropogenic and Siberian
Boreal fire emissions, J. Geophys. Res., 109,D23, D23S12, 10.1029/2003JD004328
Bovis, P. E. 2001 Stratosphere troposphere exchange and its influence on surface ozone
concentrations in the Lower Fraser Valley, Unpublished MSc thesis, Atmospheric
Science Programme, University of British Columbia, 119pp.
CEPA (Canadian Environmental Protection Act). 1998. National Ambient Air Quality
Objectives for Particulate Matter. Part 1: Science Assessment Document and
Identification of Reference Levels. Public Works and Government Services, Ottawa,
Ontario.
CEPA (Canadian Environmental Protection Act). 1999. National Ambient Air Quality
Objectives for Particulate Matter. Addendum to the Science Assessment Document.
CEPA/FPAC Working Group on Air Quality Objectives and Guidelines. Public Works
and Government Services, Ottawa, Ontario.
Cheng L., H.S. Sandhu, R.P. Angle, K.M. McDonald and R.H. Myrick 2000 Rural
particulate matter in Alberta, Canada, Atmos. Env., 34; 3365-3372.
GVRD (Greater Vancouver Regional District) 2005. Air Quality Management Plan
(available online at: http://www.gvrd.bc.ca/air/pdfs/AQMPSeptember2005.pdf).
Hacker, J. P., I. G. McKendry and R. B. Stull, 2001. "Modeled downward transport of
Asian dust over Western North America during April 1998," Journal of Applied
Meteorology, 40, p. 1617-1628.
Husar R.B., et al., (28 coauthors) 2001 The Asian Dust Events of April 1998. J. Geophys.
Res. 106, 18,317-18,33.
Jaegle L., D.A. Jaffe, H.U. Price, P. Weiss-Penzias, P.I. Palmer, M.J. Evans, D.J. Jacob,
and I. Bey, 2003 Sources and budgets for CO and O3 in the Northeast Pacific during the
spring of 2001: Results from the PHOBEA-II Experiment. J. Geophys. Res. Vol 108, No.
D20, 8802, doi: 10.1029/2002JD003121.
17Jaffe D.A., T. Anderson, D. Covert, R. Kotchenruther, B. Trost, J. Danielson, W.
Simpson, T. Berntsen, S. Karlsdottir, D. Blake, J. Harris, G. Carmichael and I. Uno, 1999
Transport of Asian Air Pollution to North America. Geophys. Res. Letts. 26, 711-714
Jaffe D.A., T. Anderson, D. Covert, B. Trost, J. Danielson, W. Simpson, D. Blake, J.
Harris and D. Streets, 2001 Observations of Ozone and Related Species in the Northeast
Pacific During the PHOBEA Campaigns: 1. Ground based observations at Cheeka Peak.
J. Geophys. Res. 106, 7449-7461.
Jaffe D.A., D. Parrish, A. Goldstein, H. Price, and J. Harris, 2003 Increasing background
ozone during spring on the west coast of North America. Geophys. Res Letts. Vol. 30,
No. 12, 1613, doi: 10.1029/2003GL017024.
Jaffe D., I. McKendry, T. Anderson, and H. Price, 2003, Six 'new' episodes of trans-
Pacific transport of air pollutants. Atmos. Env., 37, 391-404.
Jaffe D., J. Snow, and O. Cooper, 2003 The April 2001 Asian dust events: Transport and
substantial impact on surface particulate matter concentrations across the United States.
EOS transactions. Nov. 18th.
Jaffe, D., I. Bertschi, L. Jaegle, P. Novelli, J. S. Reid, H. Tanimoto, R. Vingarzan, and D.
L. Westphal, 2004 Long-range transport of Siberian biomass burning emissions and
impact on surface ozone in western North America, Geophys. Res. Letts., 31, L16106,
doi:10.1029/2004GL020093, 2004.
Jaffe D., S. Tamura, and J. Harris, 2005 Seasonal cycle, composition and sources of
background fine particles along the west coast of the U.S. Atmos. Env. 39, 297-306,
Keating T., K. West and D. Jaffe 2005 Air quality impacts of intercontinental transport,
EM, 28-30
Kotchenruther R.A., D.A Jaffe, H.J. Beine, T. Anderson, J.W. Bottenheim, J.M. Harris,
D. Blake and R. Schmitt, 2001 Observations of Ozone and Related Species in the
Northeast Pacific During the PHOBEA Campaigns: 2. Airborne observations. J.
Geophys. Res. 106, 7463-7483, 2001. (Corrected Table 1 published in Vol. 106 (D17),
p.20,507. )
Lawrence, M.G., O. Hov, M. Beekmann, J. Brandt, H. Elbern, H. Eskes, H. Feichter and
M. Takigawa, 2005, The Chemical Weather, Environ. Chem, 2, 6-8.
doi:10.1071/EN05014
McKendry, I. G., 2000. "PM10 levels in the Lower Fraser Valley, BC, Canada: an
overview of spatio -temporal variations and meteorological controls," Journal of the Air
and Waste Management Association, 50, p. 174-185.
18McKendry, I. G., J. P. Hacker, R. Stull, S. Sakiyama, D. Mignacca and K. Reid, 2001.
"Long range transport of Asian dust to the Lower Fraser Valley, British Columbia,
Canada," J. Geophys. Res., 106(D16), p. 18361-18370.
McKendry, I.G., K. Strawbridge, N.T. O’Neill, A. M. MacDonald, P. Liu, R. Leaitch, K.
Anlauf, L. Jaegle, D. Fairlie , D.L. Westphal, Trans-Pacific transport of Saharan dust to
western North America: A case study, J. Geophys. Res. (submitted)
Suzuki, N. and B. Taylor, 2003: Particulate Matter in British Columbia: report on PM10
and PM2.5 mass concentrations up to 2000, Co-produced by British Columbia Ministry of
Water, Land and Air Protection, and the Pacific and Yukon Region of Environment
Canada, 129pp.
U.S. EPA (Environmental Protection Agency). 1996. Air Quality Criteria for Particulate
Matter. Research Triangle Park , NC: National Center for Environmental Assessment-
RTP Office ; Report nos EPA/600/P-95/001aF-cF. 3v.
U.S. EPA (Environmental Protection Agency). 2002. Air Quality Criteria for Particulate
Matter. Volume 1. Third External Review (April 2002). National Center for
Environmental Assessment - RTP Office, Office of Research and Development, US
Environmental Protection Agency, Research Triangle Park, N.C.EPA/600/P-99/002aC.
Vingarzan, R. 2004a. A review of surface ozone background levels and trends. Atmos.
Env., 38; 3431-3442.
Vingarzan, R. 2004b. Ambient Particulate Matter Concentrations in Canada
and Background Levels. Environment Canada, Environmental Conservation
Branch, Aquatic and Atmospheric Sciences Division, #201-401 Burrard
Street, Vancouver, British Columbia, V6C 3S5
Weiss-Penzias, P., D. A. Jaffe, L. Jaegl, and Q. Liang (2004), Influence of long-range-
transported pollution on the annual and diurnal cycles of carbon monoxide and ozone at
Cheeka Peak Observatory, J. Geophys. Res., 109, D23S14, doi:10.1029/2004JD004505.
19APPENDIX – PROPOSED METHODOLOGIES FOR ESTIMATING REGIONAL BACKGROUND
FROM EXISTING MONITORING SITES
Atmospheric pollutant monitoring in British Columbia has traditionally focussed on local
communities and pollutant exposures arising from the sum of background concentrations
and predominantly local sources associated with human activities (e.g. resource
industries, transportation). Consequently, the determination of regional background
concentrations from monitoring data is usually confounded by local pollutant sources.
Although, this report has provided reliable estimates of the likely magnitude of mean
background concentrations of PM2.5 and O3 in B.C., it is likely that regional variations in
background concentrations exist due to:
• For the case of PM2.5: variations in aridity/precipitation, vegetation cover,
proximity to oceanic air masses, differing wind climates (that may mobilise and
transport fine PM).
• For the case of O3: variations in elevation, latitiude, biogenic factors, upwind
sources. It should be noted that in the regional context in B.C., and away from the
primary urbanised areas of the LFV, CRD, and Okanagan Valley, local
anthropogenic sources of ozone precursors are less critical in determination of
background concentrations. Given that mean background concentrations are
reasonably well known, the major issue is the likely impact of stratospheric
intrusions on chemical weather long range transport.
Despite the inherent difficulties in extracting estimates of background concentrations
from existing monitoring stations, several approaches are proposed that share the
common goal of effectively removing the influence of local sources of pollutants. Such
methods invariably rely upon the use of other data sources, and in their most
sophisticated form include the use of modelling products (some of which may be
accessed online) to determine the impact of long range transport.
Proposed Methods
(1) Surface wind data to remove the influence of local anthropogenic sources:
In locations where monitors are occasionally influenced by a large point or line
sources (e.g. a pulp mill or major highway) it is possible to stratify pollutant data
by wind speed and direction. Pollutant concentrations from sectors with known
upwind anthropogenic sources may be removed from consideration when
estimating background values. Standard approaches in order of increasing
sophistication include :
(a) contingency tables (mean values of pollutants calculated for cells in a grid
of wind direction classes by speed classes). Such tables can be represented
graphically in a three-dimensional contour plot to illustrate mean
concentrations (of say PM2.5 or O3) and to identify concentrations
associated with sectors deemed to be relatively “clean”.
(b) Pollution wind roses: this widely used approached is a graphical means of
representing the data described in (a) and is a variant of the standard wind
rose.
20Note: in both the approaches described above stability data may also be exploited.
Figure: example of pollutant wind roses from India. Note that instead of the
tradition wind speeds plotted on the arms of the rose, frequencies of pollutant
concentration classes are plotted.
(2) Ancilliary monitoring data: It may be useful in some cases to use other monitored
species (where available) to identify times when local anthropogenic sources
(combustion) are active (and thereby exclude such times from estimation of
background concentrations) – routinely monitored candidate species include
carbon monoxide (CO), NO, NO2 and SO2. If such species are all low when PM2.5
or O3 are high, it may indicate natural sources of PM2.5 and O3.
(3) Time of day/stability may also be used to stratify data into periods when local
sources are known to be weak (industry not operating or traffic light) – e.g. early
morning but neutral stability.
(4) Statistical techniques: a variety of multi-variate statistical techniques are available
that may exploit all data in 1-3 above in order to identify clusters of data when
monitoring data best reflects “background” values. Discriminant analysis,
Principal Component Analysis (PCA), and cluster analysis are potential candidate
methods.
(5) Trajectory analysis: at larger scales than implied in (1) backward trajectories
using CMC products or Hysplit (http://www.arl.noaa.gov/ready/hysplit4.html) may be calculated
in order to investigate long range contributions to local pollution burdens. This
may also form part of investigation of cases of stratospheric intrusions of O3. The
latter may also involve detailed synoptic (and upper air) analyses.
(6) Chemistry modelling available online from GEOS-CHEM Near Real Time (NRT)
products (http://coco.atmos.washington.edu/cgi-bin/ion-p?page=geos_nrt.ion) or NAAPS aerosol model
(http://www.nrlmry.navy.mil/aerosol/). These products may be used to identify cases of long-
range transport of aerosol and ozone that contribute to chemical weather.
Given that each monitoring station considered in such an analysis represents a unique set
of circumstances with respect to its exact location in relation to local and distant sources,
the geographic setting, the nature and distribution of sources etc., it is apparent that
methodologies adopted will vary from monitoring site to site. Furthermore, to a large
degree, the availability of wind and ancillary pollutant data will dictate the methods used
and in large part determine the accuracy of the background concentration estimates.
2122
You can also read