COMMUNITY HEALTH PROFILE - Prepared by: Santa Fe MPO
←
→
Page content transcription
If your browser does not render page correctly, please read the page content below

MARCH 2021

COMMUNITY HEALTH
PROFILE
SANTA FE SOUTHSIDE SECTOR GREENWAY LOOP

                                                              Prepared by:
                           NPS Rivers, Trails and Conservation Assistance Program
                                             Santa Fe Metropolitan Planning Office
                                     Santa Fe Public Schools Sustainability Office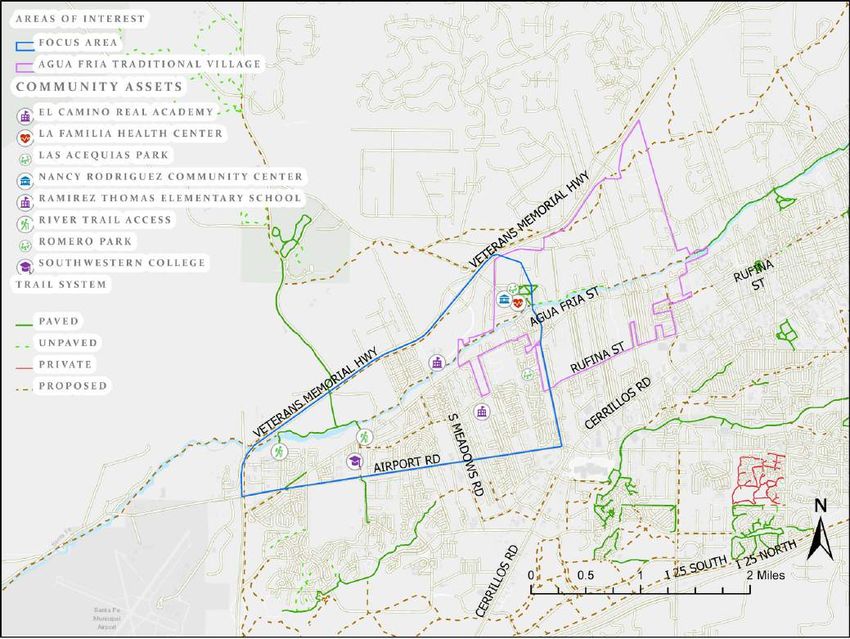
TABLE OF CONTENTS

 01 PROJECT SUMMARY                                                   1
    Community Health Profile Brief
    Community Description
    Context
    History

 02 DEMOGRAPHICS                                                      6
    Basic Population and Density
    Age and Gender Distribution
    Socio-economics
    Employment and Income Levels
    Transportation
    Educational Levels
    Race & Ethnicity Statistics
    Living Situations
    Quality of Life

 03 DISEASE PREVALENCE AND HEALTH RISK
    FACTOR INDICATORS                                                 13
    Disease Rates
    Prescription, Illicit Drug and Alcohol Abuse Rates
    Smoking Rates
    COVID-19 Rates
    El Camino Real Academy & Ramirez Thomas Elementary Health Cases
    Obesity Rates
    Physical Inactivity Rates
    Availability of Healthy Foods or Food Deserts
    Life Expectancy
    Individuals Living with a Disability
    Mental Health
    Community Safety/Injury
    Access to Parks
    River Trail West Use
    Climate

 04 SUMMARY OF FINDINGS                                               20

  05 GOALS                                                            22

  06 ACKNOWLEDGMENTS                                                  23

  07 SOURCES                                                          24

  08 APPENDIX                                                         25
01.PROJECT SUMMARY
 Community Health Profile Brief
 This Community Health Profile captures the need for improvements to the transportation environment
 and access to outdoor recreation in an area of Santa Fe that has been severely overlooked during past
 development and infrastructure planning. That area is referred to in this document as the Southside
 Sector Study Area (SSSA). The current conditions and trends for this area shows the need for
 enhancement to the transportation environment.

 Photo of El Camino Real Trail
 Photo Credit: Santa Fe County

 Understanding the context and characteristics of a community is the first step towards meaningful
 engagement and a successful outdoor recreation and conservation opportunities. We hope that the
 data presented in this Community Health Profile are used to engage and enlist new partners, funding
 sources, and stakeholders, while proposing important improvements for the quality of life of the
 neighboring community members.

 This document establishes the context for assessing potential impacts and for decision making in the
 project area. Deep analyses of both community health and the built environment reveals the
 opportunity for residents to benefit from equitable access to recreational spaces and modes of
 transportation.

 Image of children playing outside       Image of student playing in the snow    Image of family in Santa Fe, New Mexico
 Photo Credit: Santa Fe Public Schools   Photo Credit: Santa Fe Public Schools   Photo Credit: Elena Kayak
 (SFPS)                                  (SFPS)

COMMUNITY HEALTH PROFILE                                                                   PROJECT SUMMARY | PAGE 1
ACCENT SOLUTIONS INC.

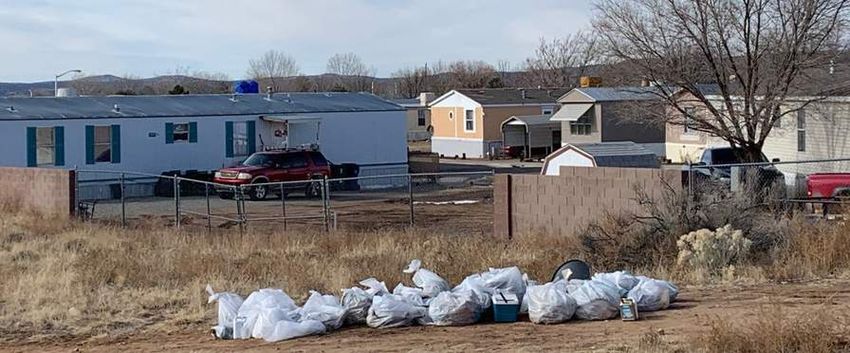
SANTA FE SOUTHSIDE SECTOR GREENWAY LOOP                                                                                 2021

 Community Description
 The area of interest the SSSA, is a 3.3 square mile area located in the southern portion of Santa Fe, New
 Mexico, west of and partially in Agua Fria Village (AFV). The estimated population of 13,800 represents
 one of the most rapidly growing areas in Santa Fe County. It contains a diverse socio-demographic
 population including a significant portion of low-to-moderate income residents. The diverse
 population can be traced to indigenous peoples and migration along the El Camino Real Trail, which
 was used by Spanish settlers prior to the arrival of the Mayflower in 1620.

 Image of mobile home in the study area                          Image of students and teachers at El Camino Real Academy
 Photo Credit: National Park Service (NPS), Rivers, Trails and   (ECRA)
 Conservation Assistance program (RTCA)                          Photo Credit: SFPS

 The area contains two public schools highlighted throughout this document, including El Camino
 Real Academy (ECRA) with current enrollments of 788 Pre-K to 8th grade students and Ramirez
 Thomas Elementary School (RTE) with 456 Pre-K to 5th grade students. Other community assets
 within the study area boundaries include Nancy Rodriquez Community Center, La Familia Medical
 Center which provides medical and dental services payable on a sliding-scale, and Southwestern
 College, (~200 students), specializing in mental health, art therapy and behavioral counseling.

 CONTEXT
 This primarily residential area boundary to the north and west is near the Veteran’s Memorial Highway
 (NM 599). This multiple lane highway allows speeds of up to 55 mph, while servicing freight and
 through-traffic. To the south, the area boundary by Airport road allows speeds of 40 to 45 mph on four
 lanes augmented with right and left turn lanes. Medians and marked crossings are sparse, and
 streetlights can be up to 1/2 mile apart.

COMMUNITY HEALTH PROFILE                                                                       PROJECT SUMMARY | PAGE 2
ACCENT SOLUTIONS INC.

SANTA FE SOUTHSIDE SECTOR GREENWAY LOOP                                                  2021

 Few outdoor spaces for recreational opportunities
 exist for use by this community. These include: a
 segment of the Santa Fe River Trail (as yet
 undeveloped), El Camino Real Trail, Romero Park,        SANTA FE
 and Las Acequias Park represent the most sizeable        COUNTY
 developed open spaces within the SSSA boundary.

 There are no full service grocery stores within the
 SSSA. Food desserts pose a significant void in the
 population of this area having access to fresh fruits
 and vegetables. The proposed re-location for an
 asphalt plant (which is said to run 24/7) along 86
 Paseo de River, right alongside NM 599, would be                            CITY OF
 very close (less than 3 miles away from ECRA                               SANTA FE
 campus) presenting a threat to the health of the
 community members within the SSSA due to its
 proximity.

                                                          FIGURE 1.1 MAP OF STUDY AREA

 FIGURE 1.2 CONTEXT MAP

COMMUNITY HEALTH PROFILE                                             PROJECT SUMMARY | PAGE 3
ACCENT SOLUTIONS INC.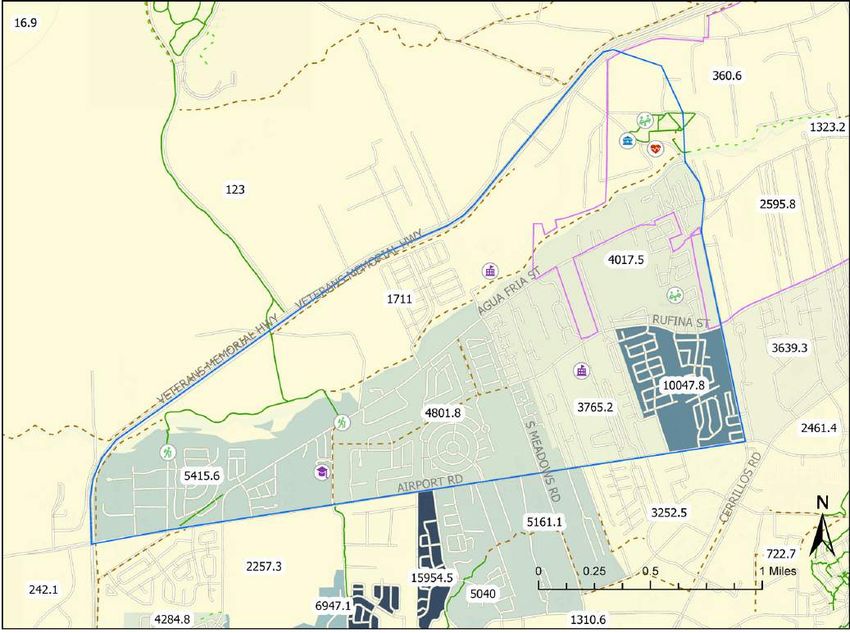
SANTA FE SOUTHSIDE SECTOR GREENWAY LOOP                                                                  2021

 History

 Historic rendering of Agua Fria in 1914
 Sourced by Elena Kayak

 The Santa Fe River’s riparian corridor is the defining geological feature. The Tanoans and other Pueblo
 peoples settled along the Santa Fe River for its water and transportation. The Tewa name for the river
 was Ca-Tee-Ka meaning "cold water." In our high desert with little precipitation and reliance on
 seasonal snow melt, this river was life to the original inhabitants.

 The colonial story of the AFV is similar to those of los parajes (the stops) along the El Camino Real Trail
 from Mexico City to Santa Fe. When the Spanish speaking colonizers traveled to the area in 1598, the
 river corridor was the logical thoroughfare and developed as a collection of estancias (residences),
 with the all-important access to the cold water that ran towards the Rio Grande from the Sangre de
 Cristo Mountains. The AFV area was the last resting place typically used by caravanning travelers
 heading northward to Santa Fe or south to La Cienega and Bernalillo (1).

 Teacher with students at the Agua Fria School         Community Members in AFV
 Photo sourced by Elena Kayak                          Photo sourced from Historic Santa Fe Foundation

COMMUNITY HEALTH PROFILE                                                             PROJECT SUMMARY | PAGE 4
ACCENT SOLUTIONS INC.

SANTA FE SOUTHSIDE SECTOR GREENWAY LOOP                                                                                  2021

 The area consisted of clusters of small adobe homes with subsistence gardens, or for more fortunate
 migrants, a yard hosting some domesticated livestock. The stops along the El Camino Real Trail were
 typically simple affairs, sometimes a crude adobe building with a hearth to build a fire. The El Camino
 Real Trail followed the river alignment as families, merchants, missionaries and other travelers used this
 route between Santa Fe and Mexico City.

 Mandela International Magnet School students cleaned up the area near CVMHP and the Petry Bridge on December 11, 2019
 Photo Credit: SFPS

 The ECRA school campus opened in 2014, after the school district decided to move the growing dual
 language program to a new site. It was originally started at the Agua Fria School, which was
 constructed in 1935-36, as part of the New Deal. There are a handful of staff members who have shared
 almost two decades with the AFV & ECRA communities, that remember the brinca brincas (bounce
 house) of the Community Day, where families came to the campus for a day of outdoor fun.

 Images of students at ECRA
 Photo Credit: SFPS

COMMUNITY HEALTH PROFILE                                                                         DEMOGRAPHICS | PAGE 5
ACCENT SOLUTIONS INC.
02.DEMOGRAPHICS
 Basic Population & Density
 The SSSA contains approximately 17% of the City of Santa Fe (City) population and 12% of the
 households. Census block groups indicate that the location of the SSSA contains some of the most
 densely populated areas of Santa Fe. Population data derived from the 2010 census show that block
 groups in this area are denser than the City average, with ~1,500 more people living in a square mile
 here than in many other areas of the City (2). The authors expect that population density is more likely
 to have increased than decreased in this area since the 2010 data was made available.

                         FIGURE 2.1 POPULATION DENSITY OF STUDY AREA BOCK GROUPS (3)

 Age and Gender Distribution
                                                                             Figure 2.2 Age Groups
 Residents of the SSSA are younger than those in the     40
 City. Over a quarter of all Santa Fe residents
  younger than 18 live in the study area; 30% of the     30
 study area population is younger than 18.               20
 Conversely, the population older than 65 is much
 smaller in the study area than in other areas of        10
 Santa Fe (Figure 2.2). More than 50% of the
                                                          0
 residents of the SSSA are younger than age 35,                 % population > 65           % population< 18
 compared to 40% in the City.                                                       Study Area       City & AFV

COMMUNITY HEALTH PROFILE                                                               DEMOGRAPHICS | PAGE 6
ACCENT SOLUTIONS INC.
SANTA FE SOUTHSIDE SECTOR GREENWAY LOOP                                                                                 2021

 Socio-Economics
 There are more impoverished youth living in the SSSA than in the
 surrounding City neighborhoods. In 2015-2019, 18.3% of people were                                  Southside Sector
 living in poverty in the SSSA. An estimated 25.3% of children under 18
 were below the poverty level, compared with 5.0% of people age 65
 and older. An estimated 15.1% of people 18 to 64 years were below
 the poverty level.

                       Figure 2.3 People Living in Poverty                                              18.3%
30

20
                                                                                                 People Living in Poverty

10
                                                                                                     City of Santa Fe

 0
                                                                                                         13.3%
      Children < 18 yrs. old         Population > 65 yrs. old          People 18-65 yrs. old     People Living in Poverty
                                                                Study Area         City & AFV

 Poverty and near poverty have a greater prevalence in this area than in the City as a whole (Figure 2.3).
 The Federal Poverty Line (FPL) has long been known to under-estimate actual poverty (4), therefore
 including up to 200% of the FPL presents a more accurate picture. Figure 2.4 shows that the disparity
 between the SSSA and the City as a whole increases for each category up to 200% FPL demonstrating
 that the City overall is much wealthier than the study area.

                                           Figure 2.4 Percent Poverty Thresholds

                               People in poverty

 People within 125% of the poverty threshold

 People within 150% of the poverty threshold

 People within 200% of the poverty threshold

                                                   0              10                20          30             40           50
                                                                                                       Study Area   City & AFV

 The number of jobs in the area is significantly less than the number of residents with jobs, meaning
 most people have to leave their neighborhood to access employment. A larger percentage of SSSA
 residents are essential workers than overall the City, however, the jobs available in their region are not
 more likely to be essential jobs. Employment of those 16 and older is greater in this area compared to
 the City (Figure 2.6).

 The distribution of jobs away from housing contributes to residents in this area being more likely to
 drive to work and have multiple cars, and less likely to use another mode than compared to the City
 residents overall (see transportation section).

COMMUNITY HEALTH PROFILE                                                                               DEMOGRAPHICS | PAGE 7
ACCENT SOLUTIONS INC.
SANTA FE SOUTHSIDE SECTOR GREENWAY LOOP                                                                           2021

 In Santa Fe, residents pay approximately 50% of        Figure 2.6 Percent Employment and Income Levels
 their household income to cover the cost of their
 housing and transportation. Spending 45% or less       People 16 yrs. old Employed full time
 of   household     income     on    housing   and
 transportation is considered affordable by the         People 16 yrs. old Not in labor force
 Center for Neighborhood Technology (CNT). Not
 surprisingly, with a large percentage of car                              Income < $10,000
 commuters and low-income residents, housing
 and transportation is a financial burden for many                       Income > $200,000
 within the study area (5).
                                                                                                 0   10 20 30 40 50

                                                                   Figure 2.7 Percent Essential Jobs

                                                                    Essential jobs in the area

                                                           Area residents with essential jobs

                                                                            16+ full time jobs

                                                                                                 0     25   50      75

                                                                                          Study Area        City & AFV

                                                        The median income within our focus area was
                    Range 38-111     45 %+      45% OF THEIR
 INCOME ON TRANSPORTATION RELATED EXPENDITURES.
                                                        higher in the City and AFV with 6.7% compared to
                                                        the focus area which is 3.5%.

 Employment and Income Levels
 In 2019 the SSSA reported 48.6% of the
  population 16 and over employed full-time and
  31.5% were not currently in the labor force.                                          48.6%
                                                                                    People 16+ full-time
 An estimated 76.9% of the people employed
                                                                                  employed compared to
 were private wage and salary workers; 11.9% were
                                                                                 the City average of 41.5%
 federal, state, or local government workers; and
 11.1% were self-employed (not incorporated)
 business.
                                                                 31.5%
                                                            People +16 not in labor
 Approximately 66.6% of employed SSSA
                                                            force compared to the
 residents are considered essential workers
 compared to 59.1% regionally.
                                                            City average of 37.8%
                                                                                             $49,442
                                                                                      Median Income compared to
                                                                                            the City is $57,972

COMMUNITY HEALTH PROFILE                                                                  DEMOGRAPHICS | PAGE 8
ACCENT SOLUTIONS INC.
SANTA FE SOUTHSIDE SECTOR GREENWAY LOOP 2021
transportation
An estimated 84.1% of workers in
the focus area drove to work alone
in 2015-2019, and 12.3% carpooled,
compared to 79.0% and 9.3% in
the City and AFV. Among those
who commuted to work in SSSA, it
took them on average 15.5 minutes
to get to work.
Area residents are more likely to
have a longer commute, 30-60
minutes, than other areas within
the City (Figure 2.8). Longer
commute times have been
associated with obesity and stress.
FIGURE 2.8 PERCENT OF WORKERS WITH 30-60 MINUTES TRAVEL TIME TO
WORK; STUDY AREA IN THE RED BOUNDARY. (6)
The northern terminus of the New Mexico Rail Runner Express is located in downtown Santa Fe. Mass
transit is important to residents in the study area. One of the goals of the Santa Fe Safe Routes to School
Program, initiated in 2021, is to introduce students to safely walking and cycling to school more often,
and also to the modes of local and inter-city mass transit.
Route 1
Route 2
Route 4
Route 5
Route 6
Route M
Route 21
Route 22
Route 24
Route 26
0 25 50 75
FIGURE 2.10 2019 SANTA FE TRAILS BUS
ROUTE RIDERSHIP
The Santa Fe Trails City bus served
over 750,000 rides in 2019. It
accesses the SSSSA via two
numbered routes: #1 and #24
(Figure 2.9). Of these, the #1 is the
third most popular route citywide,
FIGURE 2.9 THE SANTA FE TRAILS BUS ROUTE MAP SHOWS EACH NUMBERED
ROUTE AS NUMBERED. THE TWO ROUTES ARE HIGHLIGHTED WHERE THEY and runs from the south side to
CROSS INTO THE SSSA. the north side of Santa Fe.
In December of 2019, 9% of all Santa Fe Trails' rides were served by route #1. The route #24 services only a
small area near the study area, but still represented the fourth most used route in the system, serving 5%
of the rides. The most popular route in Santa Fe is the #2 which also runs from the south to the north side
of Santa Fe. It services 69% of Santa Fe Trails rides and has stops near, but outside of the SSSA.
COMMUNITY HEALTH PROFILE DEMOGRAPHICS | PAGE 9
ACCENT SOLUTIONS INC.SANTA FE SOUTHSIDE SECTOR GREENWAY LOOP 2021
Education Levels
In the SSSA, 67.1% of people 25 years and
over graduated from high school and 14.1% Southside Sector Area
had a bachelor's degree or higher. An
estimated 32.9% did not complete high
school by age 25 compared to 11.9% city-
14.1%
wide (Figure 2.11).
The K-12 school enrollment in the SSSA was
approximately 2,800 in 2019. Preschool
enrollment was 298 and college enrollment
Bachelor's Degree or Higher
was 621. Of the SSSA 3 and 4-year-olds,
54.9% were in preschool compared to 51.2%
City of Santa Fe
in the City and AFV. Given the
demographics, it is important to highlight 39.1%
that ECRA is the only fully dual language Bachelor's Degree or Higher
public school in the City.
Figure 2.11 Percent Education Levels
100
75
) %( e g a t n e cr e P
50
25
0
High School >25 Bachelors Degree or Higher Did not Complete High School
Study Area City & AFV
Over one third of the total enrollment at ECRA are students who live in the Cottonwood Village Mobile
Home Park (CVMHP) southwest of the campus. Both ECRA and RTE are designated Title I schools. The
basic principle of Title I is schools with large concentrations of low-income students who receive
supplemental funds to assist in meeting student's educational goals. Many students who have been
identified as “at-risk” can benefit from being supported in a Title I school. The amount of school
funding usually depends on how many students qualify for a free or reduced lunch program.
At least 40% of the students must qualify for a free or reduced lunch for a school to receive funding.
The general guideline of a Title I school is to ensure that it addresses social equity for students and
students can thrive despite their socioeconomic status.
COMMUNITY HEALTH PROFILE DEMOGRAPHICS | PAGE 10
ACCENT SOLUTIONS INC.SANTA FE SOUTHSIDE SECTOR GREENWAY LOOP 2021
Race and Ethnicity Statistics
The population in the SSSA is primarily Hispanic, with
88.4% claiming a Hispanic or LatinX origin. The remaining Southside Sector
residents are mostly white (10.1%), another race (8.6%),
multi-racial (2.2%), or Native American (1.1%). By contrast,
within the City and AFV, 56.5% claim Hispanic or LatinX
origin, with 38.7% of the residents identifying as white and 88.4%
non-Hispanic. Other ethnicities don’t exceed 2% of the
population of the City; 1.8% of the population is Native
American.
Hispanic or LatinX
In addition, nearly one third (29.5%) of SSSA residents City of Santa Fe
speak English “less than very well” compared to 11.8% in
the City. Spanish is the predominant language spoken at
56.5%
Hispanic or LatinX
home (70.7%) in this area (Figure 2.12).
Figure 2.12 Race and Ethnicity
100
75
) %( e g a t n e cr e P
50
25
0
Hispanic/LatinX Speak English less than "very well" Spanish spoken at home
Study Area City & AFV
Living Situation
The households within the SSSA are on average larger than Southside Sector
households in the City. The majority of households within the SSSA
are greater than two people (54.4%), while in the City and AFV, most
households are not more than two people (72.3%). Nearly 20 percent
of all households in the SSSA have five or more people compared to 7
percent in the City and AFV. Twenty-nine percent of family
households are female with no spouse, which is slightly higher than 20%
found in the City and AFV (25.9%).
The most common housing type within the SSSA is mobile homes 5 or more people
(45.8%), followed by single family homes (38.7%), and multi-family
City of Santa Fe
homes (15.4%). Within the City and AFV single family and multi-
family homes are much more common, making up 65.9% and 24.8% 7%
of all homes. Mobile homes make up 9.3% of all homes within the 5 or more people
City and AFV.
COMMUNITY HEALTH PROFILE DEMOGRAPHICS | PAGE 11
ACCENT SOLUTIONS INC.SANTA FE SOUTHSIDE SECTOR GREENWAY LOOP 2021 Quality of Life Research has indicated that emotional well-being increases with income up to a threshold of $75,000 in 2009 dollars, or the regional equivalent (7). Figure 2.13 Percentage of Households Below the Quality of Life Threshold Income uses a regionally adjusted quality of life threshold income to show the percentage of the City residents meeting this threshold. The study area is shown in red and demonstrates large percentages of these residents are below this threshold. FIGURE 2.13 PERCENTAGE OF HOUSEHOLDS BELOW THE QUALITY OF LIFE THRESHOLD INCOME (6) COMMUNITY HEALTH PROFILE DEMOGRAPHICS | PAGE 12 ACCENT SOLUTIONS INC.
03.DISEASE PREVALENCE AND RISK FACTORS
                                         Santa Fe County Data
                ASTHMA                      CARDIOVASCULAR DISEASE                            DIABETES

               11.7%                                27.8%                                    9.7%
          Compared to 14.4% in the           Adults diagnosed with High Blood           Compared to 12.5% in the
       State of New Mexico (2013-2017)                   Pressure                    State of New Mexico (2013-2017)

     The 2017 results from the YRRS        48.1% of those diagnosed are over       A majority of those diagnosed are
    NM-IBIS reported, 11% has Asthma          the age of 65. Of the people         over the age of 65 (13.2%). Most of
    among the students surveyed from        diagnosed in the County 28.5%             those diagnosed identify as
              9-12th grade.                   identify as White and 25.8%          Hispanic/LatinX (12%) and Native
                                               identify as Hispanic/LatinX.                American (8.5%).

     ALCOHOL RELATED DEATHS                       SMOKING RATES                  PRESCRIPTION & ILLICIT DRUGS

             56.4%                                   14.3%                                     32.5
         Compared to 62.2% in the               Compared to 17.2% in the              Deaths per 100,000 population
            State of New Mexico                    State of New Mexico               compared to 24.6 in the State of
                 (2013-2017)                            (2013-2017)                      New Mexico. (2013-2017)

       The 2017 results from the YRRS       The 2017 results from the YYRRS        The 2017 results from the YYRRS
       NM-IBIS reported 28.4% drinking       NM-IBIS reported 2.2% frequent       NM-IBIS reported 33.9% of students
         alcohol among the students       cigarette smoker among the students      surveyed from 9-12th grade. used
         surveyed from 9-12th grade.           surveyed from 9-12th grade.                   Marijuana (8).

                                                                                   *Youth Risk and Resiliency Survey - YRRS

Community health data suggests County residents may suffer from various ailments at a higher rate
than in the study area. Perhaps this is because the population is younger than surrounding areas, or
that preventative measures are more in the area.

While deaths due to illicit drugs have remained steady during the past decade, deaths due to
prescription drugs (particularly opioid pain relievers) have increased dramatically. In addition to the
high death rates, drug abuse is one of the most costly health problems in the U. S.

 cOVID-19
 This area has been hit especially hard by the COVID-19 pandemic. As of February 12, 2021, nearly one
 third of all cases in the City and AFV were in this neighborhood, despite having only 17 percent of the
 population. The odds of testing positive for COVID-19 were nearly twice as high in this neighborhood
 than in the City (9).

COMMUNITY HEALTH PROFILE                                                 DISEASE PREVALENCE & RISK FACTORS | PAGE 13
ACCENT SOLUTIONS INC.
SANTA FE SOUTHSIDE SECTOR GREENWAY LOOP 2021
EL CAMINO REAL ACADEMY AND RAMIREZ THOMAS ELEMENTRARY HEALTH CASES
The health data provided by the SFPS Student Wellness
Department demonstrates that the top three health factors
affecting students at ECRA and RTE are asthma, severe allergies,
Average Student
and ADHD. From the data analysis, RTE has a higher percentage Enrollment (2017-2021)
of students with these three health related problems than ECRA 808 401
(Figure 3.1).
ECRA RTE
FIGURE 3.1 AVERAGE HEALTH CASES REPORTED FROM 2017-2021
Asthma
) %( e g a t n e cr e P
Severe Allergies
ADHD
Seizures
Diabetes
0 2 4 6
ECRA RTE
Obesity Rates PHYSICAL INACTIVITY RATES
Nearly a quarter (24.6%) of the adults
living in Santa Fe County were Santa Fe County
considered obese from 2017-2019 (10). In
12%
While Santa Fe County adults
the State of New Mexico, 32.3% of adults
report less physical inactivity than
were considered obese. In Santa Fe, the Reported NO leisure the state overall (19.7% versus
age group with the largest percentage of time physical activity 23.9%), Santa Fe County youth are
obesity was adults ages 18-34 with 30.2%
more inactive than the state
of that age group considered obese. A
greater percentage Hispanic/LatinX were
76.3% overall (16.6% versus 14.2%). The
Access to exercise CDC recommends 60 minutes of
considered obese in Santa Fe County
opportunities (2018) daily physical activity for all ages.
than White, non-Hispanic (31.6% versus
17.8%). 2018 County Health Rankings
Availability of Healthy Foods or Food Deserts
According to the Food Access Research Atlas map released by the USDA (based data from 2015), tracts
representing 90% of the residents within the SSSA are identified as having a significant number of low
income households who are located more than a mile from the nearest grocery store.
In 2015-2019, 21.7% of households in the SSSA received SNAP (the Supplemental Nutrition Assistance
Program) compared to 12.3% in the City and AFV. An estimated 72.7% of households that received
SNAP had children under 18, and 27.2% of households that received SNAP had one or more people 60
years and over.
ECRA and RTE provides free and reduced meals to its students including breakfast and lunch for all of
its enrolled students.
COMMUNITY HEALTH PROFILE DISEASE PREVALENCE & RISK FACTORS | PAGE 14
ACCENT SOLUTIONS INC.SANTA FE SOUTHSIDE SECTOR GREENWAY LOOP 2021
FIGURE 3.2 SNAP STATISTICS
Household with SNAP
SNAP Households children 60
0 25 50 75
Percentage (%) Study Area City & AFV
Life Expectancy AT BIRTH
Life expectancy in the SSSA is approximately 78 years. This is lower than the City which is 85 years (17).
Individuals Living with a Disability
In the focus area, among the civilian non-institutionalized population in 2015-2019, 11.4% reported a
disability. This is slightly less than the City and AFV overall, which has 14.2% of the population with a
disability. The likelihood of having a disability is roughly the same between the SSSA and the City/AFV
for those under 65, however, adults over 65 were more likely to have a disability in the SSSA than in the
City/AFV.
FIGURE 3.3 DISABILITY PREVALENCE
People Reporting Disabilities
Likelihood of having a disability < 64
Likelihood of having a disability > 65
0 10 20 30 40 50
Percentage (%)
Study Area City & AFV
Mental Health
In 2019, 19.4% of the surveyed people in Santa Fe County reported doctor-diagnosed depression. In
2013-217 Santa Fe County reported 23.7 age-adjusted-deaths per 100,000 people. This is higher than the
State of New Mexico which was 21.9% and 13.5% in the United States. In 2017, suicide was the ninth
leading cause of death in New Mexico, the second leading cause of death by age group for persons 5-
34 years old and the fourth leading cause of death by age group 35-44 years old. Approximately 23% of
suicide deaths are directly attributable to alcohol consumption. According to the Youth Risk and
Resiliency Survey NM-IBIS, in 2017, 39.8% of 9-12th grade students surveyed in Santa Fe County reported
feeling prolonged sadness or hopelessness in the past year, compared to 36.6% statewide (10).
The rate of suicide in AFV is 29 age-adjusted deaths per 100,000 residents. This is lower than the City
which is estimated as 17 age-adjusted deaths per 100,000 residents (17).
COMMUNITY HEALTH PROFILE DISEASE PREVALENCE & RISK FACTORS | PAGE 15
ACCENT SOLUTIONS INC.SANTA FE SOUTHSIDE SECTOR GREENWAY LOOP 2021 COMMUNITY SAFETY/INJURY Crashes within the focus group Between Jan. 1, 2010 and Dec. 31, 2019, there have been 8 fatal crashes within the SSSA. A quarter of those involved pedestrians. Meanwhile, 725 injury crashes (73 per year on average) and 1,365 property- only crashes (137 per year on average) occurred during this time span. Figure 3.4 shows where crashes are concentrated, with the severity of each crash indicated by the icons. This demonstrates that crashes are concentrated on arteries like Airport Road to the south, however, a pedestrian was killed at the intersection of Agua Fria Road and South Meadows Road, within 1,000 ft of the ECRA entrance. FIGURE 3.4 CRASHES IN THE STUDY AREA BY SEVERITY Pedestrian/Cyclist Collisions New Mexico has been the state with the highest rate of pedestrian deaths from 2017 through 2019 according to preliminary statistics gathered for the Governors Highway Safety Association. This rate is measured as the number of fatalities per 100,000 people. Within the SSSA, there have been 44 pedestrians or bicycle involved crashes, with 82% of these resulting in injury. These collisions are most common between 7 and 8 AM, and after 3 PM, during the periods when many students will be commuting to and from school. In Santa Fe, pedestrian and bicyclist incidents are spread more or less equally throughout the seasons. There was an average of 15 incidents per month annually spread over a 10 year time period. COMMUNITY HEALTH PROFILE DISEASE PREVALENCE & RISK FACTORS | PAGE 16 ACCENT SOLUTIONS INC.
SANTA FE SOUTHSIDE SECTOR GREENWAY LOOP                                                                                                    2021

FIGURE 3.5 PEDESTRIAN AND BICYCLE CRASHES IN THE STUDY AREA

                                               FIGURE 3.6 CRASHES DURING EACH HOUR OF THE DAY
             250
             200
 s e h s ar C

             150
             100
                   50
                   0
                         1     2   3   4   5    6     7   8   9   10   11 12 13      14   15    16    17   18   19   20    21    22   23    24
                                                                       Hour of Day

                                           FIGURE 3.7 PEDESTRIAN/BICYCLIST INCIDENTS BY YEAR (SSSA)
             5
             4
 s t n e di c nI

             3
             2
             1
             0
                        2010       2011        2012       2013         2014     2015           2016        2017           2018        2019
                                                                         Year                               Study Area            City & AFV

COMMUNITY HEALTH PROFILE                                                             DISEASE PREVALENCE & RISK FACTORS | PAGE 17
ACCENT SOLUTIONS INC.
SANTA FE SOUTHSIDE SECTOR GREENWAY LOOP 2021
Access to Parks and Trails
Proximity to parks and trails is important within a community. Being within safe Southside Sector
walking distance to a park or trail allows youth and non-driving adults to access
important community asset. Parks provide opportunities for physical activity,
recreation, play, stress reduction, and community cohesion (11). The SSSA
contains two parks, Romero Park and Las Acequias Park, and two trailheads for
the River Trail. Approximately 27% of the households in this study area are
27%
within half a mile along the street network of a park entrance or trailhead. Only
16% of households are within half a mile along the street network of a park
entrance.
1/2 mile along the
In Santa Fe County, 58% of residents live within half a mile as the crow flies of a network of a park
park (12). Though park access calculated along a street network compared to as entrance or trailhead
the crow flies is usually lower, the disparity between the County overall and this
region is still clear.
Santa Fe County
Additionally, this study area has a high density of youth. Park access for youth is 58%
especially important for kids to meet Center for Disease Control (CDC) physical
activity guidelines of 60 minutes per day (13).
River Trail West Use
While there aren’t pedestrian or bicycle counts in the SSSA, the southern-most pedestrian and bicycle
count location along the River Trail is located ~3.3 miles from the easternmost study area boundary,
and is planned in the 2018 SFMPO Bicycle Master Plan to eventually connect to the El Camino Real
Trail within the study area boundaries. This trail is popular, with an annual average of 450 counts per
day in 2019. This trail has been an essential asset for the City during the COVID-19 global pandemic.
Between March, 1 2019 and August, 1 2019, this location had 520 daily users in 2019. After the City
closed, daily users numbers jumped to 860 during these months in 2020. Prior to the COVID-19
pandemic, trips made on the River Trail east of the SSSA were more frequent on the weekend, but trail
use during the week was also significant, suggesting that the trail serves a variety of people’s needs. On
a daily basis, the heaviest use of the trail is near the beginning of the school day, and when school gets
out through the rush hour. This suggests that some people are using the trail to commute, with school
being a likely destination. This benefit provided by the trail should be available to all Santa Fe residents,
or at least, be accessible to more of the population (14).
FIGURE 3.8 DAILY TRAIL USE FIGURE 3.9 HOURLY TRAIL USE
SANTA FE, NM 2019
Sun 30
sr e s u li ar t f o # e g ar e v A
Tue 20
Thur 10
Sat 0
1
3
5
7
9
11
13
15
17
19
21
23
0 200 400 600
Average # of trail users Hour of Day
COMMUNITY HEALTH PROFILE DISEASE PREVALENCE & RISK FACTORS | PAGE 18
ACCENT SOLUTIONS INC.SANTA FE SOUTHSIDE SECTOR GREENWAY LOOP 2021
Climate
Understanding the climate of a place is
important for future design strategies and to
build climate resiliency within communities. The
Drought Related Events
City is categorized as Climate Zone 5B which is
considered as dry climate (15). June, July, and
August are the hottest months with average
highs in the 80s. December and January are the
1,043
coldest with average lows in the teens. (Area Average Census Tract
12.04 andz 12.05)
The City does not receive very much rain or snow;
the average annual precipitation is 14.2 inches
with the highest amount of rainfall usually in Due to climatic conditions, the Santa Fe County
July. The average annual snowfall is 22 inches is vulnerable to droughts, especially during
and the most snow falls in December (16). winter season when precipitation is low. Levels
of drought according to the U.S. Drought
Monitor reached up to D-4 Exceptional Drought
in January 2021. The classification measures
temperature and precipitation. A D-4
Average High in July
classification can have severe impacts on
86 F widespread crop/pasture losses, shortages of
water in reservoirs, streams, and wells creating
Average Low in January water emergencies.
17 F According to the National Risk Index from
Average annual precipitation FEMA, 1,043 total drought related events were
14.2 in
recorded within census tracts 12.04 and 12.05,
which contain most of the SSSA. Other
Average annual snowfall significant reported weather cases in the area
are Riverine Flooding (55), Lighting (830), and
22 in Hail (226). Sustainable design strategies and
planning can be incorporated to mitigate the
(City of Santa Fe, U.S. Climate Data) effects of climate impacts and provide resiliency
for the safety and welfare of the community in
the area.
COMMUNITY HEALTH PROFILE DISEASE PREVALENCE & RISK FACTORS | PAGE 19
ACCENT SOLUTIONS INC.04.SUMMARY OF FINDINGS
The authors of this report have found that the
population of the Southside Sector Study Area
(SSSA) are more likely to be young, impoverished,
and Hispanic than is typical for the City residents.
They have a higher morbidity rate at a younger age
than the City average age of death. In addition,
nearly 40% of the residents have not attained a
high school degree. Many of the risk factors for
chronic disease, poor mental health, and substance
abuse are prevalent in this community.
Additionally, community assets that enable healthy
lifestyles, such as grocery stores, farmer's markets,
and opportunities for safe outdoor physical activity,
are missing. Image of SF MPO staff biking in the area
Photo Credit: NPS RTCA Program
This report was written during the 2020-2021
winter, when most businesses, schools, and social The opportunity to provide a much needed
gatherings are seeing highly altered daily resource to this community exists in the form of
operations due to the global COVID-19 pandemic. two major multi-use trails planned by the City of
Meanwhile national social inequities continue to Santa Fe: the Acequia Trail from South Meadows to
be underlined by the disproportionate negative San Felipe, and the River Trail from Romero Park to
effect of COVID-19 on communities of color. the completed River Trail at Agua Fria and San
Similarly, as shown by this report, the SSSA has Felipe. When finished, these trails will provide the
been disproportionately affected by this virus. opportunity for SSSA residents to travel off-street
across Santa Fe's major corridors by foot or bicycle.
During the development of this report the authors
were introduced to Earth Care, an organization Additionally, these trails will provide key
with 20 years committed to youth and family connections within the community as well as
leadership development for transformational essential neighborhood recreational spaces which
change. For the last ten, much of the work has are currently lacking. The River Trail expansion will
been focused in the communities north and south connect El Camino Real Academy to the densely
of Airport Road. We see this profile as a means to populated Cottonwood Village Mobile Home Park,
support and further leverage the efforts of Earth allowing students to safely walk or bike to school
Care moving forward. Please see full description of and therefore reducing the number of school
Earth Care in appendix. buses needed to serve this area.
Image of the SSSA
Photo Credit: SF MPO
COMMUNITY HEALTH PROFILE SUMMARY OF FINDINGS | PAGE 20
ACCENT SOLUTIONS INC.SANTA FE SOUTHSIDE SECTOR GREENWAY LOOP 2021 In addition, these trails will link the Southside population with economic centers of the plaza and midtown areas located to the north and east of the study area. Traveling west, these trails will connect more SSSA residents with the El Camino Real Trail that leads to the Santa Fe Municipal Recreational Complex and extensive recreational areas north of the Veterans Memorial Highway (NM 599). FIGURE 4.1 SOUTHSIDE GREENWAY PORPOSED TRAILS MAP Nearby pedestrian and bicycle counters on the multi-use trails in other parts of the City have seen large increases of users during the pandemic, illustrating their utility during this slow-moving emergency as people look for safe ways to exercise outside, and new means of transportation as bus ridership plummets. Because Santa Fe is also located in the state with the highest rate of pedestrian death, these trails are essential components of a larger park system and transportation network. Unfortunately, these trails remain incomplete in the Southside Sector Study Area to the detriment of Santa Fe residents and children. COMMUNITY HEALTH PROFILE SUMMARY OF FINDINGS | PAGE 21 ACCENT SOLUTIONS INC.
05.GOALS
 The Southside Sector is a vibrant and diverse community in Santa Fe, New Mexico. Despite
 facing a number of socioeconomic and health disparities, community residents and partners
 are taking action to ensure quality of life is accessible to all. Here are five ways in which the
 Southside Sector can support community well-being in the Study Area:

                             Transportation opportunities
                             such as bike riding or walking

   TRANSPORTATION

                                                                    Physical activity
                                                                     opportunities

                                   HEALTH

                                      Access to nature, outdoor
                                       recreation and exercise
                                            opportunities

        ACCESS

                                                    Outdoor and nature-based
                                                  programming to support youth
                                                     development and safety

                                  YOUTH

                             Connection with neighborhoods
                             and institutions within the area
     CONNECTIVITY

COMMUNITY HEALTH PROFILE                                                            GOALS | PAGE 22
ACCENT SOLUTIONS INC.
06.ACKNOWLEDGEMENTS The Santa Fe Southside Sector Greenway Community Health Profile was a created through a collaborative effort among the following organizations: The National Park Service Rivers, Trails and Conservation Assistance Program (RTCA): The National Park Service (RTCA) program partners with community groups, nonprofits, tribes, and state and local governments to design trails and parks, conserve and improve access to rivers, protect special spaces, and create recreation opportunities (www.nps.gov/rtca). Marcy DeMillion Maria F. Trevino Sydney Garcia Community Planner, NM Community Planning Fellow, NM Community Planning Fellow, TX SANTA FE METROPOLITAN PLANNING ORGANIZATION (SF MPO) The Santa Fe MPO provides a forum for transportation decision making in the metropolitan planning area, which encompasses approximately 25% of Santa Fe County’s land area and includes 80% of its population. The MPO promotes a multimodal transportation system that serves the mobility needs of all citizens. (https://santafempo.org/) Erick J. Aune Leah Yngve Hannah A. Burnham Santa Fe MPO Officer Transportation Planner Transportation Planner SANTA FE PUBLIC SCHOOLS (SFPS) Santa Fe Public Schools is an independent school district servicing about 12,000 students in 28 schools. Elena Kayak SFPS Sustainability Program Specialist SPECIAL ACKNOWLEDGEMENTS Special recognition to Lead Nurse Anita Hett of the SFPS Student Wellness Department, who despite her responsibilities to keep staff and students safe during the Covid pandemic, supplied important student health information. Thanks to Rob Martinez, New Mexico State Historian; William Mee, President, Agua Fria Village Association; Dolores Pacheco, Marquita Montaño, El Camino Real Academy Administrative Assistant, and Jakob Lain, ECRA Principal. COMMUNITY HEALTH PROFILE ACKNOWLEDGMENTS | PAGE 23 ACCENT SOLUTIONS INC.
07.SOURCES

 1. https://www.historicsantafe.org/agua-fria-village
 2. data.census.gov
 3. ArcGIS online map titled: USA Block Groups.
 4. https://groundworkcollaborative.org/wp-content/uploads/2019/11/The-Costs-of-Being-Poor-
 Groundwork-Collaborative.pdf
 5. https://htaindex.cnt.org/fact-sheets/?focus=place&gid=16407
 6. enviroatlas.epa.gov
 7. EnviroAtlas Percentage of Households below the Quality of Life Threshold Income Fact
 Sheet
 8. YRRS NM IBIS, 2017
 9. NMDOH data request; unadjusted odds ratio
 10. NM IBIS, BRFSS 2017-2019
 11. CDC
 12. https://ephtracking.cdc.gov/
 13. https://www.cdc.gov/physicalactivity/basics/children/index.htm
 14. SFMPO- trail counts
 15. https://openei.org/wiki/Climate_Zone_5B
 16. https://www.usclimatedata.com/climate/santa-fe/new-mexico/united-states/usnm0292
 17. Mental and Behavioral Health | Santa Fe Public Health Dashboard (mysidewalk.com)

COMMUNITY HEALTH PROFILE                                                     SOURCES | PAGE 24
ACCENT SOLUTIONS INC.
08.APPENDIX
 DEMOGRAPHICS: SOUTHSIDE GREENWAY STUDY AREA CITY OF SANTA FE AND
 AGUA FRIA VILLAGE.

 Demographics                                           SSSA     City of Santa Fe & AFV
 Population                                             13,785          85,766
 Households                                              4,033          35,302
 % of people in poverty                                 18.3%           13.3%
 % of people within 125% of the poverty threshold       25.8%           19.5%
 % of people within 150% of the poverty threshold       33.8%           24.5%
 % of people within 200% of the poverty threshold       47.1%           31.1%
 % of people of Hispanic / LatinX origin                88.4%           56.5%
 % of people who speak English less than "very well"    29.5%           11.8%
 % with Spanish spoken at home                          70.7%           33.5%
 % of people living with a disability                   11.4%           14.1%
 % of people who are 65+                                6.6%            22.0%
 % of people who are 17-                                30.1%           19.1%
 % of adults 25+ with less than a high school diploma   32.9%           11.9%
 Private jobs in the area                               1,131           48,916
 Area residents with private jobs                       5,320           37,455
 Essential jobs in the area                             60.6%           59.4%
 Area residents with essential jobs                     66.6%           59.1%
 Area residents 16+ with full time jobs                 48.6%           41.5%
 Institutions
 Hospitals:                                             0               3
 Schools: Childcare and K-12                            7               112
 Colleges / universities                                1               5
 Transportation
 % of workers who drive alone to work                   84.1%           79.0%
 % of workers who carpool to work                       12.3%            9.3%
 % of workers who take public transit to work           1.0%            1.3%
 % of workers who bike to work                          0.3%            0.7%
 % of households with one car                           30.3%           40.0%
 % of households that are car free                      4.8%            4.9%

COMMUNITY HEALTH PROFILE                                                         APPENDIX | PAGE 25
ACCENT SOLUTIONS INC.
Earth Care, an organization committed to youth and family leadership development for
transformational change, celebrates 20 years of work in 2021. For the last ten, much of the work
has been focused in the communities north and south of Airport Road. Hundreds of families, youth
and adult allies have participated in workshops, facilitated dialogues, retreats, institutes and
classes where we have collectively developed our leadership (defined as collective capacity and
action rather than individual qualities). Our members are students and youth who have organized
to ban plastic bags and respond to the climate crisis. Young people who have organized free
soccer leagues and safe spaces for immigrant youth. Parents who have demanded more of their
schools and their leaders, and organized support for young parents through Abriendo Puertas
classes. Our members have led the struggle for the South Side Teen Center, which will finally
break ground this summer, for school and community gardens, for bilingual staff in our libraries
and interpretation at city and county public meetings. This past year our members organized the
Santa Fe Mutual Aid Network and raised 300K so far to distribute to a network membership that
has risen to 1,500 families and individuals.

Starting around 2011, our Poder Familiar family leadership project began working with District 3
City Councilors on creating a vision and campaign for a healthy community. This work paralleled
our youth’s engagement in the planning for the Southwest Area Node (SWAN) Park around the
same time, and our management of a large AmeriCorps project. In 2012, we were commissioned
by the city to conduct community meetings around their Healthy Communities project. This
included two general community meetings, and over 30 house meetings, facilitated in Spanish by
our family leaders. Approximately 400 people were engaged directly, and over 2,000 received
informational pamphlets at their homes. We were also asked to work with local businesses, mostly
immigrant owned, and created the Airport Road Merchants Association. Neither the Healthy
Communities project, nor the Merchants Association persisted, as the city did not continue funding
for them, but much was learned by our leaders. Among other things, our leaders became much
more aware of the lack of public capital investment on our side of town. They also saw that the
majority of public and foundation funds entering the community were for deficit based charitable
activities that employed people from somewhere else. And, they realized that for real
transformation to occur we needed to invest directly in our people and in our capacity for self-
advocacy, community organizing and community-driven development.

We have remained focused on this work, hosting regular capacity building workshops and projects
for youth, families and adult allies, and in 2018 started convening a healthy community
development council. Along with several other organizations with a base in our area, as well as
the Mexican Consulate, WESST, and several local businesses, we have discussed aspects and
characteristics of a healthy, sustainable and socially just community. We have also identified
opportunities for community-driven development as well as threats in need of a response. The SF
Mutual Aid Network was one such response. Youth United for Climate Crisis Action has been
another one, and we also surveyed almost 1000 youth and families in the community to inform
programming and design for the South Side Teen Center. Our latest campaign is in response to
increased pollution from more and more industries that are locating in the area. We have launched
an Environmental Justice campaign that is also laying the groundwork for a new Healthy
Communities Campaign.

We have advocated for a better local response to the pandemic, which has seen our
neighborhoods suffer the highest infection and spread rates due to the highest vulnerability levels
in Santa Fe, while also being the least tested, the least insured and so far the least vaccinated.
We have also been the least informed and engaged as there has been very little culturally
appropriate and linguistically accessible information or outreach to our area. We have pushed on
the City and others to increase broadband access, as the neighborhoods north of Airport Road
are comparable to some rural areas in terms of internet access. This has made learning from
home difficult, if not impossible, for many children. We also partnered with the City Recreation
Department to establish a Recreation-on-Wheels program in order to get these services into our
mobile home parks. We are currently preparing to do outreach in Spanish for vaccination
registration and we are working with our families to increase their digital and job search skills.
Our council, composed of individuals from age 9 through 69, is now turning their focus towards
establishing a community resilience hub where community leadership, training and capacity
building can be supported while also serving as a site for resource distribution, support delivery
and services such as a library, a clinic, childcare and adult education. We also envision a park
with recreation spaces for all ages, a food and herb garden, a plaza and other convening spaces,
local commercial spaces and support for cultural programming like our City Art and Culture
Department supported youth guitar and ukulele group. Our children and families have taken to
heart the UFW slogan of Si Se Puede! Who are we to argue with that, Si Se Puede!!!
Cleaner Air and Cost Reduction of
    Reducing School Bus Routes at
Cottonwood Village Mobile Home Park to
       El Camino Real Academy

 Prepared by: Alyce Leck, Director of Transportation
              Santa Fe Public Schools

                  28 October 2020
Scope This report summarizes the analysis and subsequent benefits of reducing the number of school bus routes servicing the Cottonwood Village Mobile Home Park (CVMHP) to El Camino Real Academy (ECRA). Methodology This analysis considered the current number of bus routes, eligible students, New Mexico PED bus rider eligibility, mileage, newly improved walking access and reduction in cost of vehicle maintenance, fuel use, labor, and emissions. Calculating Reduced Mileage and Associated Cost Savings COTTONWOOD VMHP SCHOOL BUS ROUTE PER-MILE OPERATING COST ANALYSIS Average annual miles driven per Cottonwood VMHP route bus: 3,840 Depreciation schedule (life expectancy) in years: 15 Average fuel efficiency (miles per gallon): 7.7 Most recent diesel fuel price per gallon (10/20/20): $1.36 Most recent individual school bus purchase (05/20): $89,299 Average annual per-bus maintenance cost including labor: $2,629 Per-mile depreciation cost: $1.55 Per-mile fuel cost: $.18 Per-mile maintenance cost: $1.40 Total per-mile operating cost: $3.13 Reducing the amount of bus routes by just one route would save the District $12,019.20 in operating costs Calculating the Cost Benefit of Fewer CDL Drivers There is a national school bus driver shortage and our district is experiencing an increased need due to COVID-19. We are currently short 14 drivers. This is an annual problem that will most likely be an ongoing issue, so eliminating even one bus route and the need for more drivers allows us to be more
successful serving the community’s needs. The average annual salary for a bus
driver is $17,000.00.

Emissions-NOx is a Small Part of a Larger Story

In 1970, air quality became a hot issue in the United States, which resulted in
the enactment of the Clean Air Act. Overseen by the EPA, air quality nationally
is continually monitored and compared to EPA federal emissions standards for
six primary pollutants: carbon monoxide, nitrogen dioxide, sulfur
dioxide, particulate matter, hydrocarbons and photochemical oxidants. These
pollutants are considered the worst of the worst based on their effect on both
human health and the environment.

School buses contribute to four of these six pollutants: carbon monoxide
(CO), nitrogen dioxide (NOx), particulate matter (PM) and hydrocarbons
(NMHC).

According to AFLEET data:

POLLUTANT                                    New Diesel
(pounds)            Emission Type            Bus
N0x                 Upstream                          8.77
N0x                 Vehicle                          15.33
CO                  Upstream                           4.1
CO                  Vehicle                          18.41
S0x                 Upstream                          4.48
S0x                 Vehicle                           0.16
PM2.5               Upstream                           0.5
PM2.5               Vehicle                           0.47
PM2.5               Upstream                          0.61
PM2.5               Vehicle                           2.11
VOC                 Upstream                          2.41
VOC                 Vehicle                            1.7

Pollutant (short                             New Diesel
tons)               Emission Type            Bus

                    Combined Upstream &
GHG (CO2e)          Vehicle                           14.7
Eligible Students and Number of Bus Routes
Every year, more students are choosing to walk rather than ride the school bus
from CVMHP to ECRA. In the 2016-2017 school year, 6 bus routes served the
CVMHP eligible bus riders. In the 2019-2020 school year, only 4 buses
transported the students from the same area. The amount of eligible students
did not change; there are simply more students choosing to walk or find
alternative methods of transportation. Parents choosing to drive their students
to school would defeat the purpose of reducing the amount of buses. A safe and
inviting multi-use path could encourage walking or bicycle riding as the best
alternatives to the school bus.
• Currently 281 ECRA students K-8th grades reside in CVMHP
• 50 students per bus = 5.62 buses
Note: A school bus can sit up to 71 passengers with three elementary students
to a seat. Older students fit two to a seat, so with a mix of ages at ECRA, we
use 50 students per bus for routing purposes.
The Public Education department has determined eligibility for transportation
to be the following:
22-16-4 School bus routes; limitations; exceptions; minimum
requirements.
A. Bus routes shall be established by the local school district.
B. Except as provided in Subsections C and E of this section, no school
bus route shall be
maintained for distances less than:
(1) one mile one way for students in grades kindergarten through
six;
(2) one and one-half miles one way for students in grades seven
through nine; and
(3) two miles one way for students in grades ten through twelve.
C. In school districts having hazardous walking conditions as determined
by the local school board and confirmed by the state transportation
director, students of any grade may be transported a lesser distance than
that provided in Subsection B of this section. General standards for
determining hazardous walking conditions shall be established by the
state transportation division of the department with the approval of the
department, but the standards shall be flexibly and not rigidly applied bythe local school board and the state transportation director to prevent
accidents and help ensure student safety.
When measured by vehicle mileage CVMHP is 1.1 miles from ECRA, thus
making the students eligible for transportation. The same mileage measured
in walking distance through the side entrance to CVMHP is only 0.4 miles.
Total Benefits
Reducing just one of the 4 bus routes would offer a potential cost savings of
$29,019.20 annually. If all 4 bus routes were eliminated, the cost savings could
exceed $116,076.80 annually.
The reduced emissions would reduce the harm of air pollution posed by diesel
buses to students (who are both vulnerable and more exposed to bus exhaust)
as well as to school staff and Santa Fe’s south side dense residential
neighborhoods.
Conclusion
Reducing the amount of bus routes servicing the community in CVMHP would
benefit the district financially. However, if more parents choose to drive their
children to school in personal vehicles instead of have access to a school bus,
the increased health benefits would be diminished. For this project to succeed,
families will have to buy in to the idea of an active, healthy alternative to using
motorized vehicles (buses or cars) to get to and from school on a regular basis.Cleaner Air and Cost Reduction of
Reducing School Bus Routes at
Ramirez Thomas Elementary School
to the Zepol Road Area
Prepared by: Alyce Leck, Director of Transportation
Santa Fe Public Schools
15 January 2021Scope This report summarizes the analysis and subsequent benefits of reducing the number of school bus routes servicing the Sierra Vista Mobile Home Park (SVMHP) and Vista Alegre Apartments (VA) on Zepol Road, to Ramirez Thomas Elementary School (RTE). Methodology This analysis considered the current number of bus routes, eligible students, New Mexico PED bus rider eligibility, mileage, improved walking access and reduction in cost of vehicle maintenance, fuel use, labor, and emissions. Calculating Reduced Mileage and Associated Cost Savings Zepol Road Area School Bus Route Per-mile Operating Cost Analysis: Average annual miles driven per Zepol Road area route bus: 3,822 Depreciation schedule (life expectancy) in years: 15 Average fuel efficiency (miles per gallon): 7.7 Most recent diesel fuel price per gallon (1/13/2021): $1.43 Most recent individual school bus purchase (05/20): $89,299 Average annual per-bus maintenance cost including labor: $2,629 Per-mile depreciation cost: $1.55 Per-mile fuel cost: $.18 Per-mile maintenance cost: $1.40 Total per-mile operating cost: $3.13 Reducing the amount of bus routes by just one route would save the District $8,228.20 in operating costs Calculating the Cost Benefit of Fewer CDL Drivers There is a national school bus driver shortage and our district is experiencing an increased need due to COVID-19. We are currently short 14 drivers. This is an annual problem that will most likely be an ongoing issue, so eliminating
even one bus route and the need for more drivers allows us to be more
successful serving the community’s needs. The average annual salary for a bus
driver is $17,000.00.
Emissions-NOx is a Small Part of a Larger Story
In 1970, air quality became a hot issue in the United States, which resulted in
the enactment of the Clean Air Act. Overseen by the EPA, air quality nationally
is continually monitored and compared to EPA federal emissions standards for
six primary pollutants: carbon monoxide, nitrogen dioxide, sulfur
dioxide, particulate matter, hydrocarbons and photochemical oxidants. These
pollutants are considered the worst of the worst based on their effect on both
human health and the environment.
School buses contribute to four of these six pollutants: carbon monoxide
(CO), nitrogen dioxide (NOx), particulate matter (PM) and hydrocarbons
(NMHC).
According to AFLEET data:
 POLLUTANT                                    New Diesel
 (pounds)            Emission Type            Bus
N0x                 Upstream                          8.77
N0x                 Vehicle                          15.33
CO                  Upstream                           4.1
CO                  Vehicle                          18.41
S0x                 Upstream                          4.48
S0x                 Vehicle                           0.16
PM2.5               Upstream                           0.5
PM2.5               Vehicle                           0.47
PM2.5               Upstream                          0.61
PM2.5               Vehicle                           2.11
VOC                 Upstream                          2.41
VOC                 Vehicle                            1.7
Pollutant (short                             New Diesel
tons)            Emission Type               Bus
                    Combined Upstream &
GHG (CO2e)          Vehicle                           14.7
Eligible Students and Number of Bus Routes
There are 103 RTE students living along Zepol Road who currently ride the
school bus. A safe and inviting multi-use path between Calle Po Ae Pi and
Zepol Road could encourage walking or bicycle riding as the best alternatives to
the school bus.
• Currently 103 RTE students K-5th grades reside along Zepol Road in the
Vista Alegre apartments and the Sierra Vista MHP.
• 70 students per bus = 1.5 buses
Note: A school bus can sit up to 71 passengers with three elementary students
to a seat.
The Public Education department has determined eligibility for transportation
to be the following:
22-16-4 School bus routes; limitations; exceptions; minimum
requirements.
A. Bus routes shall be established by the local school district.
B. Except as provided in Subsections C and E of this section, no school
bus route shall be
maintained for distances less than:
(1) one mile one way for students in grades kindergarten through
six;
(2) one and one-half miles one way for students in grades seven
through nine; and
(3) two miles one way for students in grades ten through twelve.
C. In school districts having hazardous walking conditions as determined
by the local school board and confirmed by the state transportation
director, students of any grade may be transported a lesser distance than
that provided in Subsection B of this section. General standards for
determining hazardous walking conditions shall be established by the
state transportation division of the department with the approval of the
department, but the standards shall be flexibly and not rigidly applied by
the local school board and the state transportation director to prevent
accidents and help ensure student safety.
When measured by vehicle mileage VSMHP is 0.8 miles from the school and AV
apartments are 0.7 miles. This makes the students ineligible forYou can also read