COMPANY PRESENTATION 30.6.2020 - REIT 1 - ISRAEL'S FIRST REAL ESTATE INVESTMENT TRUST
←
→
Page content transcription
If your browser does not render page correctly, please read the page content below
1

    COMPANY PRESENTATION 30.6.2020
        REIT 1 – ISRAEL’S FIRST REAL ESTATE INVESTMENT TRUST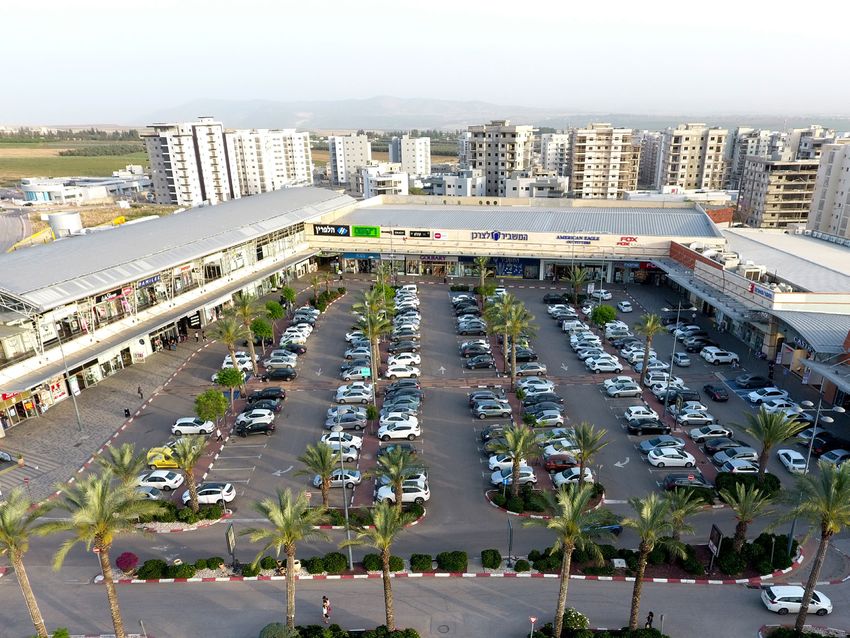
2

                                                                                  DISCLAIMER
    This presentation contains forward-looking information as defined in the Securities Law, 5728-1968 ("Securities Law"). This information includes, among others, various forecasts,
    assessments and estimates by the Company—as well as information presented through schemes and/or graphs and/or tables—regarding the adverse effects of coronavirus on
    its revenues, NOI growth, real FFO growth, real FFO per share, dividend distribution and long-term debt maturities, as they relate to the rest of 2020 or to subsequent years. The
    materialization of this information, in whole or in part, is uncertain and outside the Company's control, and may take a form different, or substantially different, from the way in
    which it is presented in the presentation.
    This information rests, among others, on the estimates of the Company's management and their subjective view based, among others, on their experience and professional
    know-how and on analysis of information concerning the current state of the Company's businesses, work plans, as well as on macroeconomic facts and data, all as known to the
    Company's management at the time of preparing this presentation.
    This forward-looking information is, by definition, uncertain, subject to significant non-materialization risks, and outside the Company's control. It is uncertain, impossible to predict
    with accuracy, and its materialization or non-materialization could be influenced, among others, by the Company's risk factors (as described in the periodic report for 2019), by
    changes in the Company's business plans or strategy and by developments in the general environment affecting the Company, including the COVID-19 (corona) crisis. The
    Company does not undertake to update and/or revise any such forecast and/or assessment and/or estimate in order to have them reflect events and/or circumstances occurring
    after the time of this presentation.
    Be it emphasized that the information provided in slide no. 4 about the Company's estimates regarding the expected loss of revenues from its commercial
    properties following the COVID-19 crisis constitutes forward-looking information as defined in the Securities Law. This information is based, among others, on
    Company assessments and estimates as of this presentation's issue date with respect to factors it has no influence over. These assessments and estimates might
    not materialize or might materialize in a substantially different way, due to factors outside the Company's control, including: the coronavirus's rate of spread;
    the duration of the crisis and the scope of directives and limitations imposed by authorities in Israel and around the world; the magnitude and duration of the
    economic slowdown that might develop in Israel and around the world, which might entail substantial implications for the Company's tenants and the Company,
    all this bearing in mind that the COVID-19 crisis is a dynamic event characterized by great uncertainty. For further details on the Company's estimates regarding the
    effects of coronavirus on the Company, see section 5.1 of Chapter A in the Company's periodic report for 2019 and section 1.1 of the report by the Company's Board
    of Directors of 30 June 2020, as published on 13 August 2020.
    This presentation does not constitute, and shall not be construed as, an offer to the public or an invitation to the public to buy Company securities or an invitation to receive such
    offers, and is solely intended for informative purposes. The content of this presentation does not constitute a recommendation or an opinion or a substitute for investor discretion,
    nor does it pretend to cover all the information that might be relevant for making any kind of investment decision regarding the Company's securities. The information in this
    presentation is a summary and does not serve to substitute the complete information about the Company as provided in its periodic, quarterly and immediate reports.
    This presentation does not substitute the financial statements which include the full financial information.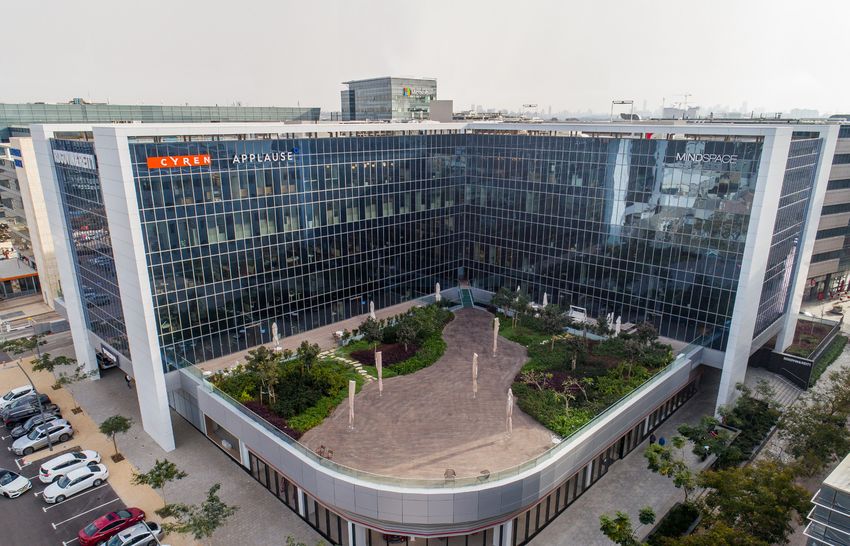
3

                                                                                           OVERVIEW
          ESTABLISHMENT                                                                                       STOCK EXCHANGE
          Established in 2006 as Israel’s first Real Estate                                                   Traded at TASE since 2006
          Investment Trust                                                                                    Included in the following indices: TA 125, TA Real Estate,
                                                                                                              Tel Div and Tel Bond 40

          INCOME PRODUCING PROPERTIES
          Total assets' value NIS 5.5 billion                                                                 RATING
          548,000 sqm, 97.3% occupancy rate                                                                   ilAA/Stable
                                                                                                              by Ma’alot S&P

          CAP RATE                                                                                            DIVIDENDS
          Weighted average cap rate of properties is 6.83%
                                                                                                              Quarterly dividend distribution policy

          EQUITY
                                                                                                              Minimum dividend for 2020: NIS 128 million (NIS 0.72 per share*)
                                                                                                              Dividend yield of 5.6%**
          Financially resilient, total equity - NIS 2.6 billion                                               Dividends distributed since inception total
          (NIS 14.79 per share)                                                                               NIS 890 million (NIS 7 per share)

                                                                                                              ADJUSTED FFO YIELD
                                                                                                              Projected for 2020 – 10.5%**
    *According to the number of shares on the resolution date and is subject to board of directors’ approval prior to each distribution
    **Dividend and FFO yields are relative to the share price as of august 11, 2020.
    - Based on expanded consolidated data In NIS millions, unless stated otherwise.
4

                                                                                          Covid-19
    To the best of the Company's estimate at this point in time:
    - Retail (23% of the portfolio). mainly comprises power centers, which took less of a hit after the lockdown was lifted. During the lockdown period,
      30% of retail portfolio consisting of essential businesses such as supermarkets stayed open. Revenue losses of NIS 6 million in rent waivers granted
      in the second quarter of 2020.
    - Office, industrial, logistics and nursing-homes (73% of the portfolio). Rent deferrals totaling about NIS 10 million were mainly granted. As of now,
      about NIS 6 million were collected. Rent waivers amounted to NIS 1 million in the second quarter. According to the Company's estimates, these
      sectors are not expected to cause substantial losses. Still, the forecast for 2020 includes potential future loss of approximately NIS 5 million due to
      business difficulties for tenants and delays in letting spaces.
    - parking facilities (4% of the portfolio), the loss of revenue in 2020 is estimated at NIS 8 million, mainly due to lower public-use (NIS 3 million of that
      loss has materialized during the report period).
    - At this point in time, the rent collection rate is high, as in the months preceding the crisis.
    - A decrease in properties’ value of NIS 76 million in the first half of 2020, NIS 58 million in the second quarter, mainly due to an expected hit to short-
      term cash flows.
    - From the start of the year to the time of this report, roughly 70 leases were signed for a total GLA of 24,000 sqm, representing an annual rent of
      NIS 14 million. In addition, around 100 extensions were signed for a total GLA of 53,000 sqm, are expected to yield rent of NIS 34 million per year (a
      2% average real growth in rent).

    As of now, and in view of the fact that this is a dynamic event characterized by considerable uncertainty, how much the crisis will affect the Company's future activity and results largely depends on
    the extent to which various variables will materialize in Israel and globally, if at all.
5

                       FINANCIAL STRENGTH AMID THE COVID-19 CRISIS

                                             Low leverage ratio
                                           compared to the industry                     Good access
                                           50% equity to                                 to capital market
                                            total assets                                  and bank credit

                  Rating                                              High level of                           Diversified asset
          AA/Stable*                                                  cash balances
                                                                       & credit lines
                                                                                                              portfolio, mostly
                                                                                                             pledge-free
                 S&P Ma'alot
                                               Low                                      Long duration debt
                                              maturity                                   compared to the
                                               volume in the                                 industry
                                               coming years                              5.5 years

    * Rating confirmed on 4 August 2020.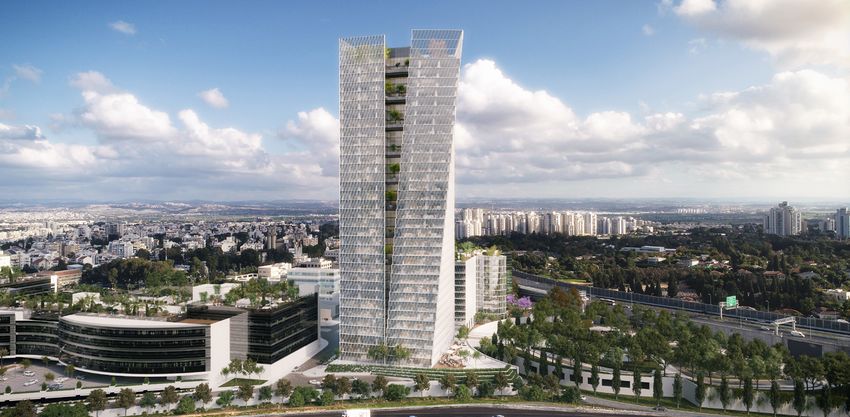
6

            DIVERSIFIED PORTFOLIO ACROSS SECTORS & GEOGRAPHIES

    61%
              56%

                              30%
                                         23%
                                                7% 11%
                                                                        6%       2%        4%
     2011      2020            2011      2020   2011     2020   2011    2020     2011     2020
          Office                    Retail       Industrial &   Nursing homes   Parking facilities
                                                   logistics
    As of 30.6.2020, according to fair value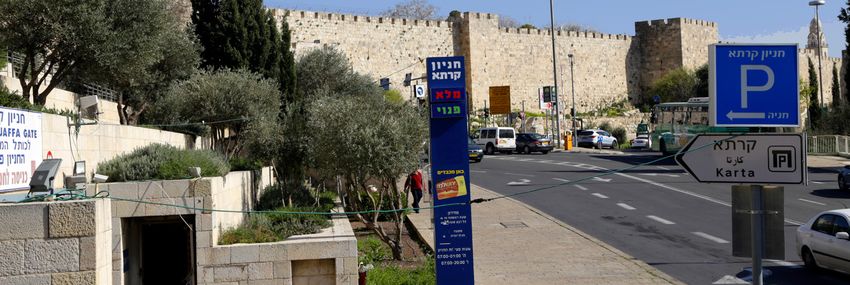
7

          STABLE STRATEGY UNDER A PROFFESIONAL MANAGER'S EXPERTISE

    GROWTH STRATEGY:                               SUBJECT TO PROVISIONS OF
    -   Only in Israel                             THE REIT ISRAELI LAW:
    -   Diversified market sectors & Geographies   -   Maximum leverage of up to 60% (LTV)
                                                   -   Development activity limited to 5% of
                                                       its portfolio
                                                   -   No controlling shareholders
                                                   -   Dividend distribution requirement
                                                   -   Exemption from corporate tax
                                                   -   Single level taxation - paid only by the
                                                       shareholders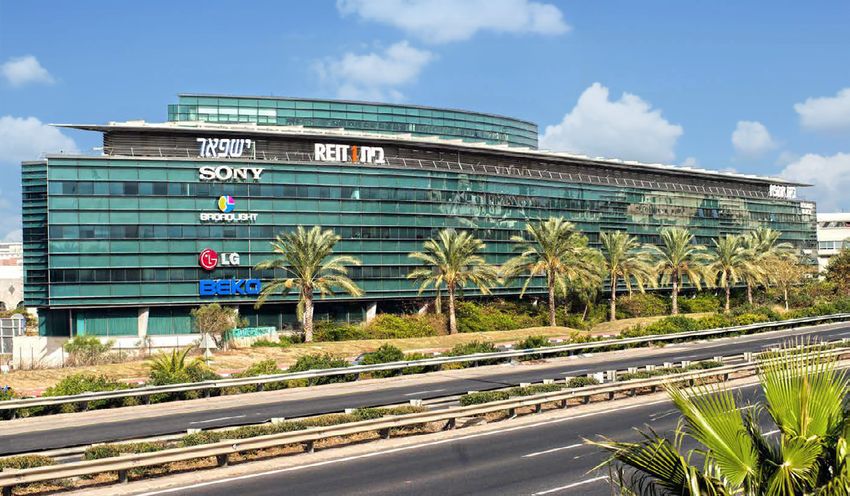
8

    DIVERSIFIED               PORTFOLIO
    Office, retail, nursing homes, industrial & logistics and parking
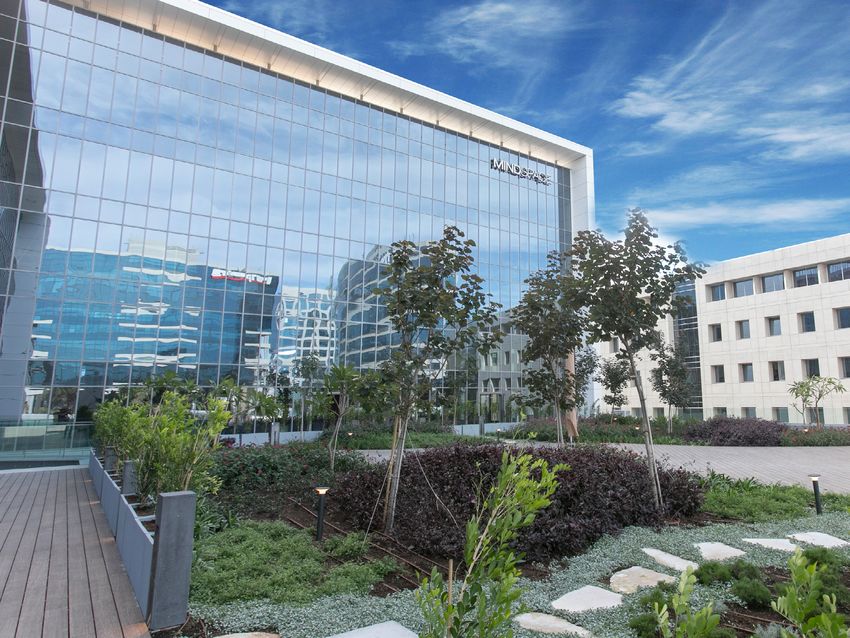
9        Diversified properties | OFFICE

    COMING SOON INFINITY PARK 2022 RAANANA
                                                                                                                                                                      150,000 sqm* OF
                                                                                                                                                                       OFFICE SPACE

                                                                                                                                                                 10,000 sqm OF RETAIL &
                                                                                                                                                                 RECREATIONAL AREAS

                                                                                                                                                                    PUBLIC PARK AND
                                                                                                                                                                       GARDENS

                                                                                                                                                                  HIGH ACCESSIBILITY
                                                                                                                                                                 TO TEL AVIV VIA RAILWAY
                                                                                                                                                                     AND HIGHWAYS

    * Currently 90,000 sqm, 60% company's share
    - Forward-looking information is based solely on the subjective evaluation of the Company. The realization of the forward-looking information will be affected, inter alia, by factors that are not
    under the Company’s control.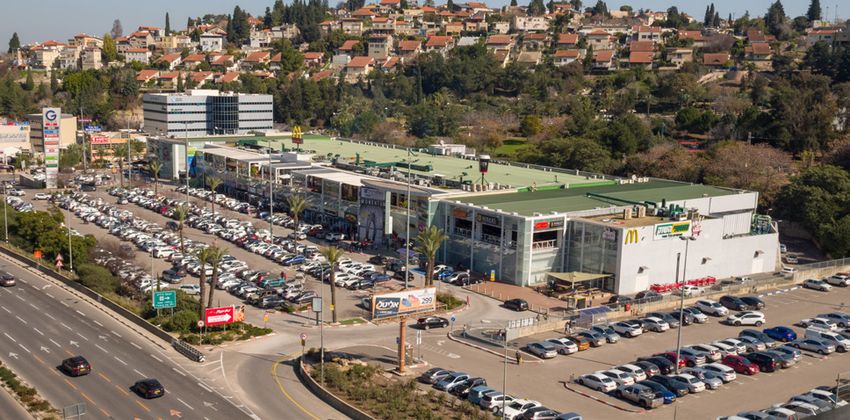
10

HAMENOFIM, HERZLIYA PITUACH
GLA: 17,000 sqm
Ownership share: 50%
11    Diversified properties | OFFICE

            Daniel Frish, TLV              Hayovel Tower, TLV      Rothschild, TLV              Ha’arba’ah, TLV
              GLA: 20,000 sqm                GLA: 67,000 sqm        GLA: 23,000 sqm               GLA: 17,000 sqm
     Ownership share: 40% (parking 100%)   Ownership share: 50%   Ownership share: 50%   Ownership share: 35% (parking 50%)
12 Diversified properties | OFFICE
GLA: 7,500 sqm
Sapir, Herzliya Pituach Ownership share: 100%
Hashmonaim, TLV
GLA: 17,000 sqm
Business Park, Rishon LeZion East Ownership share: 100%
GLA: 8,000 sqm
Ownership share: 60%13 Diversified properties | OFFICE
GLA: 10,000 sqm GLA: 5,000 sqm
Ramat Hachayal, TLV Ownership share: 50% Ramat Hachayal, TLV Ownership share: 100%
GLA: 6,000 sqm GLA: 8,000 sqm
Business Park, Netanya Ownership share: 100% Efal, Petach Tikva Ownership share: 65%14 Diversified properties | OFFICE
GLA: 8,000 sqm GLA: 8,000 sqm
Beit Terminal, Lod Ownership share: 100% Rosh Ha’ayin Ownership share: 100%
GLA: 16,000 sqm GLA: 21,000 sqm
Hamelacha, Lod Ownership share: 100% Global Park, Lod Ownership share: 50%15 Diversified properties | RETAIL
Power Center, Afula
GLA: 22,000 sqm
Ownership share: 60%16 Diversified properties | RETAIL
GLA: 15,000 sqm GLA: 12,400 sqm
“Lev Talpiyot” strip Mall, Jerusalem Ownership share: 100% “Hadera Gates” strip Mall, Hadera Ownership share: 100%
GLA: 6,200 sqm GLA: 14,000 sqm
Sarona Gardens, TLV Ownership share: 50% Power Center, Netivot Ownership share: 100%17 Diversified properties | RETAIL
GLA: 16,000 sqm GLA: 14,000 sqm
G6 Mall, Yokneam Ownership share: 49% Gan Yavneh strip Mall Ownership share: 75%
GLA: 8,500 sqm retail and 4,500 sqm office GLA: 11,000 sqm
G Rothschild Mall, Rishon LeZion Ownership share: 49% Power Center, Modi’in Ownership share: 50%18 Diversified properties | NURSING HOMES
GLA: 19,000 sqm
Nes Tziona Ownership share: 80%
GLA: 12,000 sqm GLA: 22,000 sqm
Ashdod Ownership share: 100% Nesher Ownership share: 50%19 Diversified properties | INDUSTRIAL & LOGISTICS
GLA: 44,000 sqm GLA: 20,000 sqm
Teradion, Gush Segev Ownership share: 100% Rishon LeZion Ownership share: 65%
GLA: 42,000 sqm GLA: 40,000 sqm
Alon Tabor Ownership share: 50% Alon Tabor Ownership share: 25%20 Diversified properties | INDUSTRIAL & LOGISTICS
GLA: 7,000 sqm GLA: 25,000 sqm
Hadera Ownership share: 95% Teradion & Sderot Ownership share: 100%
GLA: 9,600 sqm GLA: 16,000 sqm
Tziporit Ownership share: 67% Bar-Lev Ownership share: 67%21 Diversified properties | PARKING
Besser 3+4 Parking Lot, Bnei Braq City Tower Parking Lot, Ramat-Gan
Approx. 277 parking spaces | Ownership share: 100% Approx. 400 parking spaces | Ownership share: 100%
Karta Parking Lot, Jerusalem
Approx. 835 parking spaces | Ownership share: 100%22
FINANCIAL
For 30.6.2020
DATA23
FINANCIAL DATA | Highlights
% Change 1-6/2020 1-6/2019 % Change Q2 - 2020 Q2 - 2019 2019
2019-2020 2019-2020
NOI 2.5% 165.9 161.9 )6.7%( 79.5 85.2 341.9
NOI same property )6.3%( 142.1 151.6 )11%( 69 77.5 -
Adjusted FFO )1.3%( 117.9 119.4 )9.7%( 57 63.1 249.9
Adjusted FFO per
)1.5%( 0.66 0.67 )8.6%( 0.32 0.35 1.40
share (NIS)
* Note that the hit to the NOI and the FFO, resulting from rent waivers totaling NIS 7 million given by the Company in the second quarter of 2020 following the
COVID-19 crisis, was fully recognized in this quarter's statements.
- In NIS millions, unless stated otherwise
- Data based on the Company's expanded consolidated statements24
FINANCIAL DATA | NOI Growth
NIS M’s
350 342 330-340
300
301
273
250 240
219
200 177 186
162 166
150
149
127
100
50
0
2011 2012 2013 2014 2015 2016 2017 2018 2019 * 2020 30.6.2019 30.6.2020
Forecast
* As opposed to 355-360 in the pre-COVID-19 forecast
- NOI – Net Operating Income – is the industry’s accepted profitability measurement for the leasing and operation of properties (revenues from properties minus their operating expenses)
- Based on expanded consolidated data25
FINANCIAL DATA | Adjusted FFO Growth
NIS M’s
250 250 235-245
224
200
199
170
157
150
128 119 118
111
100 83
69
50
0
2011 2012 2013 2014 2015 2016 2017 2018 2019 * 2020 30.6.2019 30.6.2020
Forecast
* As opposed to 260-264 in the pre-COVID-19 forecast
- Adjusted FFO – Funds from Operations – is the industry’s accepted measurement, expressing net income after neutralizing one-off revenues and expenses, as well as properties
revaluation and CPI linkage expenses accrued on loans.
- Based on expanded consolidated data In NIS millions, unless stated otherwise.26
FINANCIAL DATA | Per Share Results
Agorot per share
[NIS 0.01]
140
140
132-137
Per share adjusted FFO
129
120 Per share dividend
Equity/Total assets
119
Equity/Total assets
100 100%
103
98
89
89
80
85
76
72 *
72 *
68
60
67
66
64
59
50%
55.5
52
51%
50
50%
50%
40
49%
49%
49%
49%
48
47
48%
46
46%
43%
41%
34
36
20
0
2011 2012 2013 2014 2015 2016 2017 2018 2019 ** 2020 30.6.2019 30.6.2020
Forecast
*According to the number of shares on the resolution date and is subject to board of directors’ approval prior to each distribution
** As opposed to 146-148 in the pre-COVID-19 forecast27
FINANCIAL STRENGTH
- Equity to total assets of 50% (IFRS) - All assets
Free of pledges (total NIS 5.5 billion)*
- Net financial debt to Cap 48% (Solo)
- cash and cash equivalents
- Weighted average cost of long-term debt NIS 190 million as of report's issue date (Solo)
As of 30.6.2020 – 2% linked to the israeli CPI.
- Signed credit facilities
Average weighted Duration of 5.5 years
NIS 360 million non utilized
- Current cost of debt as of Report’s issue as of Report’s issue date (Solo)
date - 0.91% linked to the israeli CPI - Credit rating
(Series F bonds, duration 6.7 as of 11.8.2020)
July 2017: ilAA/Stable
July 2014: ilAA-/Stable
June 2010: ilA+/Stable
May 2007: ilA/Stable
Based on expanded consolidated data unless otherwise stated
*Except for 14% of assets which are jointly owned28
WELL-BALANCED DEBT MATURITY PROFILE
NIS in millions
350
300
Forecasted adjusted FFO for 2020 –
250 NIS 235-245 million*
200 Series C bonds
Series D bonds
Series E bonds
150 Series F bonds
Associates debt **
100
50
0
2020 2021 2022 2023 2024 2025 2026 2027 2028 2029 2030 2031
* Before dividend distribution required by law. Includes current annual amortization of bond premium.
** Amount is calculated based on the Company's percentage ownership interest in associates29
CAP RATE OF PROPERTIES VS. WEIGHTED AVERAGE COST OF DEBT
9%
8% 8% 7.85%
8% 7.52% 7.52% 7.46% 7.29% 6.95%
6.83%
7%
6%
4.2 %
4.8
5%
4%
%
5.9%
3% 3.82%
3.46% 3.33%
2.87% 2.57%
2%
2.15% 2.11% 2.0%
1.97%
1%
0.91%
0%
2012 2013 2014 2015 2016 2017 2018 2019 30.6.2020
IFRS based average cap rate deduced from Company’s income producing properties
Weighted effective israeli CPI linked cost of debt (bonds)
Israeli CPI linked current cost of debt as of 11.8.20 (Series F bonds average duration 6.7)30
THANK YOUYou can also read