Comparison of the analytical performance of the PATHFAST high sensitivity cardiac troponin I using fresh whole blood vs. fresh plasma samples - De ...
←
→
Page content transcription
If your browser does not render page correctly, please read the page content below

Clin Chem Lab Med 2021; 59(9): 1579–1584

Vinajak Gopi, Barbara Milles, Eberhard Spanuth, Matthias Müller-Hennessen, Moritz Biener,
Kiril Stoyanov, Norbert Frey and Evangelos Giannitsis*

Comparison of the analytical performance of the
PATHFAST high sensitivity cardiac troponin I
using fresh whole blood vs. fresh plasma samples
https://doi.org/10.1515/cclm-2021-0354                                and normal plasma and whole blood results. Precision
Received March 24, 2021; accepted May 25, 2021;                       evaluation according to CLSI ep 15 revealed comparable
published online June 7, 2021                                         coefficients of variation (CV) in whole blood and plasma.
                                                                      The discriminatory ability of baseline hs-cTnT, plasma and
Abstract
                                                                      whole blood hs-cTnI was excellent (AUC 0.967, AUC 0.954
                                                                      and AUC 0.953) without significant difference.
Objectives: The PATHFAST hs-cTnI (high-sensitivity car-
                                                                      Conclusions: Whole blood can be used interchangeably
diac troponin) assay is the first point-of-care assay with a
                                                                      with plasma for more convenient and less time and labor-
high-sensitivity designation that received FDA approval for
                                                                      consuming testing of hs-cTnI on the PATHFAST
diagnosis of myocardial infarction (MI). Testing from
                                                                      instrument.
whole blood does not need centrifugation and therefore is
faster and more convenient in the emergency room instead              Keywords: high-sensitivity; method comparison; plasma;
of plasma. However, there is sparse evidence whether                  point-of-care; troponin; whole blood.
point-of-care testing of Tn from whole blood is as reliable
as from plasma samples.
Methods: We investigated the agreement between plasma
                                                                      Introduction
and whole blood hs-cTnI by using the PATHFAST hs-cTnI
assay. Hs-cTnT measured on Cobas 602 in the central lab-
                                                                      Point-of-care (POC) cardiac troponin (cTn) assays are rec-
oratory and compared to a final diagnosis of NSTEMI using
                                                                      ommended when the central laboratory is unable to pro-
serial hs-cTnT served as reference. We assessed biases,
                                                                      vide laboratory results timely to the emergency department
limits of agreement (±1.96 SD) and coefficients of correla-
                                                                      (ED), or when central laboratory cTn measurements are
tion, and tested the discriminatory ability of the baseline
                                                                      temporarily or permanently not available [1]. The high
sample of plasma and whole blood hs-cTnI and plasma hs-
                                                                      number of patients admitted with unspecific chest pain or
cTnT to discriminate non-ST-segment elevation myocar-
                                                                      dyspnea of unknown etiology prompts the need to shorten
dial infarction (NSTEMI).
                                                                      the time to diagnosis, and the length of stay in order to
Results: A total of 224 paired fresh samples were collected
                                                                      decongest overcrowded EDs [2].
simultaneously from 191 patients presenting with suspected
                                                                           However, until recently POC cTn assays did not meet the
acute coronary syndrome. There was an excellent correla-
                                                                      International Federation of Clinical Chemistry and Labora-
tion between plasma and whole blood hs-cTnI (r=0.99), and
                                                                      tory Medicine Task Force on Clinical Applications of Bio-
a very good inter-rater agreement (k=0.93) between elevated
                                                                      Markers (IFCC TF-CB) criteria required for a high sensitivity
                                                                      designation [3], and therefore POC cTn assays were only
                                                                      cleared by the Federal Drug Administration (FDA) as an aid
Vinajak Gopi and Barbara Milles contributed equally to this work.     to rule-in an MI but were unable to safely rule-out an MI due
                                                                      to inappropriately low analytical sensitivities. Among the
*Corresponding author: Prof. Evangelos Giannitsis, Department of
Cardiology, Angiology and Pulmonology, Heidelberg University
                                                                      increasing number of POC tests that achieve a comparable
Hospital, Im Neuenheimer Feld 410, 69120 Heidelberg, Germany,         analytical sensitivity and precision like central laboratory
Phone: +49 6221 568670, Fax: +49 6221 565516,                         instruments [4–7], the PATHFAST hs-cTnI (high-sensitivity
E-mail: evangelos.giannitsis@med.uni-heidelberg.de                    cardiac troponin) assay (LSI Mediance, Japan) was the first
Vinajak Gopi, Barbara Milles, Matthias Müller-Hennessen, Moritz       instrument and assay that was cleared by the FDA [8, 9].
Biener, Kiril Stoyanov and Norbert Frey, Department of Cardiology,
                                                                           Using validated thresholds and concentration
Angiology and Pulmonology, Heidelberg University Hospital,
Heidelberg, Germany                                                   changes, PATHFAST hs-cTnI allows a similar diagnostic
Eberhard Spanuth, DIAneering GmbH, Heidelberg, Germany                performance for rule-in and rule-out of MI using the

  Open Access. © 2021 Vinajak Gopi et al., published by De Gruyter.    This work is licensed under the Creative Commons Attribution 4.0
International License.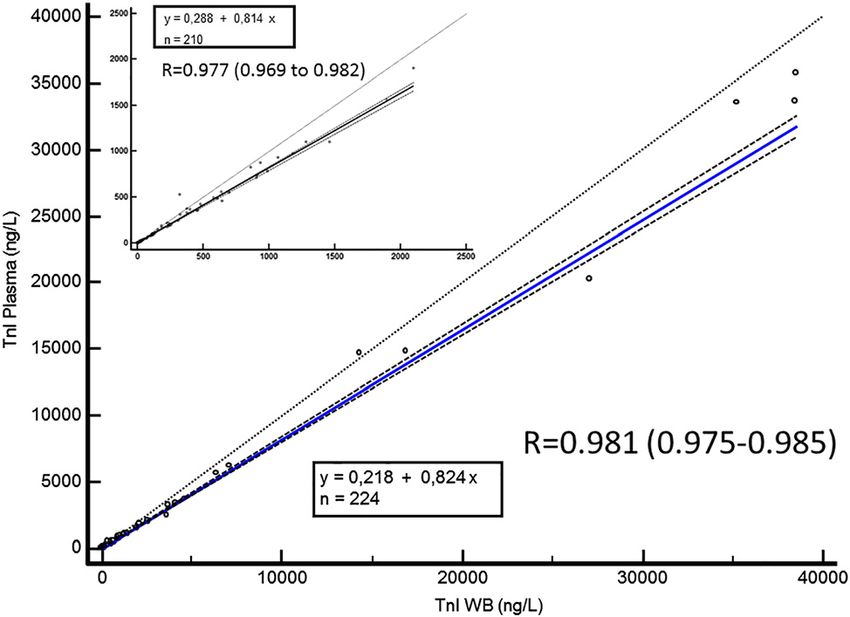
1580 Gopi et al.: Troponin I fresh whole blood versus fresh plasma
ESC 0/1 h protocol like the Abbott Architect hs-cTnI assay fourth definition of myocardial infarction [10]. The final diagnosis of
[5]. However, until now, the clinical performance of all patient conditions was adjudicated by two trained cardiologists
(MM, MB) independently. In cases of disagreement, a third cardiolo-
PATHFAST hs-cTnI was evaluated under optimal experi-
gist (EG) reviewed the case.
mental conditions by testing batch-wise from frozen
plasma aliquots, and not from fresh whole blood specimen.
According to experience, the main application in prac- POC device, principle of analysis and analytical
tice in the emergency department is POC testing from whole performance
blood. Therefore, the aim of the present study was to
compare hs-cTnI concentrations measured immediately All measurements hs-cTn assays were performed from fresh bioma-
from fresh plasma and whole blood directly, and to evaluate terial during routine measurements at the central laboratory of the
University of Heidelberg for hs-cTnT, and in the research laboratory for
the clinical performance compared to an adjudicated diag-
cardiac biomarkers in the Department of Cardiology for hs-cTnI. The
nosis based on the Roche hs-cTnT central laboratory assay. limit of detection (LoD) of hs-cTnT on the Cobas 602 is 3.0 ng/L, and
the 99th percentile has been described at 14 ng/L in a multicentric
reference study [11]. The lowest concentration with a CV less than or
Materials and methods equal to 10 % (Limit of Quantitation) with the Roche hs-cTnT assay was
13 ng/L [12]. In an appropriately sized reference study of 626–740
We enrolled 191 patients with suspected ACS presenting to the ED of healthy individuals, the rate of detectable hs-cTnT was 81.4–83.3%
the University hospital of Heidelberg between January 28th, 2020 and and 96.5–96.9% in females and males, respectively [13].
August 28th, 2020. All samples were collected prospectively and The PATHFAST hs-cTnI utilizes a chemiluminescent enzyme
simultaneously. Patients with ST segment elevation MI (STEMI) were immunoassay (CLEIA) and a magnetic particle separation method that
not excluded for comparison of plasma and whole blood concentra- handles target substances only (MAGTRATION® technology) to
tions but were excluded for assessment of clinical performance. Be- quantitatively measure the cTnI concentration in Li-heparin,
sides STEMI, only patients with end-stage renal disease on Na-heparin, or EDTA-K2 whole blood or plasma. Alkaline phospha-
hemodialysis were excluded. tase labeled monoclonal antibody and anti-cTnI monoclonal antibody
coated magnetic particles are mixed with the sample. cTnI containing
specimen binds to anti-cTnI antbodies forming immune-complexes
Gold standard diagnosis with enzyme labeled antibodies and antibodies coated with magnetic
particles. After removing the unbound enzyme labeled antibodies
A standard electrocardiogram was collected at admission and was from the reaction mixture a chemiluminescent substrate is added.
interpreted by trained medical staff. cTn was routinely measured on After incubation the luminescence by the enzyme reaction is detected.
admission and after 1 h, and at later time-points whenever the diag- The intensity of measured luminescence is proportional to the cTnI
nosis was equivocal based on the 0/1 h results. Measurements were concentration of the sample. The limit of blank (LoB) was determined
performed in the central laboratory of the University hospital using the in accordance with CLSI guideline EP 17 by measuring 60 blank
Roche hs-cTnT assay using heparin plasma, measured on a Cobas 602 samples and calculating the mean and standard deviation (SD) ac-
instrument (Elecsys® troponin T high-sensitive, Roche Diagnostics). A cording to the following: LoB = mean + 1.645 × SD.
study-specific blood draw for the additional measurement of hs-cTnI The mean was −0.916 ng/L and SD was 1.30. LoB = −0.916 +
was routinely collected at baseline at the same time point with the hs- (1.645 × 1.30) = 1.223 ng/L.
cTnT measurement, and sporadically after 1 h. The final diagnosis was For LoD calculation, the pooled SD was 0.673 ng/L and with the
based on the serial hs-cTnT results and on all available clinical and equation LoD = LoB + (1.645 × SD) LoD = 1.223 + (1.645 × 0.673) = 2.33 ng/L.
imaging results, invasive coronary angiogram, electrocardiogram and According to the manufacturer, the test-specific LoD measured in
routine laboratory testing. In particular, the diagnosis of a non-ST plasma is 2.33 ng/L, the sex-independent overall 99th percentile are
segment myocardial infarction (NSTEMI) was made according to the 28 ng/L (90% CI, 20–30) (20 ng/L (90% CI, 13–30) in 352 women and
30 ng/L (90% CI, 21–37) in 382 men) with a coefficient of variation of 10%
or less at 11.0 ng/L. The measurable number of healthy subjects between
Table : Inter-rater agreement between elevated hs-cTnI in plasma LoD and 99th percentile was 487 (66.3%) from 734 healthy subjects [9].
and whole blood. Another cohort of more than 300 males and 300 females yielded a sex-
independent 99th percentile of 24.2 ng/L (95% CI, 17.6–27.4) overall,
Elev hs-cTnI whole blood Elev hs-cTnI plasma Total number 21.1 ng/L (95% CI, 13.4–25.3) in females and 27.0 ng/L (95% CI, 18.5–27.7)
>. ng/L >. ng/L in men. The limit of quantitation (LoQ) at 20% CV is 4 ng/L and at 10%
CV 15 ng/L [5]. All results were obtained from plasma samples.
No Yes
No
Yes Method comparison of hs-cTnI between whole blood and
Total number plasma
The comparison yields a Cohen’s Kappa of kappa=. (% CI:
.–.) which indicates a very good agreement (>.) between Concentrations of hs-cTnI were measured with the PATHFAST hs-cTnI
methods. assay. The EDTA whole blood samples were drawn at presentation inGopi et al.: Troponin I fresh whole blood versus fresh plasma 1581
all patients. The collection tubes containing whole blood were sent
immediately to the research laboratory.
Results
After mixing gently the collection tube, 0.1 mL of whole blood
was separated into a sample well of a cartridge. After loading the Patients characteristics
cartridge, the PATHFAST hs-cTnI assay was started. If necessary,
six cartridges could be measured in parallel. During the measure- We collected 318 paired samples from 191 patients. The
ment of the whole blood sample (duration approx. 17 min) the mean age was 63.7 ± 16.6 years, and 105 participants
remaining whole blood was processed into plasma by 10 min
(55.9%) were male. Among the 318 collected paired sam-
centrifugation at 2,000 g. After separation of the plasma, 0.1 mL
were dispensed into a sample well of a cartridge. After loading the ples, 94 had to be excluded due to missing values or con-
cartridge, the measurement was started. This procedure ensured the centrations below the LoD for either plasma or whole blood
smallest possible time difference between whole blood and plasma hs-cTnI or for hs-cTnT.
measurement. The final diagnosis was NSTEMI in 52 patients (27.7%),
Besides these procedure the precision of the PATHFAST hs-cTnI
unstable angina in 15 (8.0%), and non-cardiac chest pain in
assay was determined in parallel from whole blood and plasma at
different concentrations and on different days.
59 cases (31.4%). Patients with NSTEMI were significantly
older (68 years ± 16.5 vs. 62.0 years ± 16.4; p=0.02), with
significantly more males than females (n=36 (69.2%) vs.
Clinical performance of plasma and whole blood n=16 (30.8%), p=0.023). Rule-in diagnoses other than
compared to the reference based on serial hs-cTnT NSTEMI included pulmonary embolism, myocarditis, Tako
Tsubo Cardiomyopathy.
The results of the POC assay were compared with the Roche hs-cTnT
assay on a Cobas 602 which served as the reference laboratory-
based method. All measurements hs-cTn assays were performed
from fresh biomaterial during routine measurements at the central
Method comparison between plasma and
laboratory of the University of Heidelberg for hs-cTnT. The study whole blood
protocol was approved by the local Ethical Committee of the Uni-
versity of Heidelberg, and all patients provided written informed Of 318 paired samples, 94 samples were not eligible due to
consent.
missing information on hs-cTnI, or hs-cTnI values below the
LoD of 2.33 ng/L, thus disqualifying the complete sample set
Statistical methods for method comparison. The remaining 224 sample pairs
covering the concentration range 2.34–35.77 ng/L in plasma
Continuous variables were tested for normal distribution using the were used for method comparison.
Kolmogorov-Smirnov test, and were presented either as means with The Passing-Bablok regression equation between
standard deviations or 95% confidence intervals (CI), or as medians whole blood and plasma hs-cTnI on the PATHFAST ana-
with interquartile range.
lyser showed a linear correlation (Figure 1) described by the
Method comparison between plasma and whole blood was
following equation:
calculated using the non-parametric Passing-Bablok regression [14].
Results are displayed as a scatter diagram and regression line. The y = 0.218 + 0.824 x
slope B and intercept A were calculated with their 95% confidence
interval. A Bland-Altman plot was used to compare plasma and whole (y = hs‐cTnI plasma, x = hs‐cTnI whole blood) .
blood measurements in order to detect the presence of a systematic
bias, and to identify possible outliers across a representative con- Overall, the comparison between whole blood and plasma
centration range. The limits of agreement (LoA) were defined as the for hs-cTnI yielded a correlation coefficient (r) of 0.99
mean difference plus and minus 1.96 times the standard deviation of
(Figure 2). The bias measured for whole blood vs. plasma
the differences.
The areas under the receiver-operating characteristic curves were
for hs-cTnI, were between +52 and −82%, respectively
constructed for discrimination of the final diagnosis of NSTEMI and (Figure 3).
compared for baseline plasma and whole blood hs-cTnI and baseline In the Bland Altman plot (Figure 3), the limits of
hs-cTnT on the central laboratory analyser as recommended by agreement (LoA) did not exceed the maximum allowed
DeLong et al. The inter-rater agreement between plasma and whole difference of 90% between methods (Δ). As such, results
blood samples above and below the 99th percentile values were
from plasma and whole blood were considered to be in
calculated using statistic Kappa (κ) and weighted Kappa according to
Cohen. agreement, indicating that they can be used interchange-
All analyses were performed with Medcalc 17.6 (MedCalc Soft- ably. There was no systematic bias toward one method
ware, Ostend, Belgium). across the tested concentration range.1582 Gopi et al.: Troponin I fresh whole blood versus fresh plasma
Figure 1: Passing-Bablok regression.
Calculation was executed on 224 paired plasma and whole blood hs-
cTnI samples. The intercept is 0.218 and the slope is 0.824. The Figure 3: Bland Altman diagram.
dotted line denotes the line of equality. The blue line denotes the The dotted lines denote the limit of agreement within 1.96 standard
regression line with corresponding 95% confidence intervals. A deviation and corresponding 95% confidence intervals. The straight
second Passing-Bablok regression showing the regression of line denotes the maximum allowed difference (90%) between
samples within the concentration range of 0–2,500 ng/L was added methods (Δ). The limits of agreement (LoA) did not exceed the
as an insert. The intercept of this regression is 0.288 and the slope is maximum allowed difference between methods.
0.814. The correlation coefficient is r=0.977 (95% CI: 0.969–0.982).
Figure 2: Spearman rank correlation with corresponding 95%
confidence intervals between log transformed hs-cTnI in plasma and
whole blood.
Inter-rater agreement between elevated and normal Figure 4: Receiver operating curve characteristics regarding
plasma and whole blood hs-cTnI based on the general 99th performance of baseline hs-cTn measured with hs-cTnT, plasma hs-
percentile URL (24.2 ng/L) yielded a weighted Cohen´s cTnI and whole blood hs-cTnI.
The location of the respective 99th percentile values is marked on
Kappa of 0.93 (95% CI: 0.89–0.98) which indicates a very
the ROC curve.
good agreement (>0.90) between methods (see Table 1).
Precision evaluation of whole blood and plasma ac-
cording to CLSI ep 15 was performed by serial measure- 17.7 and 5.2% between mean concentrations of 3.8 and
ments in parallel in whole blood and plasma on four 16.4 ng/L (Figure 4). Of particular note is the finding that
different days with different cTnI concentrations by using higher precision was measured in whole blood than in
suitable selected patient samples. Whole blood CVs were plasma.Gopi et al.: Troponin I fresh whole blood versus fresh plasma 1583
We report several important findings. First, the correla-
tion between whole blood and plasma hs-cTnI is almost
linear across the entire range of measurable concentra-
tions. Second, although a bias between sample types ex-
ists, this bias did not exceed the maximum allowed
difference between methods, and there was no systematic
bias between plasma and whole blood suggesting that
plasma and whole blood can be used interchangeably
across a wide spectrum of hs-cTnI concentrations. Third,
the inter-rater agreement between whole blood and
plasma above or below the 99th percentile URL yields a
weighted Cohen´s Kappa of 0.93 which has to be inter-
preted as very good.
Figure 5: Imprecision profile of plasma and whole blood hs-cTnI in
parallel by serial measurement according to CLSI ep 15 in four
Fourth, we compared the diagnostic performance of
different patient samples on four different days (blue: plasma; yel- the initial blood sample on admission of hs-cTnI in plasma
low: whole blood). and whole blood with hs-cTnT to discriminate a final
diagnosis of NSTEMI based on serial hs-cTnT. The ROC
Discriminatory ability of hs-cTnI vs. hs-cTnT analysis showed excellent performance of all three tests
at presentation for discrimination of NSTEMI with AUC between 0.953 and 0.967, without a significant
difference. This finding confirms and corroborates recent
The diagnostic accuracy of measurements obtained at pre- findings on the excellent clinical performance for the
sentation, quantified by AUC was 0.954 (95% CI: 0.914–0.979) diagnosis of MI by the use of PATHFAST hs-cTnI as POCT [5,
for plasma hs-cTnI, 0.953 (95% CI: 0.913–0.979) for whole 6, 16]. The PATHFAST hs-cTnI has a validated ESC 0/1 h
blood, and 0.967 (95% CI: 0.930–0.987) for hs-cTnT (Figure 3, protocol for the diagnosis of NSTEMI [5] and has been listed
Figure 5). Pairwise comparison of ROC curves showed no among the available hs-cTnI assays that are being recom-
significant difference between areas (ΔAUC 0.0009, p=0.7 for mended by 2020 ESC Guidelines on NSTE-ACS for fast rule-
whole blood vs plasma hs-cTnI, ΔAUC 0.013 for plasma hs- out and rule-in of NSTEMI [1].
cTnI vs hs-cTnT, p=0.3, ΔAUC 0.013, p=0.3 for whole blood hs-
cTnI vs hs-cTnT).
Limitations
Discussion The sample size of samples with high cTnI concentrations
is low, and the reported results on agreement have to be
Until recently, POC-cTn assays had inferior analytical and verified for the high concentration range. However, assay
clinical performance than central laboratory tests, mostly imprecision of hs-cTn assays is higher in the low concen-
due to the lack of appropriate sensitivity for early and ac- tration range and it is therefore clinically more important to
curate diagnosis of MI. With the development of hs-cTn have congruent values close to the decision limit, i.e. the
assays on POC technologies that show comparable 99th percentile upper limit of normal.
analytical and clinical performance, POCT may emerge as The high areas under ROC curves indicating an excel-
an attractive option in hospitals that have no or only lent discrimination of NSTEMI depend on the selection of
limited access to central laboratory measurements, or do the study population and the pre-test probability for
not meet required turn-around-times between blood draw NSTEMI. A selection bias towards selection of patients with
and reporting [1, 4, 15]. For convenience and in order to higher prevalence of a final NSTEMI diagnosis cannot be
avoid the time-consuming preparation of plasma, the fully excluded. Therefore forthcoming studies are required
ability of a POCT analyser to process whole blood samples to validate the findings of this pilot study in larger unse-
gains importance. Unfortunately, only sparse data are lected populations presenting with chest pain.
available on the performance of whole blood vs. plasma on The findings of this study regarding the performance of
POCT. whole blood vs. plasma are assay specific for the Pathfast
Therefore, our findings are important and corroborate hs-cTnI assay and cannot be generalized to other hs-cTnI
the clinical usefulness of the PATHFAST hs-cTnI assay. assays on POC platforms.1584 Gopi et al.: Troponin I fresh whole blood versus fresh plasma
Conclusions syndrome using rapid algorithms: an observational study. BMJ
Open 2020;10:e041757.
3. Wu AHB, Christenson RH, Greene DN, Jaffe AS, Kavsak PA,
With the Pathfast hs-cTnI assay, whole blood can be used Ordonez-Llanos J, et al. Clinical laboratory practice
interchangeably with plasma for more convenient and less recommendations for the use of cardiac troponin in acute
time and labor-consuming testing of hs-cTnI in the ED. coronary syndrome: expert opinion from the Academy of the
Method comparison suggests an excellent correlation be- American Association for Clinical Chemistry and the task force on
clinical applications of cardiac bio-markers of the International
tween sample types with a small degree of underestimation
Federation of Clinical Chemistry and Laboratory Medicine. Clin
of hs-cTnI concentration when measured by whole blood. Chem 2018;64:645–55.
However, this underestimation and a considerable bias do 4. Collinson PO, Saenger AK, Apple FS, IFCC C-CB. High sensitivity,
not affect agreement of results above or below the relevant contemporary and point-of-care cardiac troponin assays:
99th percentile ULN. In addition, the clinical performance educational aids developed by the IFCC Committee on Clinical
Application of Cardiac Bio-Markers. Clin Chem Lab Med 2019;57:
of whole blood and plasma hs-cTnI is excellent without a
623–32.
difference for discrimination of NSTEMI. 5. Sörensen NA, Neumann JT, Ojeda F, Giannitsis E, Spanuth E,
Blankenberg S, et al. Diagnostic evaluation of a high-sensitivity
troponin I point-of-care assay. Clin Chem 2019;65:1592–601.
Acknowledgments: We thank the study nurses Heidi Dei-
6. Boeddinghaus J, Nestelberger T, Koechlin L, Wussler D, Lopez-
gentasch, Elisabeth Mertz and Amelie Werner for assis- Ayala P, Walter JE, et al. Early diagnosis of myocardial infarction
tance to conduct the laboratory experiments. with point-of-care high-sensitivity cardiac troponin I. J Am Coll
Research funding: None declared. Cardiol 2020;75:1111–24.
Author contributions: All authors have accepted 7. Venge P, van Lippen L, Blaschke S, Christ M, Geier F, Giannitsis E,
responsibility for the entire content of this manuscript et al. Equal clinical performance of a novel point-of-care cardiac
troponin I (cTnI) assay with a commonly used high-sensitivity cTnI
and approved its submission.
assay. Clin Chim Acta 2017;469:119–25.
Competing interests: EG declares honoraria for lectures 8. https://www.accessdata.fda.gov/cdrh_docs/reviews/K100130.
from Daiichi Sankyo, Astra Zeneca, Roche Diagnostics, pdf [Accessed 16 Feb 2020].
Boehringer Ingelheim, Bayer Vital, and BRAHMS GmbH. He 9. Christenson RH, Mullins K, Duh SH. Validation of high-sensitivity
receives research funding from Daiichi Sankyo and Roche performance for a United States Food and Drug Administration
cleared cardiac troponin I assay. Clin Biochem 2018;56:4–10.
Diagnostics. He consults Roche Diagnostics, Astra Zeneca,
10. Thygesen K, Alpert JS, Jaffe AS, Chaitman BR, Bax JJ, Morrow DA,
Bayer Vital, Indorsia, Radiometer, BRAHMS GmbH, et al. Fourth universal definition of myocardial infarction (2018).
Hoffmann-La Roche, and Boehringer Ingelheim. NF Eur Heart J 2019;40:237–69.
received lecture honoraria from AstraZeneca, BayerVital, 11. Saenger AK, Beyrau R, Braun S, Cooray R, Dolci A, Freidank H,
Boehringer Ingelheim and Novartis. ES receives research et al. Multicenter analytical evaluation of a high-sensitivity
funding from Axis Shield Diagnostics, Mitsubishi Chemical troponin T assay. Clin Chim Acta 2011;412:748–54.
12. http://labogids.sintmaria.be/sites/default/files/files/troponin_
Europe, Radiometer, Roche Diagnostics, Saladax Biomedical,
t_hs_2019-02_v8.pdf [Accessed 16 Feb 2020].
Shanghai Kehua Bio-engineering. All other authors state no 13. Giannitsis E, Mueller-Hennessen M, Zeller T, Schuebler A, Aurich
conflict of interest. M, Biener M, et al. Gender-specific reference values for high-
Informed consent: Informed consent was obtained from all sensitivity cardiac troponin T and I in well-phenotyped healthy
individuals included in this study. individuals and validity of high-sensitivity assay designation. Clin
Biochem 2020;78:18–24.
Ethical approval: The local Institutional Review Board has
14. Bablok W, Passing H, Bender R, Schneider B. A general regression
given permission to conduct this study. procedure for method transformation. Application of linear
regression procedures for method comparison studies in clinical
chemistry, part III. J Clin Chem Clin Biochem 1988;26:783–90.
References 15. Apple FS, Fantz CR, Collinson PO. IFCC Committee on Clinical
Application of Cardiac Bio-Markers. Implementation of high-
1. Collet JP, Thiele H, Barbato E, Barthélémy O, Bauersachs J, Bhatt DL, sensitivity and point-of-care cardiac troponin assays into
et al. ESC Guidelines for the management of acute coronary practice: some different thoughts. Clin Chem 2020 Dec 5:
syndromes in patients presenting without persistent ST-segment hvaa264. https://doi.org/10.1093/clinchem/hvaa264 [Epub
elevation. Eur Heart J 2020 Aug 29:ehaa575. https://doi.org/10. ahead of print. PMID: 33279984].
1093/eurheartj/ehaa575 [Epub ahead of print. PMID: 32860058]. 16. Pickering JW, Young JM, George PM, Watson AS, Aldous SJ,
2. Stoyanov KM, Biener M, Hund H, Mueller-Hennessen M, Vafaie M, Troughton RW, et al. Validity of a novel point-of-care troponin
Katus HA, et al. Effects of crowding in the emergency department assay for single-test rule-out of acute myocardial infarction. JAMA
on the diagnosis and management of suspected acute coronary Cardiol 2018;3:1108–12.You can also read