COMPREHENSIVE PLAN - City of Elberton
←
→
Page content transcription
If your browser does not render page correctly, please read the page content below
COMPREHENSIVE PLAN

ADOPTED FEBRUARY 7, 2022

PREPARED BY THE NORTHEAST GEORGIA REGIONAL COMMISSION
Contents

INTRODUCTION						4
Process Overview						5
NEEDS AND OPPORTUNITIES				7
Survey Results / SWOT Analysis				 8
Needs and Opportunities					10
VISION, GOALS, AND POLICIES				14
Vision Statement						15
Goals and Policies						16
LAND USE						18
COMMUNITY WORK PROGRAM				22
APPENDIX						28

Acknowledgements

MAYOR AND CITY COUNCIL

Daniel Graves, Mayor
Carey Butler, Ward 1
Terry Burton, Ward 2
Troy Colquitt, Ward 3
Rick Prince, Ward 4
Kyle Parham, Ward 5

STEERING COMMITTEE
Larry Guest, Previous Mayor
Lanier Dunn, City Manager
Cindy Churney, Clerk & Historic Preservation
Brent Driscoll, Building & Zoning
Kevin Jordan, Fire
Bruce Herring, Housing Authority
Crystal Beebe, Main Street
John Jenkins, DDA/Economic Development

NEGRC STAFF
Eva Kennedy, PGS Division Director
Mark Beatty, Senior Community Planner
Jon McBrayer, GIS Planner
Stephen Jacques, Project Specialist
C      H      A      P     T      E     R      O      N      E

INTRODUCTION
   A Comprehensive Plan is a community’s guide for growth and improvement to
   public services, community resources, local policies, and the built environment.
   The Plan represents the preferred vision for the community’s future and provides
   a tangible list of actions that the community is committed to undertaking to
   achieve that vision. It is intended to provide guidance to local elected officials on
   land use patterns, the existing needs of facilities and services, and the protection
   and enhancement of quality of life within the community.

   The Plan seeks to establish the ground rules for the manner in which the
   community will develop and invest by asking three questions:

            • Where are we now?
            • Where do we want to be?
            • How do we get there?

   By considering current needs and existing opportunities, the plan provides a
   foundation for decision-making in support of achieving short- and long-term
   goals.
introduction

Process Overview
The Comprehensive Plan process follows the Rules of the Georgia Department of
Community Affairs (“DCA”), O.C.G.A. Chapter 110-12-1, Minimum Standards and
Procedures for Local Comprehensive Planning, effective October 1, 2018. The
DCA rules state that the Comprehensive Plan for the City of Elberton consist of
the following elements:

Needs and Opportunities
An analysis of the community’s needs and opportunities helps to determine
local conditions. Public engagement was used to identify existing issues, and
opportunities on which the city can capitalize on to address those issues.

Community Vision and Goals
Through public and steering committee engagement, the city’s vision, goals, and
policies are developed to determine the community’s future direction. As a part
of this component, policies are identified to assist in making decisions that are
consistent with community goals.

Economic Development
This section is required for any community included in Tier 1 of the Georgia Job
Tax Credit Program. Elements of local needs, opportunities, and work program
items are incorporated throughout the sections of this document.

Future Land Use
This section is required for any community that has a local zoning ordinance and
assigns future land use categories by parcel. The Future Land Use map will guide
local elected officials on zoning and land use policy decisions. The intention is to   Image 1: Elberton "Granite Capital
influence growth and development throughout the community in consideration             of the World"Mural
of existing development patterns, access to utilities and services, and community
needs and goals.

Community Work Program
The final component of the comprehensive plan, the Community Work Program,
outlines steps and strategies for achieving the community’s goals and implementing
its plans. The Work Program will include a Report of Accomplishments from the
previous list of projects and a Short Term Work Program that identifies priority
projects, timelines for implementation, responsible parties, and funding strategies.

Public Involvement
The Comprehensive Plan update incorporated public involvement throughout.
The planning process began with a public hearing and community input session on
August 4, 2021, where the public was invited to discuss the assets and challenges

                                                                                                                            5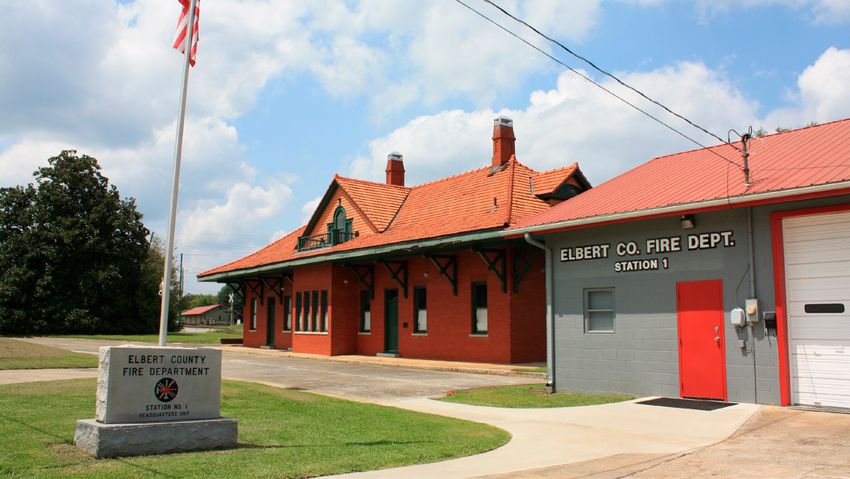
CITY OF ELBERTON COMPREHENSIVE PLAN | 2022 - 2027

    found in the city and county, and their hopes for its future. Following the initial
    public meeting, several publicly available work sessions were held with a Steering
    Committee, a group of citizens representing various communities and interests
    throughout the City. This Committee provided valuable feedback, guidance, and
    recommendations, and served an integral role in developing a plan representative
    of the community’s vision. In addition, an online public survey was available from
    August 4 - September 1, 2021. The online survey allowed the local government to
    receive a wider range of input than otherwise would have been possible.

    A final public hearing was held on December 13, 2021, before submittal of the
    plan to the DCA for review.

    The Northeast Georgia Regional Commission's Planning & Government Services
    Division oversaw the development of this plan, including facilitating public
    involvement and input meetings.

    Review Process
    According to the DCA’s rules for comprehensive planning, effective October
    1, 2018, the City must transmit the plan to the Northeast Georgia Regional
    Commission (NEGRC) when all required components are complete. The transmittal
    must also include the community’s certification that it has considered both the
    Regional Water Plan and the Rules for Environmental Planning Criteria. Once it
    completes its review, the NEGRC will forward the plan to the DCA for review.

    Once the plan has been found by the DCA to be in compliance with Minimum
    Standards and Procedures, the approved Plan may be adopted by local resolution.

    Data and Statistics
    The facts, figures, and statistics used to develop the Plan were generated from
    data compiled throughout the planning process. The data and analyses were used
    to identify general trends, and provide a reliable quantitative context to describe
    existing conditions and assist in informing the recommendations and policies.

6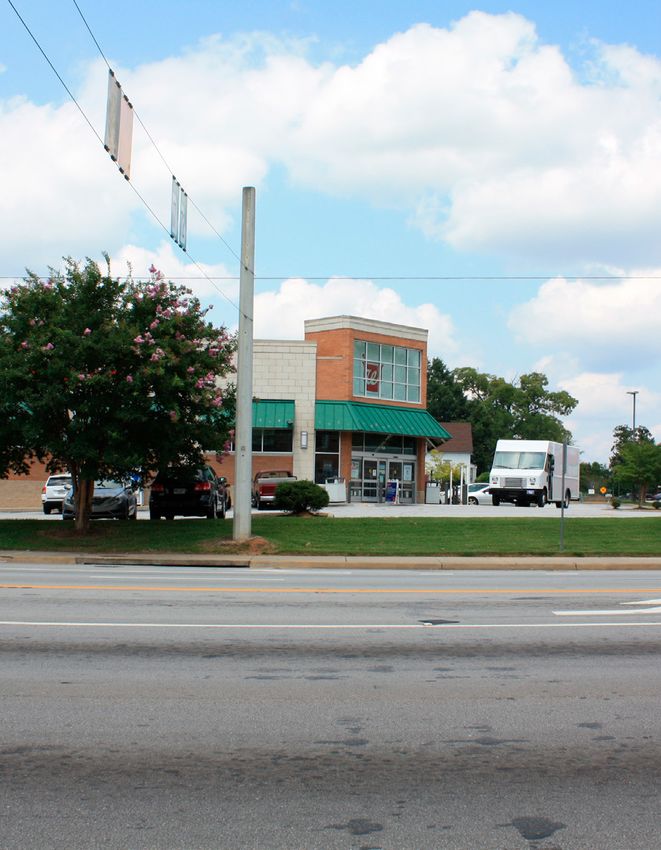
C      H     A      P     T      E     R     T    W     O

    NEEDS AND
OPPORTUNITIES
    The following Needs and Opportunities were identified using an analysis of
    relevant data and a survey of community leaders, city staff, and stakeholders who
    participated in a number of surveys and input sessions. The list is intended to
    capture the most prescient needs that the community will have over the next five
    to ten years, in order to establish a set of goals the community can work towards
    achieving. Identified items are categorized into the following topics:

    Economic Development
    Land Use, Housing, and Community Development
    Natural and Cultural Resources
    Transportation
    Community Facilities and Services
    Broadband Services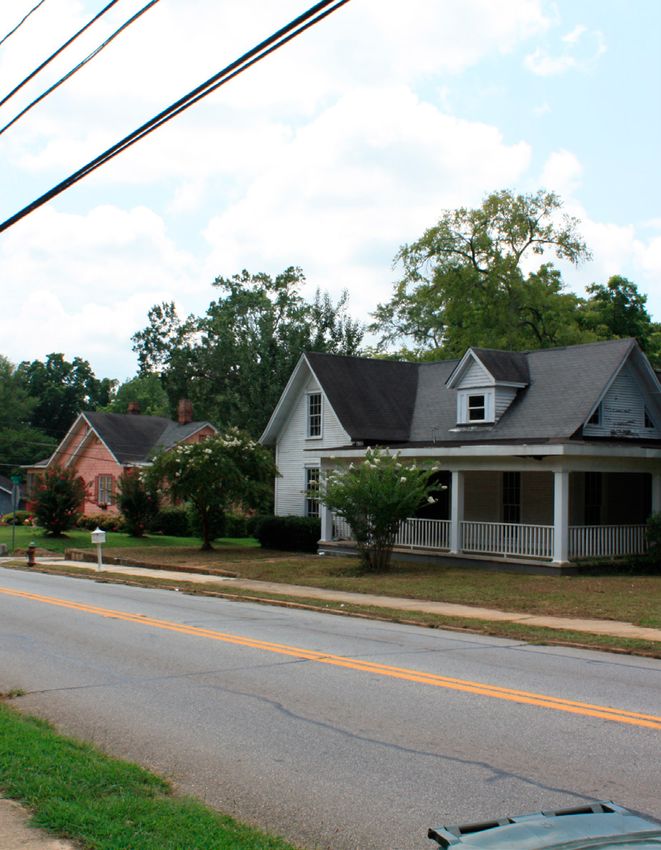
CITY OF ELBERTON COMPREHENSIVE PLAN | 2022 - 2027

                                  Community Overview
                                  The City of Elberton serves as the county seat of Elbert County, located on the
                                  border of Georgia and Abbeville County, South Carolina. The population of the
                       Image 2:
    McIntosh Street, Downtown     City totals 4,522 with a median household income of $40,295, lower than the
                       Elberton   state median household income of $58,700 (U.S. Census). The population has
                                  remained stable over the past decade, slightly decreasing since 2010. Between
                                  the years of 2021-2026, the city is expected to continue decreasing in population
                                  at an annual rate of 0.41 percent. Of the total 2,381 households, 50.5 percent are
                                  estimated to be owner-occupied with 33 percent renter-occupied; the remaining
                                  16.5 percent of homes are estimated to be vacant. The unemployment rate of
                                  Elbert County as a whole is 3 percent as of September 2021, slightly higher than
                                  the regional unemployment rate of 2.2 percent (Georgia Department of Labor).

                                  Additional community statistics used in the local analysis to determine needs and
                                  opportunities and guide discussions during public input meetings can be found
                                  in the Appendix.

                                  Community Survey Results
                                  Elbert County, the City of Elberton, and the City of Bowman participated in a
                                  joint public input process via an online survey that was created and hosted by the

"The                              Northeast Georgia Regional Commission. This survey was advertised through the
                                  local government websites, social media pages, and various affiliated government
                                  and non-profit agency social media pages. The survey received 32 responses, 12

remaining                         of which were for the City of Elberton. The following list provides a brief analysis
                                  of key points from input received by residents:

historic                          **This list does not encompass all questions that were included in the survey. Follow
                                  up questions were provided for Yes/No answers that allowed residents to provide more

buildings are                     detail.

a treasure"
                                  1.   Are the streets and sidewalks adequately maintained?
                                       •    Yes (10)
                                       •    No (2)
                                  2.   Is the community safe, comfortable, and inviting for people to walk or bike to
                                       activities, jobs, shopping, dining, services, etc.?
                                       •    Yes (9)
                                       •    No (3)
                                  3.   Does your community have any traffic issues?
                                       •    Yes (3)
                                       •    No (9)
                                  4.   In your opinion, is park space within your community easily accessible to all
                                       residents? If not, explain:

8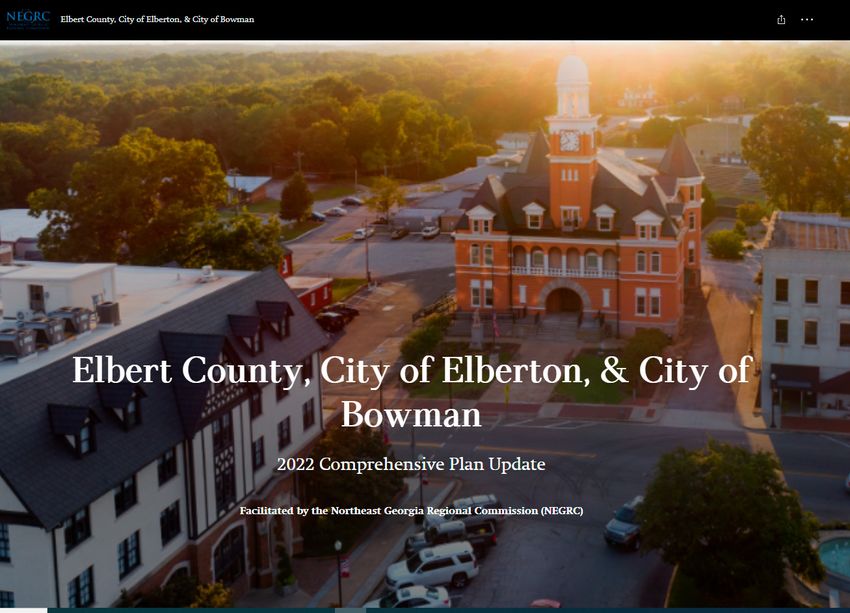
Needs and opportunities
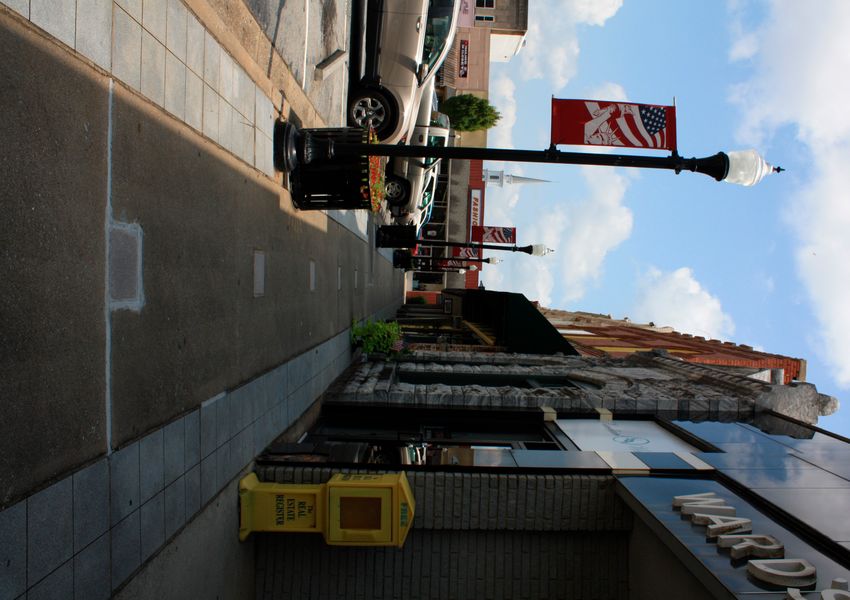
Image 3: St. Mary Catholic Church,
• Yes (6) Forest Avenue
• “Parks are not accessible to resident that don’t have transportation”
• “I wish there were more options”
5. What is the most immediate housing need within your community?
Explain.
• Rental housing of all types (6)
• Middle-class housing
• More housing of all kind is needed
6. What is a defining characteristic of your community that you would like
to see preserved?
• Granite industry is a nice tourist attraction
• This is a small community with a good people
• The two best things are the local theater and the annual county fair
• Historic Buildings, sites, neighborhoods, and downtown areas
• Small-town feel
Strengths, Weaknesses, Opportunities, and Threats (SWOT) Analysis
• The cost of living is lower than the Georgia average • There seems to be a certain amount of negativity
• Sense of community – seems that most residents of present
our cities and county and quick to respond to those • Inability to retain our young people as they
in need; to lend a helping hand graduate from high school
• Having a hospital in our small community is a • Lack of adequate, decent affordable rental
definite advantage; Also, having a campus of Athens properties
Tech is a plus to our local economy • Diversity – coming together
• Room for growth • There are not enough jobs outside of the
• City of Elberton’s Utility and Public Works response restaurant industry
time to emergency repairs and/or new installations • Our community is aging and we need new
and extensions business and new business training to get our
• It is a great place to raise children, because the youth who graduate college to be able to come
community support is great back to the community
• Lack of well-paying jobs
S W
• Grow under the direction of leadership at all levels O T • Drugs have long been a problem
who work for the good of the entire population of • Poverty
the county. • Crime
• Reach those who feel they are underserved • Economic instability
• Grow Businesses • Surrounding county is thriving and population
• Reinvest in our youth by establishing things that increasing due to lake development
interest them • Dilapidated housing
• Bring in new industry and commit to the training of
individuals who would eventually work in those jobs
• Market Lake Russell
• Expand the Industrial Park for the new industry
9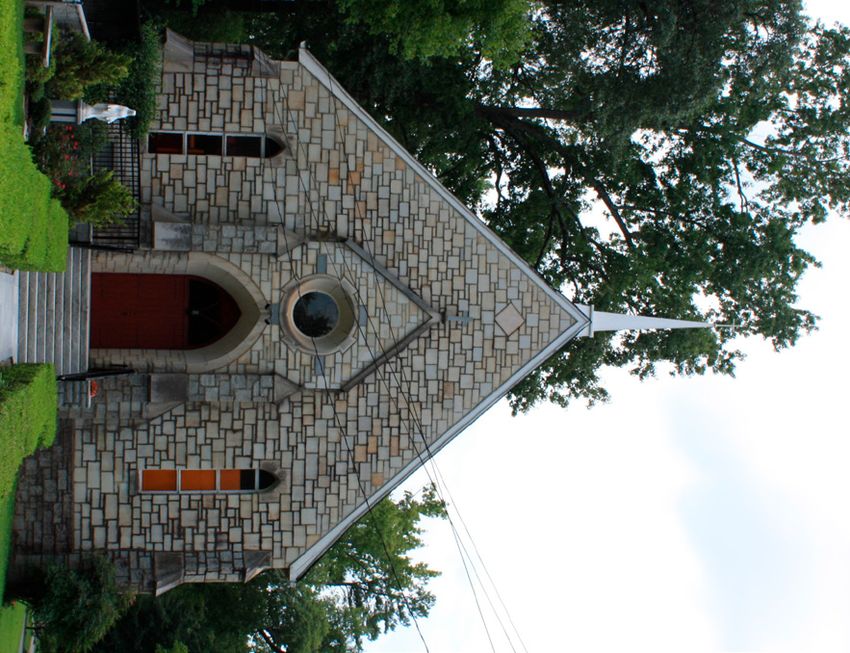
CITY OF ELBERTON COMPREHENSIVE PLAN | 2022 - 2027
Needs and Opportunities
Economic Development
Needs
• More job opportunities beyond the restaurant industry and retail are needed
for improved wages and job stability.
• There is a need to attract new industry to the City.
• Skilled labor/workforce is needed to attract new businesses and industries.
• Well-paying jobs with longevity are needed for economic stability and
population retention.
• Existing businesses and industry in all sectors need support, engagement,
and resources to continue to thrive in the community.
• Recruit new employers to complement and enhance the local economy by
offering a more diverse range of employment options.
• There is a need to increase the City’s visibility as a destination for recreation
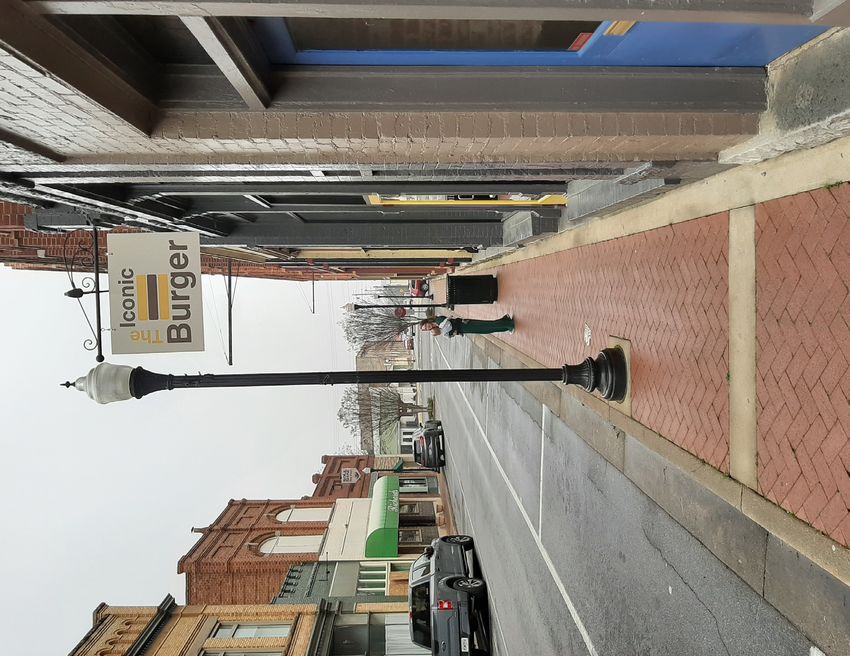
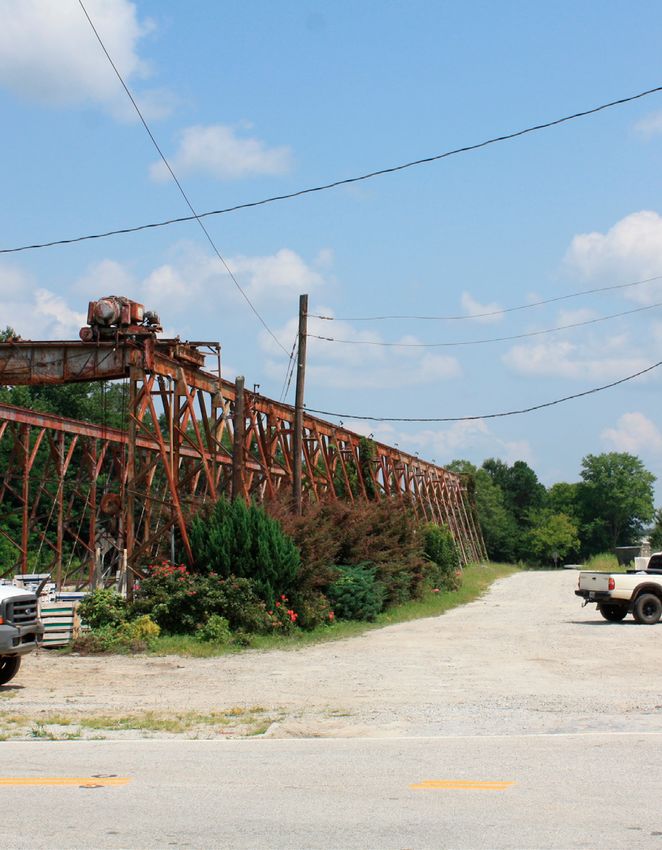
Image 4: Elberton has access to
freight infrastructure and a strong and industry.
existing local industrial economy.
However, sectors associated with
tourism, retail, and restaurants Opportunities
could be enhanced • The City has acquired 160 acres of undeveloped property for industrial use
to serve new industrial growth over the coming years. The property has
access to existing utility infrastructure when needed.
• Access to incentive programs for new and existing industries from the State,
County, and City of Elberton are in place to foster economic growth. Elberton
is within the Georgia Job Tax Credit Program as a Tier 1 community.
• Existing workforce development programs include: Elbert County
Comprehensive High School’s Career, Technical, and Agricultural Education
Program, and the Elberton Campus of Athens Technical College.
Image 5: Local Granite City BBQ Cook-off
Festival, Downtown Elberton
Land Use, Housing, and Community Development
Needs
• There is a significant presence of housing, within the City of Elberton, that is
declining in quality and require renovation and upkeep.
• There are dilapidated and failing houses that may be slated for condemnation
and demolition if they are beyond the scope of repair.
• There is a need for the expansion of housing options, particularly affordable
options, for both buying and renting.
• Apartment options, particularly 1-2 bedroom options, are in high demand
Image 6: Petersburg Towers, within the City.
example of limited rental housing
• The City of Elberton has been struggling with population loss, especially
opportunity within the city
among younger generations, due, in part, to less options for housing that
cater to them.
• There is a lack of housing facilities for retirees and those who need assisted
living.
• There is little available land within the City limits to purchase and develop.
• Some property owners do not perform routine maintenance in a timely
manner.
• Lower income housing is among the housing that is often not well-maintained.
10Needs and opportunities
Opportunities
• The construction of well-maintained affordable housing for the average
income families with particular consideration of affordability for teachers, fire
fighters, police officers, retail workers, and others.
• The City of Elberton has an owner-occupancy rate above the state average
and this is a strength that demonstrates the readiness of the community for
more housing.
• The City could identify potential properties ideal for infill development
and multi-family housing through planning exercises to attract potential
developers.
• The City could explore available housing assistance programs such as the Image 7:
Linear park system offering
Georgia Initiative for Community Housing. walking trails, open space, and
playgrounds.
Natural and Cultural Resources
Needs
• Balance growth with protections for natural resources and the environment.
• Access to natural resources and parks was noted as being limited in
accessibility through a public survey.
• There is a need for greater diversity of activities for youth and young adults.
• Many historic buildings in the city need renovation or rehabilitation.
Opportunities
• Control and guide growth through effective code enforcement and strategic
infrastructure expansion respective of environmental conditions.
• Work through public engagement to determine the most appropriate types
of recreation to add to public facilities for youth and adults. Image 8: State Route 72, this
serves as one of the main
• There are grants and other public funding options to cover the costs of thoroughfares through the city.
rehabilitation of historic buildings.
Transportation
Needs
• There is a need to improve circulation for truck traffic in downtown Elberton.
• Work to improve transportation infrastructure in support of economic
development goals.
• The rising cost of maintenance of current infrastructure is a challenge.
• State Highways show a higher level of vehicular crashes that result in
significant injury compared to local streets. Speed reductions and other safety
improvements may be needed along State Routes to mitigate dangerous
conditions.
11CITY OF ELBERTON COMPREHENSIVE PLAN | 2022 - 2027
Opportunities
• Developing more efficient systems to plan, build, and maintain transportation
infrastructure.
• Expanding mobility options.
• The City's existing sidewalks are a good starting point for a larger, connected
bicycle and pedestrian network. Comprehensive bicycle and pedestrian
planning would provide a guide for targeted improvements to optimize
connectivity.
• Coordinate with the Georgia Department of Transportation on the schedule
of road maintenance projects within city limits so that safety improvements
can be incorporated on state routes.
Image 9: Example of pedestrian
crosswalk, Forest Avenue
Community Facilities and Services
Needs
• Replace aging and obsolete infrastructure to increase efficiency and improve
delivery of services.
• Sewage treatment facility is at 80% capacity and requires significant upgrades.
• Strategic replacement of sewer mains and storm water lines and main intakes.
• More facilities that encourage youth engagement and activities.
Opportunities
Image 10: Example of unused alley that could
• Strategic repair, and retrofit of infrastructure can be an incentive to attract
be activated for pedestrian use.
new development in targeted locations.
• Redevelop a new sewer treatment facility to increase capacity and meet
modern environmental requirements.
• Seek financing (grants and loans) to address aging sewer and storm water
infrastructure.
• Invest in facilities that cater to the interests of the youth population.
Broadband Services
Needs
• The city population is served completely by broadband of 200Mbps of
Image 11: Elbert Memorial Hospital
download speed.
• There are few options for free, publicly accessible internet.
Opportunities
• The City is working to upgrade infrastructure of ElbertonNET city-wide to
provide 1GB of download speeds within the next 24 months.
• A targeted partnership with the public library branch could be used to
enhance publicly accessible Wi-Fi locations.
12Needs and opportunities
Image 12: Main Street Cruise-In Classic Car Show, Downtown Elberton
13C
3
H A P
VISION,
GOALS, AND
POLICIES
T E R T H R E Evision, goals, and policies
VISION STATEMENT
Elberton will be known for its safe
and livable small town atmosphere
with diverse employment
opportunities serving the regional
community. Citizens will have
access to quality education, good
jobs, careers, arts, cultural events
and recreation. We will be a live-
work-play community preserving
the historical integrity of our
neighborhoods and our downtown.
Citizens will have access to quality,
competitively priced, city-owned
utilities and services. Our leaders will
be collaborative and aggressive in
promoting smart growth, education,
economic prosperity, quality of life,
and equal opportunities for all.
15CITY OF ELBERTON COMPREHENSIVE PLAN | 2022 - 2027
Goals and Policies
The goals and policies below are designed to help the City of Elberton elected
officials and staff in decision-making processes. They are categorized based on
the DCA’s State Planning Recommendations and target identified needs and
opportunities from the previous section.
Economic Development
• Support programs that retain, expand, and create businesses that provide a
good fit for our economy in terms of job skills required and links to existing
businesses.
• Increase local employment opportunities through the promotion of orderly
economic growth, fostering the attraction of new businesses and industries
that diversify the local economy and maximize the strengths of the local labor
Image 13: Local example of a force.
mural accenuating local history
and enhancing the aesthetics of • Improve the talent of the local labor pool and improve high school graduation
the built environment, Downtown rates.
Elberton
• Consider cost-to-benefit ratios in making decisions on economic development
projects.
• Prioritize expansion of facilities and services incrementally.
• Consider the employment needs and skill levels of the existing population
in making decisions on proposed economic development projects and job
training resources.
• Recruit diverse and environmentally sensitive industries that will provide jobs
for residents.
• Support and encourage local entrepreneurs and artists.
Image 14: Rusted vent on a high school • Support the growth of technology- and skill-based industries in the city.
gymnasium
• Work with County and regional agencies to encourage business education
support to small business owners.
• Strengthen cooperative effort with Athens Technical College to identify
training resources to train local residents for prospective industries.
Land Use
• Promote development that will add value to our community through design,
landscaping, lighting, signage, and scale.
• Provide incentives to rehabilitate existing buildings and to construct new
buildings that are compatible with the period and feel of the existing
architecture.
• Guide new development in suitable locations in order to protect natural
resources, environmentally sensitive areas, and agricultural lands.
• Strive for excellence when assisting developers, property owners, and
residents to use attractive community design and maintenance as a means
to enhance environmental protection and support community facility
infrastructure.
16Broadband Services
• Continue to own, operate, and expand as a local internet provider to deliver
high quality broadband to the citizens of Elberton and Elbert County.
Image 15: (left)
• Identify strategic investments and partnerships to reach a threshold of 100 Historic Elbert Theatre
percent served population in Elbert County.
Transportation, Facilities and Public Services Image 16: (right)
Elbert County Fire Department,
• Work with the Georgia Department of Transportation, the various railroad Station 1, and the Historic
owners, and other local stakeholders to ensure appropriate transportation Elberton Train Depot
infrastructure is developed and installed in support of economic development
initiatives.
• Identify, encourage, and protect desirable land uses and development
patterns along transportation corridors.
• Provide a safe, efficient, and effective transportation system that reflects
both existing and future needs while providing a variety of transportation
options.
• Guide development into areas appropriate to the transportation network and
existing utility services.
• Provide potable water service in a safe, clean, efficient, economical, and
environmentally sound manner concurrent with new development.
• Provide sanitary sewer service in a safe, clean, efficient, economical, and
environmentally sound manner, concurrent with urban development.
• Target land and infrastructure investments to optimize commercial and
industrial growth.
17C H A P T E R F O U R
LAND USE
The Land Use Chapter includes a description of future development categories
with synchronized policies and a Future Land Use Map. The “future land use”
methodology was chosen for the format of land use planning in this document
in lieu of the “character area” methodology. The future land use method involves
assigning land use categories to each parcel with example uses associated with
each category.
It is crucial to have a holistic understanding of land use patterns and existing
regulations as they will have the most significant influence over future growth and
development. A review of existing land use was performed to accurately inform
any potential future changes. In addition, the future land use map is conceptually
consistent with the local zoning ordinance so that the local government’s ability
to manage land use appropriately is not diminished.land use
Future Land Use Categories
Residential
There are four Residential categories: Low-Density Residential, Medium-Density
Residential, High-Density Residential, and Multi-Family Residential. The use
of the land includes housing and related activities. The existing housing stock
is predominantly single-family detached residential. There is a small amount of
manufactured housing and a significant stock of historic homes. There is currently
very little multi-family housing or rental options in the city. The following provides
definitions for each Residential category:
• Low-Density: average of one or fewer housing units per acre
• Medium-Density: average of 1-4 housing units per acre
• High-Density: average of five or more housing units per acre
• Multi-Family: multiple housing units per building
Commercial
Commercial land includes retail sales, restaurants, office, services, and
entertainment facilities. Commercial uses may be located as a single use in one
building or grouped together in a shopping center, office building, or commercial
district.
Office / Professional
Office / Professional accommodates business concerns that do not provide a
product directly to customers on the premises, or do not, as a primary activity
involve the manufacturing, storage, or distribution of products. This category
includes small, single-occupant structures and office parks with a variety of tenant
in multi-story buildings.
Public / Institutional
Public / Institutional land includes community facilities, utilities, and state, federal,
or local government administrative uses and institutional land uses.
Industrial
Industrial land includes land dedicated to warehousing, wholesale trade facilities,
manufacturing facilities, processing plants, factories, mining or mineral extraction
facilities or other similar uses.
Parks / Recreation / Conservation
Parks / Recreation / Conservation land is dedicated to active or passive
recreational uses and natural resource conservation. These areas may be either
publicly- or privately-owned and may include playgrounds, public parks, nature
preserves, wildlife management areas, national forests, golf courses, recreation
centers, or similar uses. Conservation subdivisions may also include some land
preserved as greenspace or recreational land through easements.
19CITY OF ELBERTON COMPREHENSIVE PLAN | 2022 - 2027
City of Elberton Future Land Use Map
MLK Jr. Blvd.
Low-Density Residential Office / Professional
Medium-Density Residential Public / Institutional
High-Density Residential Industrial
Multi-Family Residential
Commercial
Parks / Recreation / Conservation
N
0 0.5 1
Created by: NEGRC [JM]
Date: November 1, 2021 Miles
20land use
Land Use Examples
Image 16: Commercial or Office/Professional Image 17: Medium-Density Residential
Image 18: Commercial Image 19: Industrial
21C H A P T E R F I V E COMMUNITY WORK PROGRAM The Community Work Program outlines steps and strategies for achieving the community’s goals and implementing its plans. This section includes a Report of Accomplishments which offers a status of projects from the previous Comprehensive Plan Short Term Work Program (STWP). Additionally, this section includes a Short Term Work Program for the following five years. The STWP identifies priority projects, timelines for implementation, responsible parties, and funding strategies. This list is intended to provide tangible goals that address the needs and opportunities identified throughout this document and process.
c o mm u n i t y w o r k p r o g r a m

Report of Accomplishments (2018-2022)
    #                       ACTIVITY                               S TAT U S                             NOTES
                                                                 (COMPLETE,
                                                                  ONGOING,
                                                                 POSTPONED,
                                                                 CANCELLED)

1       Promote and market Samuel Elbert Hotel for            Complete               Renovated by City in 2017.
        private and/or public reuse.
2       Promote economic development within the               Ongoing                Revised and carried over to Work Program Item
        downtown square and main street districts.                                   #1. Revised to incorporate a measurable action
                                                                                     item.
3       Promote Elmhurst Cemetery.                            Ongoing                Revised and carried over to Work Program
                                                                                     Item #14. Revised to incorporate a measurable
                                                                                     action item.
4       Work with state agencies to identify opportunities    Ongoing                Revised and carried over to Work Program Item
        for business and industrial recruitment.                                     #2. Revised to incorporate a measurable action
                                                                                     item.
5       Study local economic characteristics and              Ongoing                Revised and carried over to Work Program Item
        conditions to address the potential for economic                             #3. Revised to incorporate a measurable action
        diversification.                                                             item.
6       Continue to support the Economic Development          Ongoing                Revised and carried over to Work Program Item
        Authority.                                                                   #4. Revised to incorporate a measurable action
                                                                                     item.
7       Develop teleconferencing capabilities to allow for    Cancelled              Options for video conferencing have changed
        distance learning educational opportunities.                                 drastically. Special equipment no longer
                                                                                     needed.
8       Promote infill residential development to             Ongoing                Revised and carried over to Work Program Item
        developers.                                                                  #5. Revised to incorporate a measurable action
                                                                                     item.
9       Minimize the negative environmental impacts of        Ongoing                Revised and carried over to Work Program Item
        residential development.                                                     #7. Revised to incorporate a measurable action
                                                                                     item.
10      Minimize the negative environmental impacts of        Ongoing                Consolidated with previous line item. Carried
        development.                                                                 over to Work Program Item #7.
11      Coordinate new development with existing and          Ongoing                Consolidated with previous two line items.
        planned community facilities.                                                Carried over to Work Program Item #7.
12      Assist Special needs population with receiving        Ongoing                Revised and carried over to Work Program Item
        government assistance to improve housing                                     #8. Revised to incorporate a measurable action
        conditions.                                                                  item.
13      Seek government funding to rehabilitate               Ongoing                Revised and carried over to Work Program Item
        substandard housing and to ensure a continued                                #9. Revised to incorporate a measurable action
        supply of low-to-moderate income affordable                                  item.
        housing options.
14      Façade Grant                                          Complete               The grant programs is available at the $5,000
                                                                                     level.

                                                                                                                                     23
CITY OF ELBERTON COMPREHENSIVE PLAN | 2022 - 2027
# ACTIVITY S TAT U S NOTES
(COMPLETE,
ONGOING,
POSTPONED,
CANCELLED)
15 Work with county to develop public education Ongoing Revised and carried over to Work Program
program to promote recycling. Item #18. Revised to incorporate a measurable
action item.
16 Coordinate new development with the local school Ongoing Revised and carried over to Work Program
board to minimize impacts on the school system. Item #11. Revised to incorporate a measurable
action item.
17 Continue sewer system Inflow & Infiltration Ongoing Carried over to Work Program Item #21.
remediation projects. Revised to incorporate a measurable action
item.
18 Replace all bare steel natural gas main, 15 miles. Complete All were completed by end of 2018.
19 Add storm water, electric, and broadband Complete All added to GIS except stormwater which is
infrastructure to GIS mapping system. not a high priority.
20 Utilize Future Land Use map to coordinate new Ongoing Planned as ongoing item, removed from Work
development in appropriate areas serviced by Program.
necessary infrastructure.
21 Utilize the Future Land Use map to coordinate Ongoing Planned as ongoing item, removed from Work
new economic development in appropriate areas Program.
serviced by the necessary infrastructure.
22 Utilize the Future Land Use map to coordinate new Ongoing Planned as ongoing item, removed from Work
development with the Comprehensive Plan. Program.
23 Address the Future Land Use map every two Ongoing Revised and carried over to Work Program
years to ensure it adequately reflects prevailing Item #10. Revised to incorporate a measurable
development patterns. action item.
24 Develop a cooperative relationship between local Ongoing Planned as ongoing item, removed from Work
government, Athens Tech, and local businesses and Program.
industries to monitor labor force conditions and
needs.
25 Coordinate new development with the local school Ongoing Planned as ongoing item, removed from Work
board to minimize impacts on the school system. Program.
26 Coordinate tourism and cultural resource Ongoing Revised and carried over to Work Program
development efforts to include all jurisdictions and Item #15. Revised to incorporate a measurable
appropriate state agencies. (See Cultural Resources action item.
Element for detailed description of projects.)
27 Improve transportation infrastructure according to Ongoing Removed from Work Program
community needs.
28 Partner with the DDA to rehabilitate the Bailey Ongoing CDBG-RDF grant awarded in 2020. Work
Building at 23 North Public Square to incorporate expected to be completed in 2022. Carried
mixed use. over to Work Program Item #12.
24c o mm u n i t y w o r k p r o g r a m
Short-Term Work Program (2022-2026)
(**entries with an asterisk represent carryover items from the previous STWP)
# ACTIVITY TA R G E T O F RESPONSIBLE COST FUNDING
COMPLETION PA RT Y E S T I M AT E SOURCE
ECONOMIC DEVELOPMENT
1 **Create a working inventory list of vacant 2022 City Manager Staff Time General Fund
spaces within the downtown square and / Downtown
main street districts with property details Development
to be advertised through the Downtown Authority
Development Authority.
2 Complete a business and industry compatibility 2024 Select Elbert / $30,000 General Fund /
study with coordination between regional Downtown Grants
and state agencies to determine the most Development
appropriate sectors to recruit based on local Authority / City
infrastructure capabilities. Council / City
Manager
3 Identify gaps between local workforce 2023 Select Elbert Staff Time General Fund
development initiatives and economic / Chamber of
development activities to facilitate economic Commerce /
diversification. (Deliverable: Elbert Economic Downtown
Diversification Analysis) Development
Authority / Athens
Tech / City Council
/ City Manager
/ Elbert County
Administrator
4 Host annual retreat with Select Elbert, the 2022-2026 Select Elbert / Staff Time General Fund
Downtown Development Authority, and Elbert Downtown
County to determine needs and opportunities. Development
Authority / City
Manager
LAND USE, HOUSING, AND COMMUNITY DEVELOPMENT
5 **Determine most appropriate parcels 2023 City Manager / Staff Time General Fund
to promote rental housing development Elberton Planning
developers. Commission /
Elberton Housing
Authority
6 Analyze zoning ordinance to determine what 2023 City Manager / $30,000 General Fund
barriers exist for infill development (e.g. lot size, Elberton Planning
building size, etc.). Commission / City
Council
25CITY OF ELBERTON COMPREHENSIVE PLAN | 2022 - 2027
# ACTIVITY TA R G E T O F RESPONSIBLE COST FUNDING
COMPLETION PA RT Y E S T I M AT E SOURCE
7 **Identify strategic nodes to concentrate 2023 City Manager / Staff Time General Fund
new development to minimize environmental Elberton Planning
impacts. Commission / City
Council
8 **Identify housing needs of individuals with 2024 City Manager / $2,000 General Fund
disabilities through surveying and public City Council
engagement.
9 **Seek government funding (CHIP/CDBG) to 2025-2026 City Council / City $600,000 - General Fund,
rehabilitate substandard housing. Manager $750,000 Grants
10 **Review the Future Land Use map every two 2024 - 2026 City Manager / Staff Time General Fund
years to ensure it adequately reflects prevailing Elberton Planning
development patterns. Commission
11 **Review Code of Ordinances to compare 2025 City Manager / Staff Time General Fund
local environmental regulations to State City Attorney /
requirements to minimize conflicts. Elberton Utilities
12 **Partner with the DDA to rehabilitate the 2022-2023 City Council / $915,000 General Fund,
Bailey Building at 23 North Public Square to City Manager CDBG Grant
incorporate mixed use. / Downtown
Development
Authority
13 Apply for the Georgia Initiative for Community 2026 City Council / City Staff Time General Fund
Housing Program (GICH) in partnership with Manager / Elbert
Elbert County. County
N AT U R A L A N D C U LT U R A L R E S O U R C E S
14 **Create an informational pamphlet for 2025 City Manager / $2,000 General Fund
Elmhurst Cemetery that provides a narrative of Elberton Historic
historical and cultural significance to the city. Preservation
Commission
15 **Coordinate tourism and cultural resource 2022-2024 City Clerk / Staff Time General Fund
development with the Chamber of Commerce Chamber of
through website applications. Commerce
T R A N S P O R TAT I O N
16 Create a complete streets and trails master 2024-2025 City Council / City $5,000 General Fund
plan for the city to prioritize repairs and Manager / NEGRC
improvements for sidewalks and trails.
26c o mm u n i t y w o r k p r o g r a m
# ACTIVITY TA R G E T O F RESPONSIBLE COST FUNDING
COMPLETION PA RT Y E S T I M AT E SOURCE
17 Identify opportunities with GDOT for safety 2022 - 2026 City Manager Staff Time General Fund
improvements along state routes throughout / Public Works
the city. Department / Fire
Department
CO M M U N I T Y FAC I L I T I E S A N D S E RV I C E S
18 **Work with Keep Elbert County Beautiful to 2023 Elberton Utilities Staff Time / General Fund
develop public education program to promote / Keep Elbert $5,000
recycling. County Beautiful
19 Develop a new sewer treatment facility 2025-2026 Elberton Utilities $15 million User Fees,
to increase capacity and meet modern Grants
environmental requirements.
20 Create a prioritization list of aging sewer 2022 City Manager / Staff Time / SPLOST
and stormwater infrastructure that requires Elberton Utilities $30,000
replacement.
21 **Replace aging sewer and storm water 2023-2026 City Manager / $6 million SPLOST, User
infrastructure. Elberton Utilities Fees, Grants
22 Survey community to identify most strategic 2024 City Manager / Staff Time General Fund
public investments that would enhance City Council
recreational options for youth population.
Create list of implementable projects based on
community survey.
BROADBAND SERVICES
23 Expand ElbertonNET services throughout the 2022-2024 ElbertonNET $3 million Grants, User
county. Fees, SPLOST
24 Upgrade ElbertonNET services to 2022-2024 ElbertonNET $1 million User Fees
accommodate 1GB of download speeds.
I N T E R G O V E R N M E N TA L C O O R D I N AT I O N
25 Host meeting with Board of Education to 2024 City Manager / Staff Time General Fund
determine remaining capacity of school system Board of Education
and coordinate local development needs.
27C H A P T E R S I X
APPENDIX
The following section provides documentation of public meetings, public
involvement, and data collection associated with the development of the
Comprehensive Plan.appendix
Public Hearing 1 Documentation
29CITY OF ELBERTON COMPREHENSIVE PLAN | 2022 - 2027
Public Hearing 2 Documentation
30appendix
Public Involvement
Public Input Meeting #2
Public Input Meeting #3
31CITY OF ELBERTON COMPREHENSIVE PLAN | 2022 - 2027
Public Involvement (cont.)
Online Public Survey and Story Map: Available from 8/4/21 - 9/1/2021
32appendix
Community Data
Graphic Profile
Elberton City, GA 2 Prepared by Esri
Elberton City, GA (1326616)
Geography: Place
2021 Population by Race 2021 Population by Age
53.0%
5.4%
2,500 18.5%
38.9%
13.6%CITY OF ELBERTON COMPREHENSIVE PLAN | 2022 - 2027
Community Data (cont.)
Community Profile
Elberton City, GA 2 Prepared by Esri
Elberton City, GA (1326616)
Geography: Place
Elberton city...
Population Summary
2000 Total Population 4,789
2010 Total Population 4,544
2021 Total Population 4,522
2021 Group Quarters 90
2026 Total Population 4,430
2021-2026 Annual Rate -0.41%
2021 Total Daytime Population 5,866
Workers 3,085
Residents 2,781
Household Summary
2000 Households 2,006
2000 Average Household Size 2.34
2010 Households 1,978
2010 Average Household Size 2.24
2021 Households 1,988
2021 Average Household Size 2.23
2026 Households 1,958
2026 Average Household Size 2.22
2021-2026 Annual Rate -0.30%
2010 Families 1,178
2010 Average Family Size 2.92
2021 Families 1,220
2021 Average Family Size 2.87
2026 Families 1,192
2026 Average Family Size 2.87
2021-2026 Annual Rate -0.46%
Housing Unit Summary
2000 Housing Units 2,283
Owner Occupied Housing Units 54.4%
Renter Occupied Housing Units 33.5%
Vacant Housing Units 12.1%
2010 Housing Units 2,334
Owner Occupied Housing Units 43.8%
Renter Occupied Housing Units 40.9%
Vacant Housing Units 15.3%
2021 Housing Units 2,381
Owner Occupied Housing Units 50.5%
Renter Occupied Housing Units 33.0%
Vacant Housing Units 16.5%
2026 Housing Units 2,410
Owner Occupied Housing Units 49.5%
Renter Occupied Housing Units 31.7%
Vacant Housing Units 18.8%
Median Household Income
2021 $40,295
2026 $42,630
Median Home Value
2021 $89,889
2026 $95,432
Per Capita Income
2021 $24,351
2026 $26,283
Median Age
2010 40.2
2021 39.6
2026 40.7
Data Note: Household population includes persons not residing in group quarters. Average Household Size is the household population divided by total households.
Persons in families include the householder and persons related to the householder by birth, marriage, or adoption. Per Capita Income represents the income received by
all persons aged 15 years and over divided by the total population.
Source: U.S. Census Bureau, Census 2010 Summary File 1. Esri forecasts for 2021 and 2026 Esri converted Census 2000 data into 2010 geography.
November 11, 2021
©2021 Esri Page 1 of 7
34appendix
Community Data (cont.)
Community Profile
Elberton City, GA 2 Prepared by Esri
Elberton City, GA (1326616)
Geography: Place
Elberton city...
2010 Population by Age
Total 4,544
0-4 7.7%
5-9 5.5%
10 - 14 6.0%
15 - 24 13.7%
25 - 34 12.1%
35 - 44 9.9%
45 - 54 13.5%
55 - 64 11.6%
65 - 74 8.7%
75 - 84 7.4%
85 + 3.9%
18 + 76.6%
2021 Population by Age
Total 4,523
0-4 6.9%
5-9 7.0%
10 - 14 6.1%
15 - 24 10.7%
25 - 34 13.6%
35 - 44 11.8%
45 - 54 11.0%
55 - 64 12.3%
65 - 74 10.7%
75 - 84 6.5%
85 + 3.5%
18 + 76.7%
2026 Population by Age
Total 4,430
0-4 6.5%
5-9 6.8%
10 - 14 7.0%
15 - 24 10.5%
25 - 34 11.9%
35 - 44 12.5%
45 - 54 10.8%
55 - 64 11.9%
65 - 74 11.5%
75 - 84 7.4%
85 + 3.2%
18 + 76.0%
2010 Population by Sex
Males 2,013
Females 2,531
2021 Population by Sex
Males 2,065
Females 2,458
2026 Population by Sex
Males 2,035
Females 2,395
Source: U.S. Census Bureau, Census 2010 Summary File 1. Esri forecasts for 2021 and 2026 Esri converted Census 2000 data into 2010 geography.
November 11, 2021
©2021 Esri Page 3 of 7
35CITY OF ELBERTON COMPREHENSIVE PLAN | 2022 - 2027
Community Data (cont.)
Community Profile
Elberton City, GA 2 Prepared by Esri
Elberton City, GA (1326616)
Geography: Place
Elberton city...
2021 Population 25+ by Educational Attainment
Total 3,134
Less than 9th Grade 5.4%
9th - 12th Grade, No Diploma 11.3%
High School Graduate 34.5%
GED/Alternative Credential 4.5%
Some College, No Degree 21.3%
Associate Degree 7.5%
Bachelor's Degree 10.3%
Graduate/Professional Degree 5.3%
2021 Population 15+ by Marital Status
Total 3,618
Never Married 43.2%
Married 36.9%
Widowed 8.3%
Divorced 11.6%
2021 Civilian Population 16+ in Labor Force
Civilian Population 16+ 1,824
Population 16+ Employed 94.2%
Population 16+ Unemployment rate 5.8%
Population 16-24 Employed 11.1%
Population 16-24 Unemployment rate 6.4%
Population 25-54 Employed 62.9%
Population 25-54 Unemployment rate 7.0%
Population 55-64 Employed 16.8%
Population 55-64 Unemployment rate 0.0%
Population 65+ Employed 9.3%
Population 65+ Unemployment rate 7.0%
2021 Employed Population 16+ by Industry
Total 1,718
Agriculture/Mining 2.6%
Construction 1.7%
Manufacturing 30.8%
Wholesale Trade 1.6%
Retail Trade 10.4%
Transportation/Utilities 6.5%
Information 1.1%
Finance/Insurance/Real Estate 3.4%
Services 36.8%
Public Administration 5.0%
2021 Employed Population 16+ by Occupation
Total 1,718
White Collar 42.9%
Management/Business/Financial 8.2%
Professional 14.1%
Sales 9.3%
Administrative Support 11.2%
Services 16.4%
Blue Collar 40.7%
Farming/Forestry/Fishing 0.3%
Construction/Extraction 1.6%
Installation/Maintenance/Repair 2.0%
Production 21.2%
Transportation/Material Moving 15.5%
Source: U.S. Census Bureau, Census 2010 Summary File 1. Esri forecasts for 2021 and 2026 Esri converted Census 2000 data into 2010 geography.
November 11, 2021
©2021 Esri Page 5 of 7
36appendix
Community Data (cont.)
ACS Population Summary
Elberton City, GA 2 Prepared by Esri
Elberton City, GA (1326616)
Geography: Place
2015 - 2019
ACS Estimate Percent MOE(±) Reliability
TOTALS
Total Population 4,343 36
Total Households 1,754 149
Total Housing Units 2,381 201
POPULATION AGE 3+ YEARS BY SCHOOL ENROLLMENT
Total 4,140 100.0% 97
Enrolled in school 974 23.5% 232
Enrolled in nursery school, preschool 54 1.3% 62
Public school 54 1.3% 62
Private school 0 0.0% 13
Enrolled in kindergarten 108 2.6% 69
Public school 108 2.6% 69
Private school 0 0.0% 13
Enrolled in grade 1 to grade 4 166 4.0% 93
Public school 146 3.5% 89
Private school 20 0.5% 31
Enrolled in grade 5 to grade 8 106 2.6% 68
Public school 97 2.3% 66
Private school 9 0.2% 15
Enrolled in grade 9 to grade 12 336 8.1% 150
Public school 324 7.8% 150
Private school 12 0.3% 17
Enrolled in college undergraduate years 183 4.4% 103
Public school 160 3.9% 101
Private school 23 0.6% 24
Enrolled in graduate or professional school 21 0.5% 24
Public school 21 0.5% 24
Private school 0 0.0% 13
Not enrolled in school 3,166 76.5% 235
POPULATION AGE 65+ BY RELATIONSHIP AND HOUSEHOLD TYPE
Total 793 100.0% 160
Living in Households 748 94.3% 157
Living in Family Households 361 45.5% 130
Householder 229 28.9% 88
Spouse 113 14.2% 58
Parent 19 2.4% 29
Parent-in-law 0 0.0% 13
Other Relative 0 0.0% 13
Nonrelative 0 0.0% 13
Living in Nonfamily Households 387 48.8% 114
Householder 387 48.8% 114
Nonrelative 0 0.0% 13
Living in Group Quarters 45 5.7% 30
Source: U.S. Census Bureau, 2015-2019 American Community Survey Reliability: high medium low
November 11, 2021
©2021 Esri Page 1 of 8
37CITY OF ELBERTON COMPREHENSIVE PLAN | 2022 - 2027
Community Data (cont.)
ACS Population Summary
Elberton City, GA 2 Prepared by Esri
Elberton City, GA (1326616)
Geography: Place
2015 - 2019
ACS Estimate Percent MOE(±) Reliability
WORKERS AGE 16+ YEARS BY PLACE OF WORK
Total 1,560 100.0% 270
Worked in state and in county of residence 1,104 70.8% 197
Worked in state and outside county of residence 384 24.6% 140
Worked outside state of residence 72 4.6% 60
SEX BY CLASS OF WORKER FOR THE CIVILIAN EMPLOYED POPULATION 16 YEARS
AND OVER
Total: 1,569 100.0% 266
Male: 953 60.7% 195
Employee of private company 711 45.3% 164
workers
Self-employed in own incorporated business 16 1.0% 17
workers
Private not-for-profit wage and salary workers 36 2.3% 38
Local government workers 60 3.8% 44
State government workers 57 3.6% 61
Federal government workers 0 0.0% 13
Self-employed in own not incorporated business workers 73 4.7% 51
Unpaid family workers 0 0.0% 13
Female: 616 39.3% 143
Employee of private company 434 27.7% 129
workers
Self-employed in own incorporated business 14 0.9% 20
workers
Private not-for-profit wage and salary workers 19 1.2% 17
Local government workers 106 6.8% 51
State government workers 18 1.1% 20
Federal government workers 25 1.6% 29
Self-employed in own not incorporated business workers 0 0.0% 13
Unpaid family workers 0 0.0% 13
POPULATION IN HOUSEHOLDS AND PRESENCE OF A COMPUTER
Total 4,228 100.0% 48
Populationappendix
Community Data (cont.)
ACS Population Summary
Elberton City, GA 2 Prepared by Esri
Elberton City, GA (1326616)
Geography: Place
2015 - 2019
ACS Estimate Percent MOE(±) Reliability
POPULATION BY RATIO OF INCOME TO POVERTY LEVEL
Total 4,228 100.0% 48
Under .50 597 14.1% 280
.50 to .99 618 14.6% 301
1.00 to 1.24 481 11.4% 286
1.25 to 1.49 132 3.1% 147
1.50 to 1.84 456 10.8% 268
1.85 to 1.99 123 2.9% 97
2.00 and over 1,821 43.1% 357
CIVILIAN POPULATION AGE 18 OR OLDER BY VETERAN STATUS
Total 3,402 100.0% 160
Veteran 335 9.8% 126
Nonveteran 3,067 90.2% 176
Male 1,713 50.4% 165
Veteran 311 9.1% 125
Nonveteran 1,402 41.2% 173
Female 1,689 49.6% 132
Veteran 24 0.7% 22
Nonveteran 1,665 48.9% 135
CIVILIAN VETERANS AGE 18 OR OLDER BY PERIOD OF
MILITARY SERVICE
Total 335 100.0% 126
Gulf War (9/01 or later), no Gulf War (8/90 to 8/01), no Vietnam Era 9 2.7% 15
Gulf War (9/01 or later) and Gulf War (8/90 to 8/01), no Vietnam Era 4 1.2% 9
Gulf War (9/01 or later), and Gulf War (8/90 to 8/01), and Vietnam Era 9 2.7% 15
Gulf War (8/90 to 8/01), no Vietnam Era 60 17.9% 55
Gulf War (8/90 to 8/01) and Vietnam Era 0 0.0% 13
Vietnam Era, no Korean War, no World War II 90 26.9% 70
Vietnam Era and Korean War, no World War II 1 0.3% 2
Vietnam Era and Korean War and World War II 0 0.0% 13
Korean War, no Vietnam Era, no World War II 0 0.0% 13
Korean War and World War II, no Vietnam Era 0 0.0% 13
World War II, no Korean War, no Vietnam Era 13 3.9% 20
Between Gulf War and Vietnam Era only 124 37.0% 84
Between Vietnam Era and Korean War only 25 7.5% 28
Between Korean War and World War II only 0 0.0% 13
Pre-World War II only 0 0.0% 13
HOUSEHOLDS BY POVERTY STATUS
Total 1,754 100.0% 149
Income in the past 12 months below poverty level 492 28.1% 131
Married-couple family 31 1.8% 30
Other family - male householder (no wife present) 16 0.9% 21
Other family - female householder (no husband present) 175 10.0% 82
Nonfamily household - male householder 114 6.5% 88
Nonfamily household - female householder 156 8.9% 78
Income in the past 12 months at or above poverty level 1,262 71.9% 196
Married-couple family 485 27.7% 139
Other family - male householder (no wife present) 94 5.4% 64
Other family - female householder (no husband present) 196 11.2% 74
Nonfamily household - male householder 194 11.1% 81
Nonfamily household - female householder 293 16.7% 110
Source: U.S. Census Bureau, 2015-2019 American Community Survey Reliability: high medium low
November 11, 2021
©2021 Esri Page 7 of 8
39CITY OF ELBERTON COMPREHENSIVE PLAN | 2022 - 2027
Community Data (cont.)
Northeast Georgia Region Unemployment Rate
(Not Seasonally Adjusted)
Northeast Georgia Region: 2.2%
5.2%
4.8%
4.5% 4.4%
4.2%
3.8% 3.9%
3.4% 3.5%
3.2%
2.8% 2.7%
2.2%
Sep-20 Oct-20 Nov-20 Dec-20 Jan-21 Feb-21 Mar-21 Apr-21 May-21 Jun-21 Jul-21 Aug-21 Sep-21
Note: Northeast Georgia Region includes Barrow, Clarke, Elbert, Greene, Jackson, Jasper,
Madison, Morgan, Newton, Oconee, Oglethorpe, and Walton counties.
Source: Georgia Department of Labor – Mark Butler, Commissioner
County Labor Force Estimates (not seasonally adjusted)
Place of Residence - Persons 16 Years and Older
Preliminary September 2021 Revised August 2021 Revised September 2020
Unemployment Unemployment Unemployment
Laborforce Employment Number Rate Laborforce Employment Number Rate Laborforce Employment Number Rate
Effingham 33,129 32,506 623 1.9 33,215 32,428 787 2.4 30,378 29,010 1,368 4.5
Elbert 7,886 7,646 240 3.0 7,900 7,616 284 3.6 7,734 7,215 519 6.7
Emanuel 8,362 8,076 286 3.4 8,514 8,144 370 4.3 8,299 7,667 632 7.6
Evans 5,011 4,897 114 2.3 5,072 4,929 143 2.8 4,917 4,665 252 5.1
Fannin 11,488 11,274 214 1.9 11,547 11,266 281 2.4 10,898 10,493 405 3.7
Fayette 57,817 56,747 1,070 1.9 57,665 56,264 1,401 2.4 54,573 51,905 2,668 4.9
Floyd 43,635 42,578 1,057 2.4 43,338 42,092 1,246 2.9 41,809 39,610 2,199 5.3
Forsyth 124,810 122,793 2,017 1.6 124,529 121,899 2,630 2.1 116,704 112,215 4,489 3.8
Franklin 9,850 9,613 237 2.4 9,910 9,619 291 2.9 9,527 9,042 485 5.1
Fulton 562,322 545,533 16,789 3.0 562,091 541,194 20,897 3.7 544,883 498,648 46,235 8.5
Gilmer 12,397 12,153 244 2.0 12,509 12,196 313 2.5 11,656 11,245 411 3.5
Glascock 1,229 1,208 21 1.7 1,258 1,228 30 2.4 1,194 1,158 36 3.0
Glynn 39,097 38,196 901 2.3 39,274 38,027 1,247 3.2 37,318 35,082 2,236 6.0
Gordon 28,539 27,961 578 2.0 28,647 27,928 719 2.5 27,330 26,112 1,218 4.5
Grady 10,592 10,366 226 2.1 10,769 10,475 294 2.7 10,227 9,827 400 3.9
Greene 7,030 6,861 169 2.4 7,128 6,916 212 3.0 6,779 6,412 367 5.4
Gwinnett 491,990 481,209 10,781 2.2 491,120 477,586 13,534 2.8 468,380 439,316 29,064 6.2
Habersham 18,205 17,802 403 2.2 18,327 17,803 524 2.9 17,884 17,068 816 4.6
Hall 104,630 102,870 1,760 1.7 104,328 102,039 2,289 2.2 98,625 94,705 3,920 4.0
Hancock 2,418 2,316 102 4.2 2,477 2,354 123 5.0 2,433 2,207 226 9.3
Haralson 12,595 12,316 279 2.2 12,589 12,236 353 2.8 11,863 11,235 628 5.3
Harris 16,544 16,233 311 1.9 16,700 16,221 479 2.9 15,887 15,297 590 3.7
Hart 11,489 11,197 292 2.5 11,592 11,239 353 3.0 10,987 10,470 517 4.7
Heard 5,225 5,098 127 2.4 5,243 5,079 164 3.1 4,929 4,656 273 5.5
40 Henry 116,300 113,130 3,170 2.7 115,994 112,061 3,933 3.4 112,078 103,658 8,420 7.5
Houston 72,034 70,499 1,535 2.1 72,155 70,128 2,027 2.8 68,555 65,315 3,240 4.7
Irwin 3,500 3,403 97 2.8 3,569 3,444 125 3.5 3,329 3,163 166 5.0
Jackson 41,880 41,239 641 1.5 41,433 40,621 812 2.0 39,039 37,590 1,449 3.7
Jasper 6,980 6,831 149 2.1 7,000 6,817 183 2.6 6,539 6,233 306 4.7appendix
Community Data (cont.)
-025
Elbert County
Numbers At A Glance:
Population: 20,074
Workforce | Population 16+ Employed: 86.8%
Annual median household income: $42,142
Total cost of housing and transportation
per household: $23,126
Commuter flow by number of people: (In) 2,217
(Out) 4,995
(Within) 2,735
Average vehicle miles traveled per
household: 22,565
Total cost of housing and transportation
(% of income): 63%
Annual housing costs per household: $10,282
Housing costs as a percentage of income: 27%
Owner-occupied housing units: 60.7%
Renter-occupied housing units: 22.1%
Average residential units per acre: 2.71 / 0.75
Poverty rate: 18.5%
Northeast Georgia Regional Commission
41CITY OF ELBERTON COMPREHENSIVE PLAN | 2022 - 2027
Community Survey Results
1. Are there any activities you would like to do in your community but cannot? Explain:
More festivals.
Yes, I usually drive to Athens, Hartwell or Greenwood once a week for grocery shopping, activities for the
kids, and meetings. We homeschool so my children do swim lessons and other extracurricular things out of
town.
Additional retail and dining.
This community has a small number of people who influence the public officials to oppose industry from
coming into the city or county if they disagree with the business or the type of business. Such as the
incinerator years ago. That incinerator would be helping our com-munity by leaps and bounds by now. It
would have created jobs and numerous other businesses as well. We have had countless other investors
that wanted to come into our community and were forced to go to other counties because of that and
it hurts everyone here. We have a major employer that is wanting to build here now that is being met with
this same group pf people now who doesn't want them to build anything.
Nothing will change if we don't allow investors in. We will or have become labeled by investors as the place
not to come because of the known group of people who will fight against them.
N/A
Swimming pool
Would like to see activities teens could do outside of school programs
2. Are the streets and sidewalks adequately maintained?
Yes (10)
No (2)
3. If no, where are the streets or sidewalks in most need of repair?
City streets are in poor condition and power lines are not cleared of tree limbs
UTILITY COVER AT JONES STREET 3WAY INTERSECTION NEEDS TO BE RAISED, TRAFFIC HAS TO GO
AROUND HOLE.
4. Is the community safe, comfortable, and inviting for people to walk or bike to activities, jobs, shopping, dining,
services, etc.?
Yes (9)
No (3)
5. Does your community have any traffic issues?
Yes (3)
No (9)
6. If yes, what are the specific traffic issues (check all that apply)
predictable peaks like rush hou,unsafe inconvenient to travel w
there aren't enough parking opt
it always takes too long to get,people sometimes get stuck in s, predictable peaks like rush hou,there aren't
enough parking opt
there aren't enough parking opt
7. In your opinion, is park space within your community easily accessible to all residents? If not, ex-plain:
Yes (6)
Parks are not accessible to resident that don’t have transportation
Wish there were more options
42You can also read