Consultation Presentation - Llywodraeth Cymru Welsh Government

Page created by Susan Casey
 
CONTINUE READING
Consultation Presentation - Llywodraeth Cymru Welsh Government
Llywodraeth Cymru
Welsh Government    Consultation Presentation
Consultation Presentation - Llywodraeth Cymru Welsh Government
•   To provide a strategy for the future
    supply of construction aggregates
    across Wales and within each
    Region
•   The strategy aims ensure that
    an adequate and steady supply
    of aggregates can be maintained,
    taking into account the key
    objectives of sustainable supply
    outlined in MTAN 1.
Consultation Presentation - Llywodraeth Cymru Welsh Government
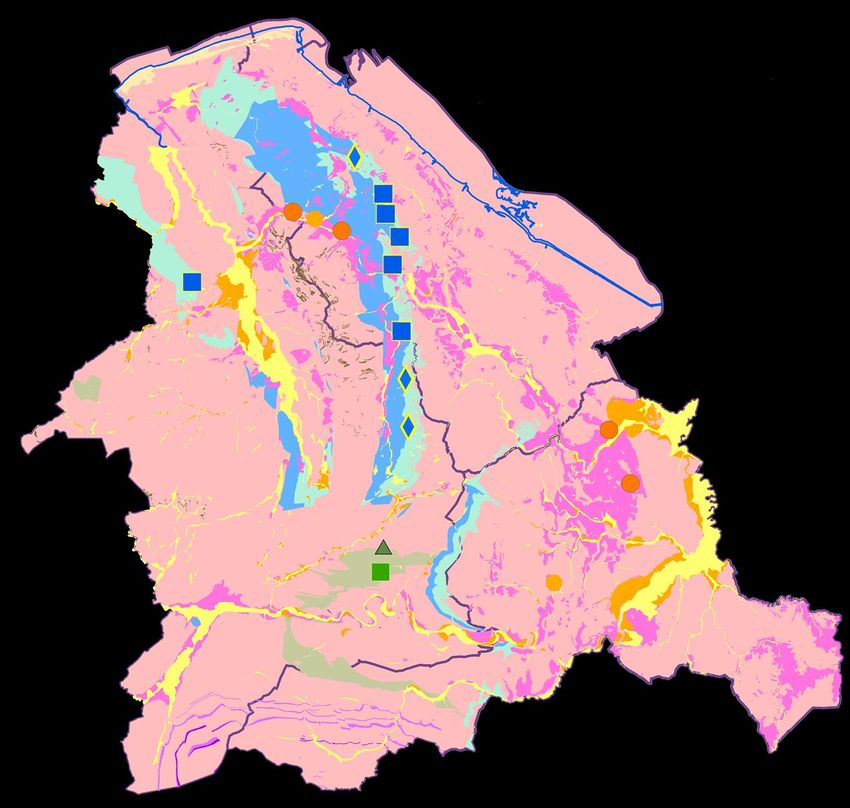
i.    to confirm or refine the existing
      methodology and update the
      current data/information inputs
      of the current RTS documents;
      and
ii.   to prepare new apportionments
      and an updated RTS for each
      RAWP region
      (identical to the 1st Review)
Consultation Presentation - Llywodraeth Cymru Welsh Government
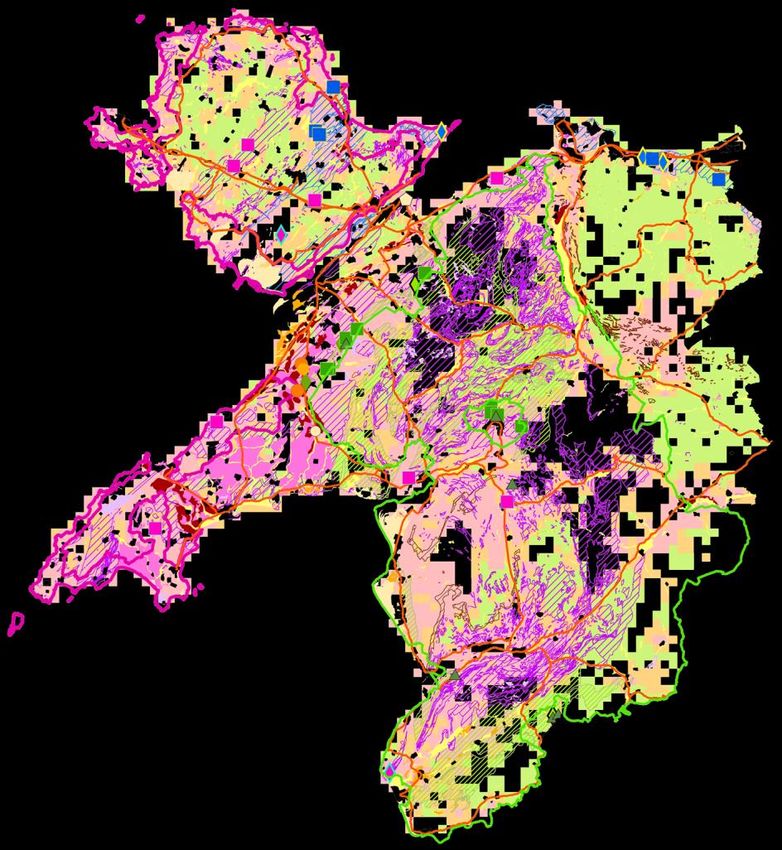
•   A landbank is the stock of reserves with planning
    permission for mineral extraction at active and inactive
    sites (MTAN 1 para. 45).
•   An allocation is the identification, within the LDP, of an
    area of land for future mineral working.
•   An apportionment is the rate at which the planning
    system requires provision to be made, in LDPs.
Consultation Presentation - Llywodraeth Cymru Welsh Government
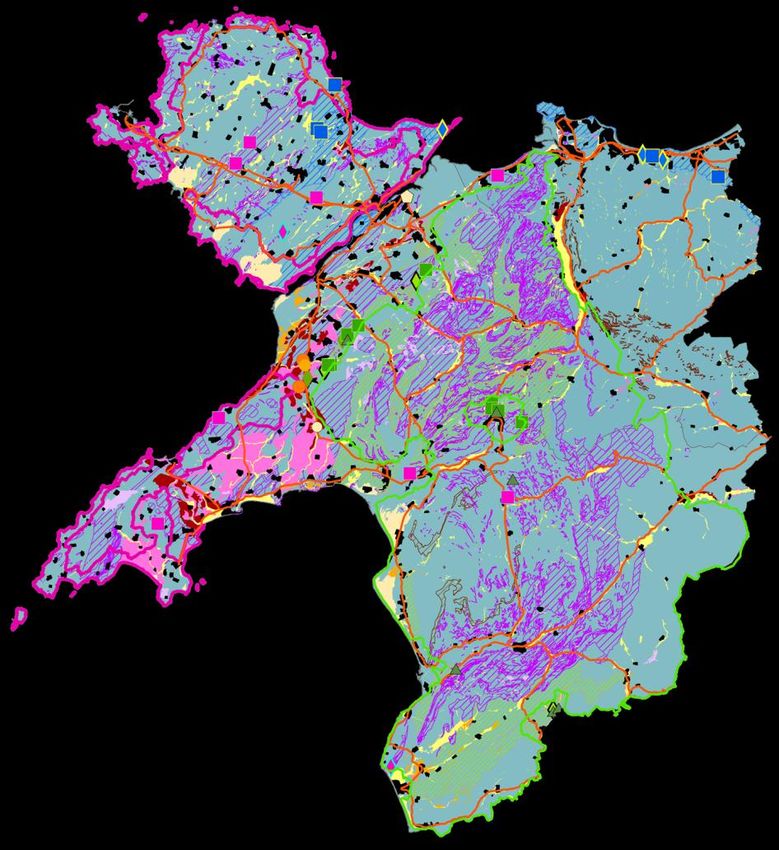
•   Provision is the total amount of aggregates required to
    be supplied from a local authority over the duration of its
    LDP. It may include both landbanks and allocations
    (subject to maintaining a minimum landbank of 10 years
    (CR) or 7 years (S&G) at all times throughout the entire
    Plan period).
•   For the purposes of this review, reserves at dormant sites
    are excluded from basic landbank calculations.
•   Such reserves are however required to be identified in
    Development Plans (MTAN 1 para. 47).
Consultation Presentation - Llywodraeth Cymru Welsh Government
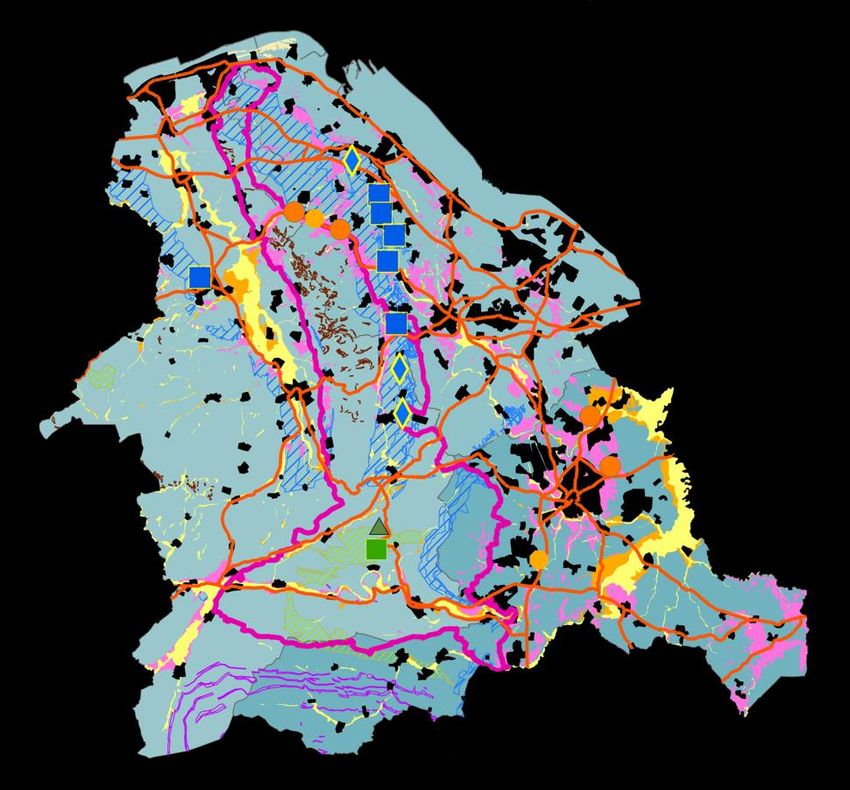
•   Each RTS needs to have a ‘horizon’ sufficiently far
    ahead for LPAs to draw upon when preparing their LDPs
•   To allow for the 15 year period of most individual LDPs,
    and the requirement to maintain a minimum 10 year
    landbank throughout this period, for crushed rock, the
    RTS ‘horizon’ needs to extend to 25 years.
Consultation Presentation - Llywodraeth Cymru Welsh Government
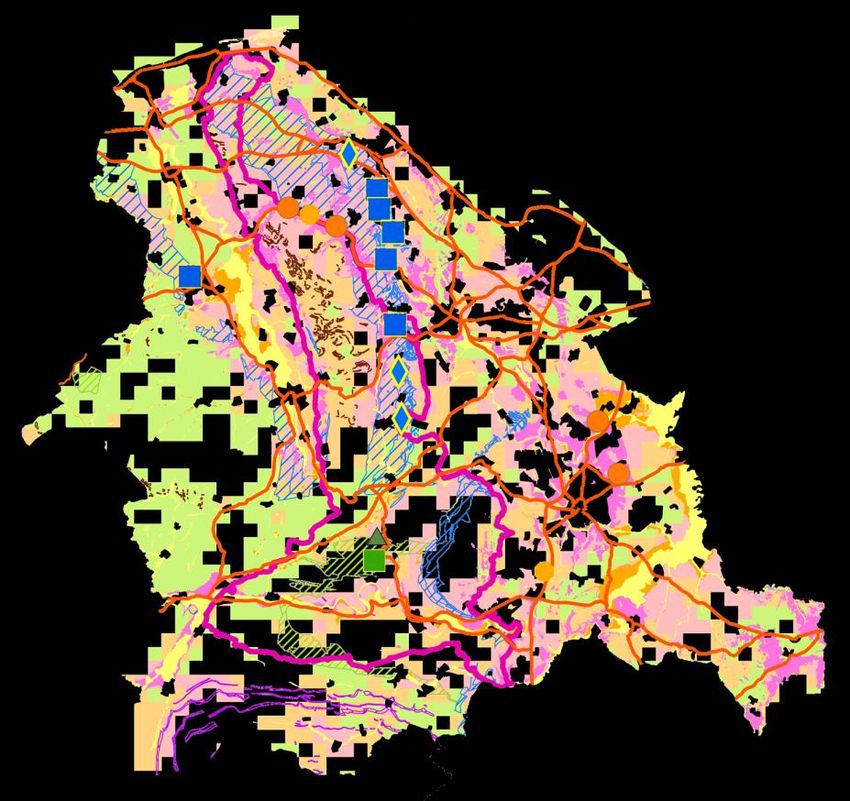
1. Assessment of the overall level of future aggregates
   provision required, on a National scale.
2. Calculation of the Regional split (N. Wales / S, Wales)
3. Examination of the existing pattern of supply, and
   determination of sub-regional & LPA apportionments.
4. Comparison with existing permitted reserves to
   determine the need, or otherwise, for new allocations
5. Consultation & Endorsement
6. Implementation by LPAs
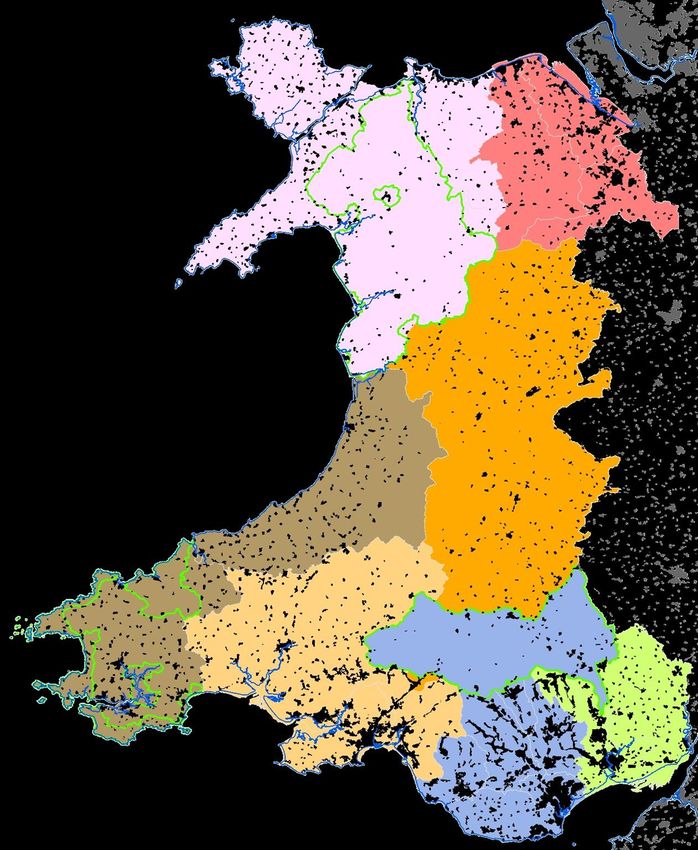
Consultation Presentation - Llywodraeth Cymru Welsh Government
North-East
     North-West   Wales
       Wales

               Powys

Swansea City             Former
                         Gwent
               Cardiff
                City
Consultation Presentation - Llywodraeth Cymru Welsh Government
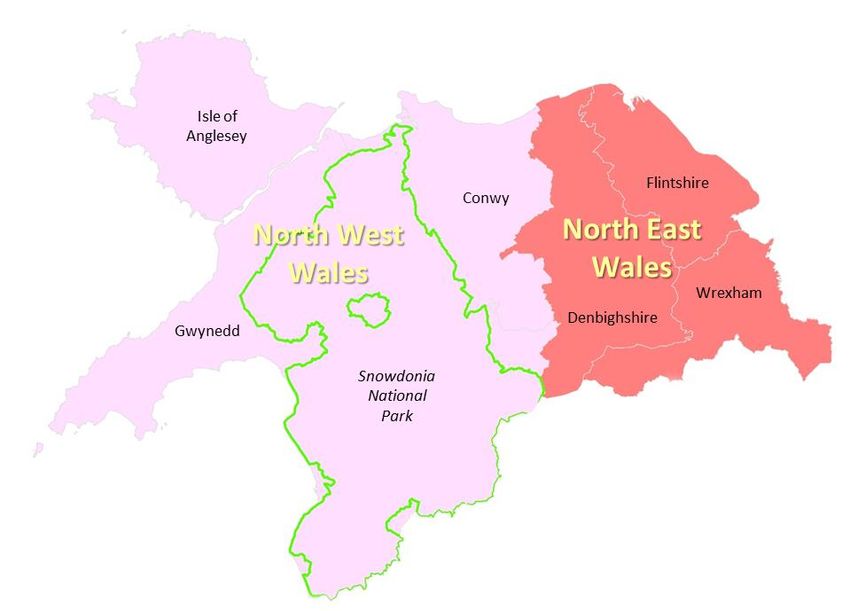
•   Calculation of historical sales averages over the most
    recent 10-year ‘baseline’ period (2007-2016) and over
    the most recent 3 years.
•   These figures represent the ‘residual’ demand for land-
    won primary aggregates (since alternative aggregates -
    secondary, recycled and marine - were also contributing to the
    market throughout this period).

•   Consideration of influences on future demand which
    might change over the next 10 years, compared to the
    baseline period.
Consultation Presentation - Llywodraeth Cymru Welsh Government
Table 3.2                                      10-yr Average          3-yr Average     Highest of 3-yr and
            Unitary Authority              Aggregate Sales (total)   Aggregate Sales   10-yr ave. sales in
                                                  (mtpa)              (total) (mtpa)    each LPA (mtpa)
            Blaenau Gwent                          0.170                 0.180               0.180
            Brecon Beacons National Park           0.490                 0.540               0.540
            Bridgend                               0.580                 0.600               0.600
            Caerphilly                             0.390                 0.100               0.390
            Cardiff                                0.830                 1.060               1.060
            Carmarthenshire                        0.832                 0.821               0.832
            Ceredigion                             0.300                 0.240               0.300
            Conwy + Snowdonia NP                   0.955                 0.813               0.955
            Denbighshire                           0.329                 0.043               0.329
            Flintshire                             2.663                 3.204               3.204
            Gwynedd                                0.868                 0.898               0.898
            Isle of Anglesey                       0.236                 0.255               0.255
            Merthyr Tydfil                         0.150                 0.010               0.150
            Monmouthshire                          0.070                 0.060               0.070
            Neath Port Talbot                      0.460                 0.300               0.460
            Newport                                0.000                 0.000               0.000
            Pembrokeshire                          0.510                 0.360               0.510
            Pembrokeshire Coast NP                 0.330                 0.270               0.330
            Powys                                  2.470                 2.650               2.650
            Rhonda Cynon Taf                       0.610                 0.670               0.670
            Swansea                                0.000                 0.000               0.000
            Torfaen                                0.000                 0.000               0.000
            Vale of Glamorgan                      0.660                 0.580               0.660
            Wrexham                                0.435                 0.514               0.514
            TOTAL, Wales                                                                    15.557
Figure 3.3: Total Aggregate Sales vs GDP Annual % Change (UK),
                                                     2001 - 2016 (Correlation)
                                                                  20.0
Total Aggregate Sales (mtpa)

                                                                  18.0

                                      y = 0.7513x + 14.589        16.0
                                       R² = 0.2013
                                                                  14.0

                                                                  12.0

                                                                   10.0
                     -4.5      -3.5     -2.5        -1.5         -0.5                 1.5       2.5      0.5
                                                                                                          3.5      4.5
                                                                                    Figure 3.4: Total Aggregate Sales  vs GDP Annual % Change (UK),
                                                             GDP Annual Change (UK)                     2001 - 2016 (time series)
                                                                                                                                                                                                   5
                                                                                                         20.00                                                                                     4
                                                                                                                                                    Total Aggregate Sales
                                                                                                                                                                                                   3
                                                                          Total Aggregate Sales (mtpa)

                                                                                                                                                                                                        GDP Annual % Change
                                                                                                         18.00
                                                                                                                                                                                                   2
                                                                                                                                                                                                   1
                                                                                                         16.00
                                                                                                                         Annual % Change in GDP                                                    0
                                                                                                                                                                                                   -1
                                                                                                         14.00
                                                                                                                                                                                                   -2

                                                                                                         12.00                                                                                     -3
                                                                                                                                                                                                   -4
                                                                                                         10.00                                                                                     -5
                                                                                                                 2001 2002 2003 2004 2005 2006 2007 2008 2009 2010 2011 2012 2013 2014 2015 2016
                                                                                                                                                      Year
Figure 3.1: Correlation of Total Aggregate Sales with Annual House
                                                               Completions (Wales, 2001 - 2016)

                                      21.00
Annual Total Aggregate Sales (mtpa)

                                      19.00

                                      17.00

                                                                                                                     y = 0.0023x - 0.3436
                                      15.00                                                                           R² = 0.9263

                                      13.00
                                                                                                                             Figure 3.2: Annual Aggregate Sales and Housing Completions Time Series
                                                                                                                                                      (Wales, 2001 to 2016)
                                                                                                               10000
                                      11.00
                                           5000   5500     6000    6500     7000    7500                              8000       8500       9000    9500                                                     21
                                                                                          9000
                                                                     Annual Housing Completions

                                                                                                                                                                                                                  Annual Total Aggregate Sales (mtpa)
                                                                                                                                                                 Total
                                                                                                                                                                                                             19
                                                                                       Annual Housing Completions
                                                                                                                                                                 Aggregate
                                                                                                                    8000                                         Sales
                                                                                                                                            Housing                                                          17
                                                                                                                                            Completions
                                                                                                                    7000
                                                                                                                                                                                                             15

                                                                                                                    6000
                                                                                                                                                                                                             13

                                                                                                                    5000                                                                                     11

                                                                                                                    4000                                                                                     9
                                                                                                                           2001 2002 2003 2004 2005 2006 2007 2008 2009 2010 2011 2012 2013 2014 2015 2016
                                                                                                                                                                YEAR
Table 3.3

                                                                      Planned       Annualised    Average House
                                                         Plan          Future         Future       Completions
            Unitary Authority            Plan Status                  Housing        Housing         per year
                                                        period
                                                                    Requirements   Requirements   (2007 – 2016)
            Blaenau Gwent                  Adopted      2006-2021      3,500           233             99.1
            Bridgend                       Adopted      2006-2021      8,153           544             365
            Caerphilly                     Adopted      2006-2021      8,625           575            335.2
            Cardiff                        Adopted      2006-2026     41,415          2,071           825.3
            Carmarthenshire                Adopted      2006-2021     15,197          1,013           517.8
            Ceredigion                     Adopted      2007-2022      6,000           400            126.1
                                                        2007-22 &
            Conwy +Snowdonia               Adopted                     7,350           490            178.6
                                                         2016-31
            Denbighshire                   Adopted      2006-2021      7,500           500            156.2
            Flintshire                    in progress   2015-2030      6,950           463            288.6
            Gwynedd + Isle of Anglesey     Adopted      2011-2026      7,184           479            280
            Merthyr Tydfil + Brecon
                                           Adopted      2006-2021      4240            283            133.2
            Beacons National Park
            Monmouthshire                  Adopted      2011-2021      4,500           300            228.6
            Neath Port Talbot              Adopted      2011-2026      7,800           520            274.3
            Newport                        Adopted      2011-2026     10,350           690            527.5
            Pembrokeshire + PCNP           Adopted      2011-2026      7,299           487             240
            Powys                          Adopted      2011-2026      4,500           300            191.7
            Rhonda Cynon Taf               Adopted      2006-2021     14,385           959            373.9
            Swansea                       in progress   2010-2025     15,600          1,040           519.4
            Torfaen                        Adopted      2006-2021      4,700           313            174.6
            Vale of Glamorgan              Adopted      2011-2026      9,460           631            284.3
            Wrexham                       in progress   2013-2028      7,750           517            304.2
            TOTAL, Wales                                             202,458        12,808          6,423.6
Figure 5.1: Value of Construction Output by Type of Work (Great Britain)

£120,000
                         All Construction

                         Total Other Construction
£100,000
                         Total Housing

                         Total Infrastructure
 £80,000

 £60,000

 £40,000

 £20,000
                                                                                                                                 30%
     £0
           2001   2002     2003    2004     2005    2006   2007   2008   2009   2010   2011   2012   2013   2014   2015   2016
•       (from the 1st Review)
    ➢    Caernarfon bypass construction;
    ➢    North Wales Gateway Project, including redevelopment of the Shotton
         steelworks sites and of the former RAF Sealand site near Queensferry;
    ➢    New nuclear power station at Wylfa on the Isle of Anglesey;
    ➢    Numerous large scale wind farm proposals (land-based and offshore);
    ➢    Possible future expansion of Harwarden as a Regional Airport and to
         accommodate Airbus manufacturing; and
    ➢    A55 North Wales coast road upgrade.
    ➢    M4 (toll) Newport Relief Road
    ➢    Swansea Bay tidal lagoon
    ➢    Severn Barrage (subject to further evidence on economic feasibility)
    ➢    Various large scale wind farm proposals
•   Sum of the highest of the 10-yr or 3-yr historical sales
    averages for each LPA (= 15.557 mtpa)
•   Then allow for the fact that the planned provision for
    housing in Wales is set to double …
•   … and that housing is very strongly correlated with
    aggregate sales, and accounts for around 30% by value
    of all construction …
•   So the national level of overall provision should be set
    at 130% of the historical sales average …
•   = 20.224 mtpa (similar to pre-recession figure of 20.11 in 2007)
•   North Wales supplies between 34% and 41% of the
    national total, averaging 38.26%
•   So, N. Wales Provision = 38.26% x 20.224 = 7.738 mtpa
•   (12.5% higher than the provision of 6.88 mtpa in 1st Review)

•   South Wales supplies between 59% and 66% of the
    national total, averaging 61.74%
•   So, S. Wales Provision = 61.74% x 20.224 = 12.486 mtpa
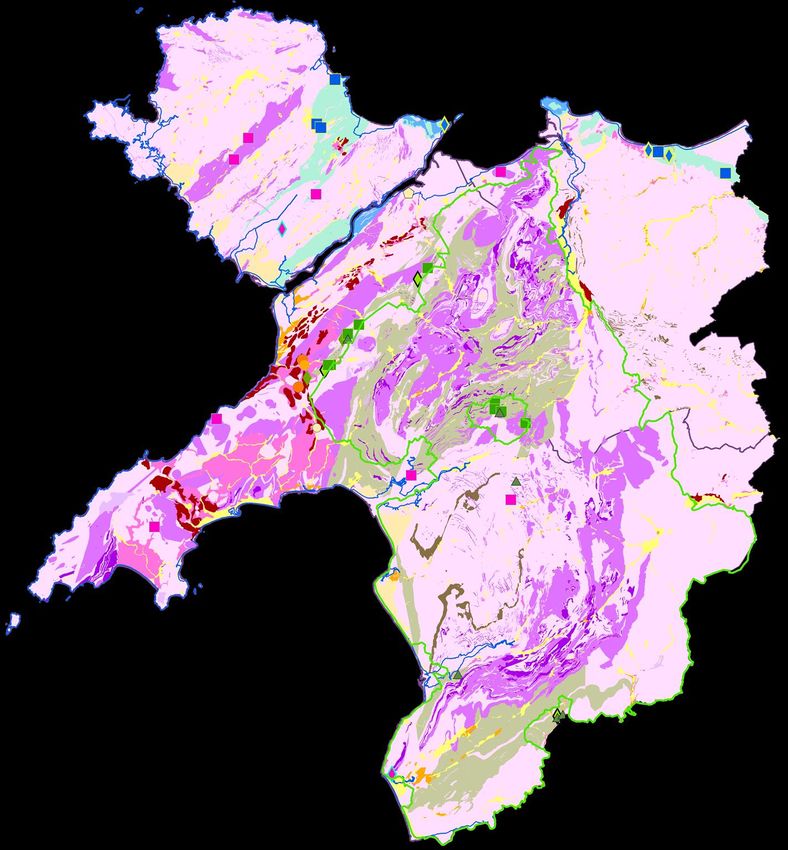
•   (15.6% higher than the provision of 10.80 mtpa in 1st Review)
Sub-Regional Issues:
North-East Wales
                Quarries
                                 Inactive or
  Active         & Pits           Dormant
                Limestone
               (excl. cement)
                Sandstone
                  Igneous

                   Slate

               Slate Waste

              Sand & Gravel

 Crushed Rock Resources
        Carboniferous & older HSA Sandstone
        Carboniferous Limestone (high purity)
                                                             BGS
        Carboniferous Limestone (other)                      resource
        Slate                                                mapping
        HSA Dolerite
        Other Igneous Rock resources

 Land-based Sand & Gravel Resources
         Sub-alluvial deposits
         River Terrace deposits                BGS
         Glaciofluvial deposits                resource
         Other Glacigenic deposits             mapping
         Blown Sand deposits
  BGS data reproduced under Licence No. 2009/051AA British
  Geological Survey © NERC. All rights reserved
Annualised Housing Requirements                                   Crushed Rock Resources
                                   in Adopted LDPs (houses per year)                                        Carboniferous & older HSA Sandstone
                                            233 (Blaenau Gwent)                                             Carboniferous Limestone
                                                                                                            Slate
                                                                                                            Igneous including HSA Dolerite

                                            463 (Flintshire)                                         Land-based Sand & Gravel
                                            500 (Denbighshire)
                                                                                                            Sub-alluvial deposits
                                            517 (Wrexham)
                                                                                                            River Terrace deposits                BGS
                                                                                                            Glaciofluvial deposits                resource
                                                                                                            Other Glacigenic deposits             mapping
                                                                                                            Blown Sand deposits
                                                                                                     BGS data reproduced under Licence No. 2009/051AA British
                                                                                                     Geological Survey © NERC. All rights reserved
                                            2071 (Cardiff)

Main urban areas

National Parks

AONBs
                   Environmental Capacity *
                     Relatively Low Environmental Capacity*
                     Medium Environmental Capacity*
                     Relatively High Environmental Capacity*
                     Areas not assessed*
                     * Assessed as part of the ‘IMAECA’ project, (Implementing the Methodology for
                     Assessing the Environmental Capacity for Primary Aggregates - Enviros, 2005).
Sub-Regional Issues:
North-West Wales
                      Quarries
                                      Inactive or
       Active          & Pits          Dormant
                      Limestone
                     (excl. cement)
                      Sandstone
                        Igneous

                          Slate

                     Slate Waste

                    Sand & Gravel

Crushed Rock Resources
       Carboniferous & older HSA Sandstone
       Carboniferous Limestone (high purity)
                                                    BGS
       Carboniferous Limestone (other)              resource
       Slate                                        mapping
       HSA Dolerite
       Other Igneous Rock resources

Land-based Sand & Gravel Resources
       Resource blocks identified by WG research
       Sub-alluvial deposits
       River Terrace deposits        BGS
       Glaciofluvial deposits        resource
       Other Glacigenic deposits     mapping
       Blown Sand deposits
BGS data reproduced under
Licence No. 2009/051AA
British Geological Survey.
© NERC. All rights reserved
Annualised Housing Requirements
in Adopted LDPs (houses per year)
     233 (Blaenau Gwent)

     2071 (Cardiff)

                                    Environmental Capacity *
                                      Relatively Low Environmental Capacity*
                                      Medium Environmental Capacity*
                                      Relatively High Environmental Capacity*
                                      Areas not assessed*
                                      * Assessed as part of the ‘IMAECA’ project, (Implementing the Methodology for
                                      Assessing the Environmental Capacity for Primary Aggregates - Enviros, 2005).
OPTION A                                      OPTION B                          Preferred
                                                                               Resulting                                     Resulting        Annualised
                                             highest of 10-                                    Annualised
                                                                                                                                            Apportionments
             Local Planning                    yr and 3yr
                                                              % share of
                                                                              Annualised
                                                                           Apportionments
                                                                                                 Future     % share of      Annualised
                                                                                                                         Apportionments         (mtpa)
                                                  Ave.
                                                              Regional     for all Land-Won
                                                                                                 Housing       Sub-
                                                                                                                         for all Land-Won
                                                                                                                                                                                  Qualitative Observations
               Authority                       Aggregate
                                                                 total          Primary
                                                                                              Requirement   Regional          Primary
                                                                                                                                             [By default = Option A, but
                                                                                                                                            modified in some cases (red
                                              Sales (total)                                    from Local      total                         figures) to allow for Option
                                                                             Aggregates1                                   Aggregates2
                                                 (mtpa)                                           Plans                                     B or qualitative observations
                                                                                 (mtpa)                                        (mtpa)       as noted in column to right]

             N. WALES TOTAL (from Stage 2)                                                         7.738
                                                                                                                                                                            The existing supply pattern here (Option A)
            NE Wales Sub-Region                4.047          65.75%          5.088             1,480       100.00%         5.088                 5.088                     provides an appropriate balance between market
                                                                                                                                                                            forces (including substantial exports) and the
                                                                                                                                                                            availability of unconstrained resources. Flintshire
                        Denbighshire           0.329          5.35%           0.414              500        33.78%          1.719                 0.860                     has much higher aggregate sales than
                                                                                                                                                                            Denbighshire, despite similar housing
                                                                                                                                                                            requirements. This reflects local market distortion
                                                                                                                                                                            by exports to NW England. The slight modification
                             Flintshire        3.204          52.06%          4.028              463        31.28%          1.592                 3.582                     shown within the preferred apportionment figures
                                                                                                                                                                            is to make the best use of existing landbanks and
                                                                                                                                                                            thereby reduce future allocation requirements
                                                                                                                                                                            overall. Wrexham supplies only sand & gravel as
                             Wrexham           0.514          8.35%           0.646              517        34.93%          1.777                 0.646                     its limestone resources are largely constrained by
                                                                                                                                                                            the AONB.

                                                                                                                                                                            The existing supply pattern in NW Wales is well
            NW Wales Sub-Region                2.108          34.25%          2.650              969        100.00%         2.650                 2.650                     balanced with the distribution of planned
Table 5.2

                                                                                                                                                                            housing provision and is unaffected by exports.
            Conwy + Snowdonia NP               0.955          15.52%          1.201              490        50.57%          1.340                 1.201                     Option A should therefore be used. Supplies are
                                                                                                                                                                            sourced primarily from outside the National Park
                                                                                                                                                                            and AONBs and are well distributed between the
                             Gwynedd           0.898          14.59%          1.129                                                               1.129                     main producing areas of Conwy and Gwynedd,
                                                                                                 479        49.43%          1.310                                           with more limited supplies from Anglesey to local
                     Isle of Anglesey          0.255          4.14%           0.321                                                               0.321                     markets.
•   Comparison of the total apportionments over 22 years
    for sand & gravel, or 25 years for crushed rock (or 30
    years in Cardiff), with the size of existing landbanks
    reveals where there are shortfalls of available reserves
    and thus a need for new allocations
Table 5.4
                              Overall                                                                                  Surplus or
                                             Historic          New                          Existing                                       Minimum         Additional
                            ‘Preferred’                                       Total                                  Shortfall (-) of
 Local Planning                            proportion       Annualised                     permitted      Existing                        Allocation      reserves at
                          Apportionment                                   Apportionment                                 Existing
                                          supplied from   Apportionment                   reserves at   landbank6                       needed to meet      Dormant
                                                                          Required over                                Permitted
   Authority               (S&G & CR)1    sand & gravel     for sand &
                                                                             22 years
                                                                                          end of 2016     (years)
                                                                                                                        Reserves
                                                                                                                                           Required       sites, 20164
                               (mt)         sources2       gravel3 (mt)                     in mt4, 5                                   Provision7 (mt)       (mt)
                                                                                                                          (mt)

         Denbighshire        0.860          0.00%            0.000           0.000          0.000         n/a           0.000              0.000               0
             Flintshire      3.582          6.23%            0.223           4.912          1.369         6.1           -3.543             3.543             0.5
            Wrexham          0.646         100.00%           0.646          14.217         12.652         19.6          -1.565             1.565               0
Conwy + Snowdonia NP         1.201          0.00%            0.000           0.000          0.000         n/a           0.000              0.000               0
             Gwynedd         1.129         15.44%            0.174           3.834          1.175         6.7           -2.659             2.659               0
      Isle of Anglesey       0.321          0.00%            0.000           0.000          0.000         n/a           0.000              0.000               0
Sub-totals, North Wales     7.738          13.40%           1.044           22.963        15.196                       -7.767             7.767              0.5
Table 5.6
                               Overall                                                                                       Surplus or
                                               Historic                                         Existing                                         Minimum
                                                           New Annualised       Total                                      Shortfall (-) of                       Additional
 Local Planning              ‘Preferred’
                           Apportionment
                                             proportion
                                           supplied from
                                                           Apportionment    Apportionment
                                                                                               permitted
                                                                                            reserves at end
                                                                                                                Existing
                                                                                                              landbank6
                                                                                                                              Existing
                                                                                                                                                Allocation
                                                                                                                                              needed to meet
                                                                                                                                                                 reserves at
                                                             for crushed    Required over                                    Permitted                          Dormant sites,
   Authority                (S&G & CR)1     crushed rock
                                                              rock3 (mt)       25 years
                                                                                            of 2016 in mt4,     (years)
                                                                                                                              Reserves
                                                                                                                                                 Required
                                                                                                                                                                 20164 (mt)
                                (mt)          sources2                                             5                                          Provision7 (mt)
                                                                                                                                (mt)

          Denbighshire       0.860         100.00%            0.860           21.500          21.710           25.2          0.210              0.000                0
              Flintshire     3.582          93.77%            3.359           83.968          48.040           14.3         -35.928            35.928              1.41
             Wrexham         0.646          0.00%             0.000            0.000          0.000            n/a           0.000              0.000                0
Conwy + Snowdonia NP         1.201         100.00%            1.201           30.016          62.500           52.1         32.484              0.000              0.25
              Gwynedd        1.129          84.56%            0.955           23.867          28.540           29.9          4.673              0.000                0
       Isle of Anglesey      0.321         100.00%            0.321            8.015          14.400           44.9          6.385              0.000                0
 Sub-totals, North Wales     7.738         86.60%            6.695          167.366          175.19                                            35.928              1.66
•   Allocations should ideally take the form of Specific Sites,
    where sufficiently detailed information exists.
•   Where that is not possible, they should normally take the
    form of Preferred Areas, within which operators should
    be encouraged to bring forward more specific proposals.
•   As a last resort, where there is no information on the
    quantity or quality of potential resources, allocations
    may need to be in the form of Areas of Search …. but
    these would need to give the potential for the release of
    new reserves which are far greater than the minimum
    allocation recommended, in order to allow for the
    uncertainties involved.
•   Consultation with the Steering Group to check and refine
    technical data and to review each draft of the RTS;
•   Consultation with the full RAWPs on the 3rd draft to
    obtain approval for wider consultation;
•   Public consultation over 3 months including publication
    on RAWP websites and two consultation events;
•   Revision of RTS and final Steering Group review;
•   Political endorsement by each LPA
•   Final endorsement by WG.
•   The RTS provides strategic recommendations to each LPA
    regarding the apportionments and allocations which may
    need to be made in their LDP, to ensure that adequate
    provision is maintained throughout the relevant Plan
    Period.
•   Paragraph 50 of MTAN 1 specifically requires the relevant
    parts of the RTS strategy to be incorporated into
    individual LDPs.
•   … however …
•   Where it is justified by new evidence, it is open for
    individual LPAs to depart from the apportionment and
    allocation figures recommended by the RTS.
•   In doing so, an LPA would need to demonstrate that their
    intended departure would not undermine the overall
    strategy provided by the RTS itself (e.g. by working
    together with other LPAs to ensure that sub-regional and
    regional totals are still achieved)
•   To reinforce that concept, this Review introduces a new
    requirement for all LPAs within each sub-region to agree
    a Sub-Regional Statement of Collaboration, and for this
    to be approved by the RAWP, prior to the Examination of
    any individual LDP within that area.
•   Where the local authorities involved are unable to
    reach agreement, or if individual local authorities do
    not accept the Regional Technical Statement, the
    Welsh Government will consider its default powers to
    intervene in the planning process, as a last resort
    (MTAN 1, paragraph A3).
You can also read