Consumers Unmasked - EPAM
←
→
Page content transcription
If your browser does not render page correctly, please read the page content below
REPORT   |   STAGE 2   |   WINTER 2021

Consumers
Unmasked
Another year has come and gone, and consumer behaviors are in a constant
state of flux. In our latest survey, as part of a 12-month study of consumer
attitudes and actions, EPAM Continuum digs deep into quantitative findings to
help lifestyle brands understand which habits are here to stay and why.

Contents

1. Foreword ....................................................................................... 3

2. Findings at a Glance .. ................................................................... 6

3. Spending Habits by Sector ......................................................... 11

      Food    . . ..........................................................................................12
      Fashion     ....................................................................................... 20
      Fitness    ........................................................................................ 25
      Travel    ......................................................................................... 30
      Home     . . ........................................................................................ 35

4. Themes from a Pandemic.......................................................... 39

5. Conclusion . . ................................................................................ 49
1. Foreword
1. FOREWORD

The past year changed consumers...
To find out how and how much, EPAM Continuum is continuing its
12-month study of consumer behavior and perceptions.
For all businesses, especially consumer-facing ones, 2021 was    To measure the evolving consumer mindset, EPAM launched
(another) year of sometimes bewildering change. Customer         Consumers Unmasked, a year-long study into the changing shape
sentiment remains a moving target; a complex and inevitably      of customer attitudes and behaviors centered around five key
personal calculation balancing in-store shopping against         sectors – food, fashion, travel, fitness and home – across the U.S.,
online, value against ethics and COVID risk against the desire   the U.K. and Germany.
to experience social situations.

The EPAM
Consumer Council
Joining us on the journey are the EPAM Consumer
Council, 71 Millennial and Gen-Z shoppers from
each of our five sectors.

In our first report, the council gave us insights
into their mood as lockdowns eased. They spoke
of prioritizing seeing friends and loved ones again.
They were excited for a world slowly returning to
normalcy, but this was tempered by some concern
and even anxiety about moving too quickly.

In this report, we explored their buying habits by
asking three key questions:

1. Where has the needle settled in the balance
   between physical and online?

2. Does price still rule over brand ethics,
   sustainability and social responsibility?

3. How is loyalty changing and is the pandemic
   having an effect?

                                                                                                                                        4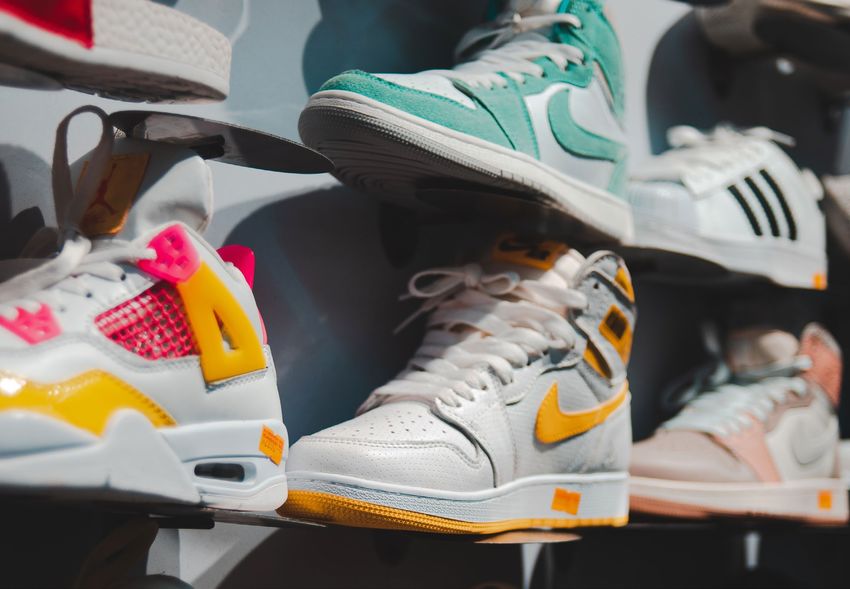
1. FOREWORD

Stage 2: Exploring Insights on a Broader Scale
While the first stage of the Consumers Unmasked study was                  Each of the territories in our survey had made progress in opening
qualitative, the second is quantitative. In this report, we’ll share the   their societies and easing lockdown restrictions, but not every
results of our survey of more than 3,000 shoppers to pressure test         consumer enjoyed total freedom. Some of our shoppers faced a
the insights we gained from our Consumer Council on a broader              range of vaccine passport-related restrictions. Some did not. But for
scale and investigate how the picture is developing. With the help         everyone, COVID continued to exert its influence on where and how
of industry experts, this report digs deeper into those insights,          they chose to shop, travel, exercise and more.
exploring what it all means for business, with recommendations to
                                                                           COVID may not always have been explicitly mentioned in our
help retailers respond.
                                                                           consumers’ comments or the data we collected, but it continued to
We also set the latest results in context by referring to our findings     provide the shifting backdrop to our study.
when we last spoke to our Consumer Council in the first stage.
We’re not drawing direct comparisons because the sample size and
survey format differ. Taken together, however, they paint a picture
                                                                           …while Omicron spikes
of the current consumer mindset, helping us understand which               At the time of publishing, the Omicron strain had just been detected,
buying habits are sticking, why this is happening and how behaviors        and new restrictions were introduced in countries around the globe.
are translating into sustained actions.                                     The situation accentuates many of the themes identified in this
                                                                           report. While many consumers may “finally feel free again,” many still
Delta stabilizes…                                                          err on the side of caution, sensing that things can quickly change
                                                                           again. These sentiments demonstrate that consumers are, and will
The post-lockdown mood of our shoppers was generally
                                                                           for the foreseeable future, be living in a constant state of uncertainty,
optimistic as they anticipated a return to something closer to
                                                                           and that uncertainty will form a big part of the way we consume.
normalcy (see The post-lockdown mood... on page 9). But
caution remained. At the time the survey was conducted,
COVID cases were declining in the U.S., while the Delta variant
was driving a spike in cases across the U.K. and parts of Germany
with corresponding restrictions varying.

Methodology & Project Timeline

                                             CURRENT STAGE

AUGUST 2021                               DECEMBER 2021                         MARCH 2022                                JUNE 2022

Stage 1:                                   Stage 2:                             Stage 3:                                  Stage 4:
Qualitative Study                          Quantitative Survey                  Quantitative Survey                       Qualitative Study
with Consumer Council,                     of 3,005 citizens in                 3,000+ citizens in                        with Consumer Council,
71 Millennial and Gen-Z                    the U.K., the U.S. and               the U.K., the U.S. and                    71 Millennial and Gen-Z
consumers in the U.K., the                 Germany, including our               Germany, including our                    consumers in the U.K.,
U.S. and Germany                           Consumer Council                     Consumer Council                          the U.S. and Germany

                                                                                                                                                       5
2.
Findings at
a Glance
We asked our shoppers to tell us about
their food, fashion, fitness, home and travel
buying habits. This is a summary of what
their comments revealed...

2. FINDINGS AT A GL ANCE

Sector Insights

Food                                         Fashion                                     Travel
Fresh and fast: This is the overriding       Online shopping may be accelerating,        In our first study, trust was the key factor for
message from our shoppers and it’s the       but there’s still value in both digital     our shoppers: trust that their travel provider
driver behind the explosion in food app      and physical for our shoppers and an        would survive the pandemic and trust that
usage throughout the pandemic. But how       expectation that retailers will make        their money was safe. Trust is still important,
can brands meet expectations of quality      omnichannel seamless. And, while            but its nature is shifting.
and price when there’s also an               shoppers say brand ethics are important,
ever-increasing need for speed?              their actions don’t always add up.          Our survey found:

Our survey found:                            Our survey found:                           • Overseas travel is set to grow (slowly).

• Delivery app popularity has soared.        • Consumers are more comfortable            • Some COVID discomfort remains
                                               than they were three months ago.            for flights, but…
• Consumers are spending more
  on eating out and takeaway.                • Online shopping continues                 • …affordability is a bigger factor than
                                               to accelerate.                              COVID for those not going on vacation.
• Business model opportunities
  are abundant in delivery.                  • Hybrid is now “business as usual”         • New trust considerations
                                               for most.                                   shape travel company choice.
• Eating in or dining out is an impulse
  decision as consumer comfort rises.        • Price dominates, but style
• Freshly prepared matters most.               and quality matter, too.
                                             • The pandemic has changed the
                                               nature of loyalty in fashion buying.
                                             • Shopper aspirations don’t
                                               align with their actions.

Fitness                                      Home
More than half of people who paid for        Spend is up. Online shopping is growing.    LEARN MORE IN-DEPTH
fitness (via gyms, in-person classes,        Yet, with in-person buying still popular,   SECTOR INSIGHTS ON
personal trainers, etc.) pre-pandemic have   there is an opportunity for the retailers   PAGE 11
stopped, but other spending trends are       best able to harness tech to recreate the
prominently on the radar. What does that     experience at home.
mean for fitness retailers?
                                             Our survey found:
Our survey found:                            • Homeware spending is increasing.
• People are paying for fitness –            • Online is the most prominent
  but not at the gym.                          channel for home purchases.
• Home exercise is now preferred.            • Convenience beats value and
• Motivation and a sense of community          choice in online homeware.
  drove those who returned to gyms.          • Choice and physical presence
• Nike’s dynamism and reliability land         feed IKEA’s dominance.
  them as a crowd favorite.

                                                                                                                                            7
2. FINDINGS AT A GL ANCE

Themes from a Pandemic
Our survey revealed numerous sector-specific insights, but many of the broad themes
arising from our study have the potential to affect every sector. These include:

1.                                             2.                                             3.
 onsumers (still) want
C                                              Discounts need to count.                       Convenience is the bedrock
value for money.                                                                              of the buying experience.
                                               Consumers want promotions, discounts
Value for money comes before                   and flexible payment options – without         Convenience is the most important
low prices and quality as the                  the inconvenience of having to search          shopping consideration, ahead of
most important factor when                     for the best deals.                            delivery speed and discounts.
purchasing a product or service.
                                               Recommendations:                               Recommendations:
Recommendations:                               • Deliver the right discounts in               • Don’t silo convenience – use it as
• Understand and respond to the way value        the right way.                                 an opportunity to refine processes
  perceptions change by channel.               • Treat discounts as more than                   and product range.
• Make every sale feel like a ‘win.’             a quick, short-term win.                     • Increase the power of apps.
                                                                                              • Bring in-person into consumer homes.

4.                                             5.                                             6.
Honesty and transparency                       Brand communities give                         Omnichannel is the default –
are held in high regard.                       consumers more to be loyal for.                but consumers want to choose.
Consumers want brands to be vocal about        Consumers feel more loyal to brands            In most cases, online is the primary
their values and ethics. Additionally, clear   that supported them during the pandemic,       channel with physical shops now playing
communication around practices of safety       with 61% saying they wanted to feel part       a supporting role. But consumers expect
and well-being is key, especially in travel.   of a brand community.                          to have the choice of where to buy.

Recommendations:                               Recommendation:                                Recommendations:
• Be clear on transparency.                    • Build a community with value                 • Go all in with long-term
• Be honest about your purpose.                  and purpose.                                   digital commitment.
                                                                                              • Deliver on the consumer’s

7.                                             8.
                                                                                                need for choice.

Expectations around                            Value for money and convenience                LEARN MORE IN-DEPTH
sustainability and social                      drive subscription retention.                  INSIGHTS ABOUT THE
responsibility are growing.                                                                   THEMES ON PAGE 39
                                               More than half of respondents expect
Poor perceptions of sustainability and         to retain their existing subscriptions – a
social responsibility may be enough to         position that seems likely to grow stronger.
drive consumers away. People are not
                                               Recommendation:
only looking for responsible supply chains,    • If you want to succeed in subscriptions,
but they also want to buy second hand.           create shared experiences.
Recommendations:
• Start strategizing for ethics
  and sustainability.
• Establish your capabilities fast.
• Control your brand in the sharing economy.
• Gain visibility over the supply chain.
• Focus on staff motivation.

                                                                                                                                        8
2. FINDINGS AT A GL ANCE

The post-lockdown mood was generally optimistic,
but caution remained.
We asked consumers to pick a
character that best represented
their feelings about returning to
in-person experiences.
The most frequently chosen characters depicted
people’s excitement, happiness and general sense
of ease about exiting lockdown. With many people
vaccinated, there was a greater sense of confidence
in venturing out. The picture was largely consistent
across each of our markets.

• 79% felt comfortable shopping in a mall.
• 78% felt comfortable eating in a restaurant.
• 76% felt comfortable returning to the workplace.

Despite the general positivity, a note of caution
remained. “Everything can quickly get bad again,”
observed one respondent. This reflected a wider
sentiment that the pandemic is not yet over,
a feeling that may have been exacerbated by
increasing cases of the Delta variant, particularly
in the U.K. and Germany.

Other participants stated they are “slowly starting
to feel comfortable” and were “optimistic about
returning to places, but it will just take some time
to recalibrate and get used to it again.” For them,
time is the healer, suggesting that – even against
a backdrop of rising cases – consumers may learn
to live with the virus.

* Blobtree.com

                                                       9
2. FINDINGS AT A GL ANCE
UK US DE
Most selected Standing on a ledge Standing on a ledge Standing on a ledge
characters:
Standing at the top of the tree On the ground, looking up Standing at the top of the tree
What this Happiness was the overriding Optimism and hope The sense of being “finally
indicates: emotion. Things were not were mixed with a little free again” was a frequently
yet “normal,” but there was apprehension. For some, there expressed emotion. Some felt
appreciation of increasing was a sense of caution – of ready to plunge back into life.
freedoms, and of being standing back and waiting Some tempered the emotion
“nearly there.” to see what happened next – expressing happiness but
before making a move. not exuberance. Others said
For others, happiness they felt “right in the middle”
came from enjoying freedoms Some were enjoying freedom between joy and caution.
while keeping their distance at a distance from others.
from others.
What they “In the middle, making good “He looks happy to see “At the moment we’re all in the
said: choices but still enjoying everyone else happy and air and don’t know how long
normal activities.” enjoying themselves but also the virus will last.”
staying in his own lane and
“It’s got to the point that you keeping the distance.” “Open, free and happy.”
just have to do what you want
to do in life.” “I feel that it’s a good middle “Because I am optimistic and
ground, I’m still waiting to see currently feel comfortable in
“That character looks content how well people adjust to the public ... but I’m cautious.”
and that’s how I feel about re-opening of things.”
it. Not overly excited but
content to have some “He looks content, but not
normality back in my life.” too daring and still maintains
caution from others.”
103. Spending Habits by Sector We asked our shoppers to tell us about their food, fashion, fitness, home and travel buying habits. Their responses show how the big themes of our study play out in individual sectors.
3. SPENDING HABITS BY SECTOR
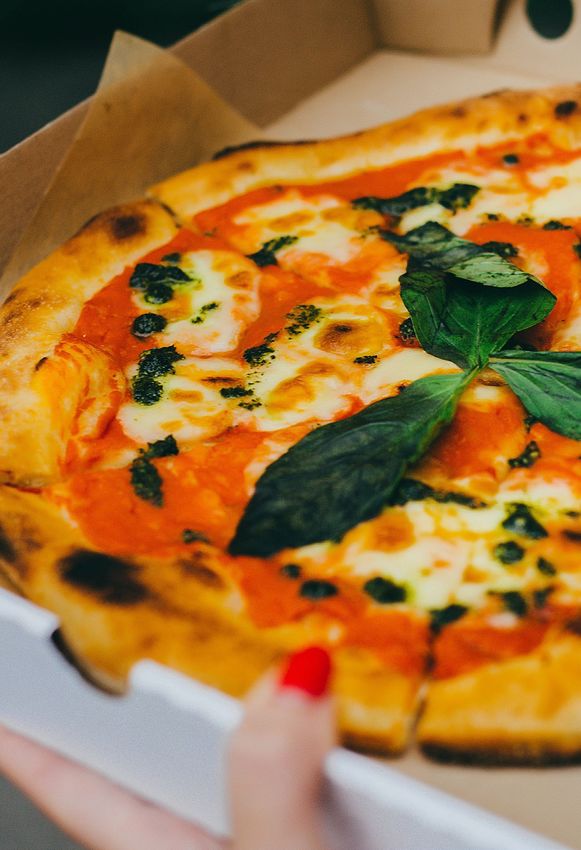
Food
Delivery app popularity has soared.
Ordering food via delivery apps was our shoppers’ preferred food). Instead, most users appear to value the apps for their
way to buy food, selected by 31% of our survey respondents. ability to deliver the other factors that matter to them (freshness,
This was true for all markets, especially in the U.K. and U.S. speed, discounts – see Freshly prepared is best section below).
Food apps were also the most popular method for ordering Beyond app ordering, curbside pickup in the U.S. (26%) significantly
food across all genders and age groups surveyed. outperformed click-and-collect in the U.K. (17%) and Germany
(15%). Grocery delivery via takeaway services, however, was the
Popularity isn’t generally based on the novelty of the apps
most popular option for the U.K. (27%), indicating that popularity and
themselves (although 12% did value trying new ways of ordering
market maturity in a particular territory go hand in hand.
Most popular ways to buy food
Ordering via food delivery apps 36%
37%
20%
Getting groceries delivered via takeaway 27%
services (e.g. JustEat, Seamless, etc.) 19%
19%
Getting home delivery 26%
direct from a grocery store 22%
17%
Watching food video 20%
tutorials online 25%
13%
Ordering via a QR code 18%
in a restaurant 15%
14%
Using click-and-collect/curbside 17%
pickup for groceries 26%
15%
Subscription meal boxes 13%
10%
11%
Using meal boxes/part-cooked 11% UK
meals from restaurants 11% US
12% DE
123. SPENDING HABITS BY SECTOR
From the Expert
Apps will become more holistic.
I see a few things happening in the food-related
‘appmosphere.’ First, there will inevitably be the
gobbling up and merging of key players. Second,
to better compete, the apps will become more
holistic – offering an increasing amount of goods
and services, taking inspiration from the Postmates
model. We are already seeing this with DoorDash
offering convenience and pet store items and
products with nationwide shipping.
—
Barbara Castiglia, Executive Editor,
Modern Restaurant Management and
host of The Main Course podcast
133. SPENDING HABITS BY SECTOR
Consumers are spending more on eating out and takeaway.
Four in 10 consumers said they were spending more on eating out and takeaway than they were three months ago, while one in five
said they were spending less. Over the next 12 months, four in 10 consumers across all markets said they would spend even more on
eating out (42%) and takeaway (39%).
Spending on eating out Spending on takeaway T O TA L
UK
compared to three months ago: compared to three months ago: US
DE
46%
42%
41% 41% 41%
38% 38%
36%
20% 20% 21% 20% 17% 21%
16%
2%
Less More Less More
How much consumers order takeaway: EVERY WEEK
EVERY MONTH
Total 19%
61%
UK
22%
73%
US 14%
43%
DE 20%
68%
How consumers describe their takeaway habits: T O TA L
UK
US
36% DE
28%
26% 24%
22% 22%
18% 19% 20% 20% 18% 20%
14% 14%
13%
10%
I spend on this I am money conscious I stick to the brands I like I like to research before
spontaneously spending on this
143. SPENDING HABITS BY SECTOR
Business model opportunities are abundant in delivery.
The issue of price was never far from our shoppers’ minds, Kitchen streamlining can help deliver better experiences.
with cheap food and discounts (see Discounts need to count
section on page 42) coming in as two of the four most influential There’s a lot to be said for streamlining operations to
buying factors. serve delivery-only customers, even across brands and
cuisines, from the same kitchen. Many entrepreneurs have
For retailers, the challenge is delivering fresh food at the price
found this to be their golden ticket during the pandemic
points customers expect, and one potential way of doing that
while quite a few established restaurants working in a
is by collaborating in the use of “ghost kitchens” that power
traditional model have struggled. The biggest question in
delivery but never actually serve a paying customer on site.
food delivery is whether this will, in fact, become a distinct
subsegment of the restaurant industry.
–
Nicole France, Evangelist, Product Marketing, Contentful
From the Expert
People are less willing to wait.
[Our restaurants] are focusing much
of their menu efforts on ready-to-
eat, grab-and-go options. People
[may be spending more,] but they are
less willing to wait, especially if they
order digitally, so we are changing
our menu structure to reflect that. It
does open up opportunities for us to
expand our menu if we are preparing
items in advance, which is very
exciting for us.
—
Joanne Chang, chef at
Flour Bakery + Café and
author of Pastry Love
153. SPENDING HABITS BY SECTOR
Eating in or dining out is often an impulse decision as consumer comfort rises.
Whether eating in or out, the trait that most clearly defined our consumers in this sector was spontaneity. This was especially true
for eating out in general, particularly for German diners.
Eight in 10 consumers said they felt comfortable eating inside (78%) and outside a restaurant (83%). Two-thirds (67%) of consumers said
they spent money on eating out at least once a month, and 20% at least once a week. Six in 10 of all consumers are ordering takeaway
monthly. Around one-fifth in the U.K. (22%) and Germany (20%) are ordering weekly, while only 14% are in the U.S.
How comfortable consumers feel eating inside or outside at a restaurant:
Very comfortable 43% Not very comfortable 13% INSIDE
50%
OUTSIDE
10%
Somewhat 36% Not comfortable at all 7%
comfortable
34% 5%
How much consumers eat out:
EVERY WEEK
Total 20%
EVERY MONTH
67%
UK 16%
65%
US 30%
77%
DE 14%
59%
How consumers describe their eating out habits: TOTAL
UK
US
35%
DE
29%
28%
24% 24%
20% 20% 20% 19% 20% 21%
17%
15% 14%
12% 13%
I spend on this I am money conscious I stick to the brands I like I like to research before
spontaneously spending on this
163. SPENDING HABITS BY SECTOR
Freshly prepared matters most.
Overall, our consumers ranked freshness as the most important Supply chain’s impact on quality and freshness.
factor when buying food, followed by fast delivery, then discounts
and deals. Although choosing the same factors, the U.K. values Everyone has become a digital diner, with younger people
fast delivery more than anything else. leading the way. They are accustomed to having a variety
of restaurants at their fingertips, thanks, in part, to the
For brands, the emergence of freshness as the key factor comes at
pandemic. Key pressures on restaurants now include
a time when delivery has never been more challenging.
staffing and supply chain challenges, both of which can
impact speed of delivery, food quality and freshness.
–
Barbara Castiglia, Executive Editor, Modern Restaurant
Management and host of The Main Course podcast
What consumers value when buying food:
Freshly prepared 37% Highly-rated 20%
33%
hygiene practices
23%
40% 22%
38% 14%
Fast delivery 36% Sustainable sources 18%
41% 18%
38% 14%
28% 22%
Discounts and deals 33% Exciting experiences 16%
36% 19%
36% 17%
27% 12%
Restaurant quality 27% New ways to deliver food 12%
food at home 25% (e.g. through apps) 13%
31% 14%
24% 10%
Cheap food 26% Ability to split bill easily 10%
T O TA L
29% 11% UK
32% 10% US
17% 9% DE
173. SPENDING HABITS BY SECTOR
The EPAM Consumer Council said…
• Sensory experiences matter.
• Creative retail partnerships that helped support consumers were valued.
• Click-and-collect and curbside pickup were growing in prominence.
• They expected to be rewarded for their loyalty.
• Discounts were fueling their takeaway spend, especially via food delivery apps.
• Their appetite for eating out has not diminished.
183. SPENDING HABITS BY SECTOR
Favored Brands
UK US DE
Tesco Chick-fil-A Edeka
“They are doing well to cope with “As of right now, they are the leader in “Always friendly, good value for money.”
the pandemic and also still make sure drive-thru times and customer service
REWE
their shelves are stocked during the – hands down.”
“Good and relatively cheap products.”
food shortage.”
McDonald’s
ALDI
Subway “Affordable food and variety of choices.”
“Excellent loyalty program.”
“More offers and deals in the app.” “They always have fast service.”
“Good quality at low prices.”
KFC Taco Bell
Alnatura
“They are always reliable, and “Cheap but filling food.”
“It’s organic and good value for money.”
I love their chicken better than “They have consistently stayed
the competition.” good quality.”
Just Eat Starbucks
“They offer a wide range of local “I enjoy their coffee and the overall
takeaway options, and the delivery environment of their establishments.”
is always quick.”
How Our Markets Differed
UK US DE
Spending more on takeaway compared Higher spend on eating out compared Spending more on takeaway
with the U.S. where eat-out spend is higher. with the U.K. and Germany, where compared with the U.S., where
takeaway spend is higher. eat-out spend is higher.
Ordering from food apps more often than
the U.S. (36% vs. 27%) and nearly twice as Most likely to dine out, with 30% dining Most likely to spontaneously
much as Germany (20%). out weekly. spend money eating out.
Highest number of “very comfortable” Least likely to place an order
for eating in (43%) and outside (50%) via a food app (20%).
a restaurant.
Least likely to watch food video tutorials.
Half as many (50%) U.S. respondents said
they spent spontaneously on takeaway
compared with Germany.
One in four are watching food video
tutorials online.
193. SPENDING HABITS BY SECTOR
Fashion
Consumers are more comfortable than they were three months ago.
Half of our consumers (49%) said they spent money on fashion How comfortable would you currently
at least once a month. Almost one in 10 (9%) spent at least
feel going to a shopping mall?
once a week. As lockdown restrictions eased, two-fifths (39%)
of consumers said they were spending more on fashion than
they were three months ago. With four-fifths of respondents
comfortable with going to a shopping mall, it’s no surprise to
5%
see spending on the rise.
15%
38%
Online shopping continues
to accelerate.
Despite the opening of physical retail stores and the general
confidence in returning to shop in person, 60% of participants 41%
said they had been shopping more online in the past three
months and would continue to do so.
Most holiday shopping will happen online this year.
Having moved online, many shoppers are staying Very comfortable Not very comfortable
there as lockdowns and social distancing measures Somewhat comfortable Not comfortable at all
lift. Our own research shows that over 40% of people
in the U.K. and the U.S. say they will do most or all
their holiday shopping online this year. For a quarter
of those, that is an increase.
—
Mike Plimsoll, Senior Director,
Industry Strategy & Marketing, Sitecore
203. SPENDING HABITS BY SECTOR
Hybrid is now “business as usual” for most.
The reasons consumers chose an in-store or online experience While the proportions of online vs. in-store shopping will
remained consistent with our previous findings. Ease of buying, undoubtedly fluctuate over time, online will never again
ability to compare prices and product variety all featured prominently be on the sidelines. Physical stores will continue to play
in the online buying decisions. This was in addition to not having to an important role, however, especially in attracting new
travel to stores, a figure likely inflated by the one in 10 shoppers who customers. Over time, we’re likely to see a distinction
said they still felt uncomfortable shopping in stores. between how shoppers look for new things – where
I’d expect to see physical stores play a more prominent
Yet consumers also continued to value the physical advantages
role – and how they find things they know they want or
of being able to try things on, see and touch products in-person
need, where shopping online with their preferred brands
to test the quality.
will likely prevail.
Hybrid looks set to remain the primary shopping experience
of the future, with almost two-thirds of respondents saying they –
would continue to shop both online and in-store. Nicole France, Evangelist, Product Marketing, Contentful
Reasons for shopping online: UK
US
DE
36%
33% 33% 32%
28% 29% 27% 25% 28% 28% 29% 27%
23% 22%
18%
Order tracking
Easier Price comparison Wider range No travel necessary
capabilities
Reasons for shopping in-store: UK
US
DE
43% 43% 42%
36% 34% 36%
32% 30% 30% 30%
25%
22%
18% 16% 21%
See products Support local
Ability to try on Touch-test quality Instant purchase
in-person businesses
213. SPENDING HABITS BY SECTOR
Price dominates, but style and The pandemic changed the nature
quality matter, too. of loyalty in fashion buying.
Overall, the most important factor of purchases is price (47%), Loyalty remains an important factor for some shoppers. A quarter
followed by style (29%) and fit or cut of the item (26%). of consumers said they stuck to the fashion brands and retailers
they like. For almost one in eight (13%), only the brands and retailers
A quarter of consumers would describe themselves as money
they perceive as being best would do. A fifth of consumers said
conscious (24%) when spending on fashion, as reflected by
the brand was most important to them, while one in seven said the
the strong showing for fast fashion retailers in favored brands.
latest fashion trends were most important to them. The combined
A fifth (20%) like to research before spending, while another 20%
importance of price and loyalty is seen in H&M and Zara, which are
of consumers like to spend spontaneously on fashion, rising to
favored brands across our markets.
24% in Germany.
Brand loyalty was notably lower – where more brands were
mentioned less frequently – in Germany and the U.S. than in the
U.K., where fewer brands were mentioned with greater frequency.
What matters most to
consumers when buying fashion:
With a huge proportion of fashion sales online,
it’s no wonder that customers [stay loyal to] the
Price 47%
brands they know – and that they know fit them.
Add in growing consumer savvy about the costs
Style 29% and impacts of returning online purchases, and
this trend is likely to strengthen.
Fit/cut 26%
–
Nicole France,
Brand 17% Evangelist, Product Marketing, Contentful
Trends 15%
The pandemic has done a lot to change the
relationship between consumers and brands,
as with so much that we buy going through
eCommerce channels, the ‘brand experience’
now has to be somehow converted to a
cardboard box you open at the kitchen counter,
which is a totally different experience than you
would have in a retail store.
–
Rita McGrath, professor at
Columbia Business School and
author of Seeing Around Corners
223. SPENDING HABITS BY SECTOR
Shopper aspirations don’t align with their actions.
While true across all sectors, fashion especially is being held to a Although brand ethics may not yet be a key driver in actual
higher standard in terms of social responsibility and sustainability by consumer spend, it seems they may influence decisions to stop or
consumers. The ethics of fashion clearly matter. And yet, when we switch what brands they spend with. One third of consumers said
asked our consumers whether cost was a more important buying they would stop using a brand if it had been reported to treat staff
factor than sustainability, 72% agreed. As noted earlier, when asked poorly (33%). A fifth of consumers (22%) stated they would stop using
what matters most when buying fashion, price, style, fit, brand and a brand if they discovered it didn’t have a sustainable supply chain.
trends all came ahead of ethical considerations.
Perhaps this is a case of it being easier to encourage consumers
In relation to spending, ethics are an area where many consumers’ to stop buying from brands that don’t have strong sustainability
actions don’t match their beliefs. or ethics initiatives rather than make more proactive choices, or
perhaps it is another area where consumer actions don’t necessarily
match their beliefs. Regardless, several brands that consumers favor,
including H&M and IKEA, have interwoven values into their brands.
What would make consumers stop buying from a brand: UK
US
DE
35%
32% 32% 31%
29%
26% 27% 25%
27%
24%
21% 21%
16% 17% 16%
Treat staff badly Values differ Doesn’t truly support Doesn’t have a sustainable Doesn’t speak up in
from my own social movements supply chain social movements
The EPAM Consumer Council said…
• They expected a fun, quality digital experience • Brands that offer products that support our
and a seamless transition between physical and council members’ individuality proved popular.
digital services.
• Sustainability was of growing importance.
• Price and fit/cut were the most important
factors in purchases. • They admired brands with sustainability initiatives.
• ‘Buy now, pay later’ payment options payment • COVID anxiety persisted where they felt retailers
options encouraged spend. didn’t meet their standards.
233. SPENDING HABITS BY SECTOR
Favored Brands
UK US DE
Next SHEIN H&M
“Always great quality and really “Reliable, cheap and fast delivery.” “Well-known, reliable brand.”
stylish-looking products.” “Really cool stuff with good prices.” “They are becoming more and
more sustainable.”
Primark Levi’s
“Always up-to-date with trends “Their jeans are worth buying. C&A
and always have good prices.” The material is long-lasting, and they “Good quality, affordable prices,
have great customer service.” a wide selection.”
Zara
“Nice seasonal collections.”
“Good quality clothing and are Old Navy
fashionably trendy. They also have “Clothes that fit my frame with Zara
exciting, stylish stores.” accurate sizes.” “Always gives the latest fashion trends.”
“Affordable, but stylish.” “Often offers discounts.”
ASOS
“Fast delivery, durability, good H&M Zalando
quality and different price options “Sustainable and trendy clothes “Fast delivery and quality.”
for products.” at a good price.” “Nice selection.”
“The clothes look expensive but aren’t.”
How Our Markets Differed
UK US DE
The most brand loyal of our markets. The least hybrid-positive of our The most hybrid-positive, with
markets, with a relatively low 57% 72% expecting to continue shopping
The most likely to strongly agree that
expecting to continue shopping both online and in-store.
their online buying would continue to
both online and in-store.
accelerate (39%), yet… The least likely to strongly agree that their
Fast fashion has infiltrated traditionally online buying would accelerate (19%).
…the most likely to shop in-store (82%
favored brands.
are comfortable to shop in-store). The most spontaneous fashion
buying behaviors.
243. SPENDING HABITS BY SECTOR
Fitness
People are paying for fitness – but not at the gym.
The pandemic-inspired exodus from paid fitness has not Watching how brands like Peloton and Mirror – not to
reversed. Three in 10 (31%) who had a gym membership before mention everyone from large gym chains to small yoga
the pandemic no longer do, only partially mitigated by the fact studios – have succeeded by building a virtual community
that 8% of people who didn’t have a gym membership before the that has some of the experience of a group workout
pandemic now do. After having previously done so, 28% said they indicates that creating a hybrid approach is a viable long-
no longer attend in-person exercise or sports classes while 22% term business strategy. The trick is to find the right balance
said they no longer visited a personal trainer or had one-on-one of individual attention, being part of a larger community
sessions – although in both cases, losses were partially offset by and price.
11% taking up such activities.
—
Nicole France, Evangelist, Product Marketing, Contentful
Our shift in exercise habits.
Have a gym membership 29% 31% 8% 33%
Attend in-person 22% 28% 11% 38%
exercise or sports classes
Purchase gym / 33% 22% 13% 33%
exercise equipment
Visit a personal trainer 17% 22% 11% 50% Did before the
pandemic, still do
Exercise at home / outside 46% 22% 14% 18% Did before the
pandemic, don’t now
Pay for online classes 16% 20% 11% 53%
Didn’t before the
pandemic, do now
Wear a fitness device Didn’t before the
33% 19% 12% 36%
pandemic, still don’t
253. SPENDING HABITS BY SECTOR
Home exercise is now preferred.
Overall, of those that stopped paying for exercise, three in 10 did so because they preferred to exercise at home (31%). A fifth bought the
equipment they needed (21%). Of those who did have gym memberships, 20% said COVID made them anxious about returning to the gym
and another 20% said they couldn’t afford it.
Motivation and a sense of community drive those who return to gyms.
For those who did return to gyms or classes – or who discovered them for the first time – the main drivers were the motivational effect of
being around others (28%), enjoying the culture of the gym (25%), finding they could exercise more easily around friends (25%) and enjoying
being part of a fitness community (24%).
Why consumers no longer pay for the gym: Why consumers exercise outside the home:
Don’t enjoy the 16% Enjoy the culture 25%
culture of the gym 12%
of the gym 19%
17% 18%
Can exercise more 18% Motivation of 20%
easily with friends 14%
physical therapy 21%
17% 18%
Felt judged in public 16% Motivation 23%
15%
of purchase 24%
15% 19%
Not comfortable 17% Exercise more easily 23%
in shared spaces 19% with friends 26%
22% 24%
Bought the 23% Like the community 26%
equipment 20% 23%
19% 24%
Can no longer 24% Enjoy the company 28%
afford it 20% 22%
24% 25%
Feel anxious going 21% Motivation 29%
out in pandemic 20% of exercising 28%
around others
18% 26%
Found cheaper 18% Don’t own gym 21%
alternatives 23% equipment 26%
17% 26%
Prefer to exercise 30%
at home
33%
32% UK US DE
263. SPENDING HABITS BY SECTOR
Nike’s dynamism and reliability land them as a crowd favorite.
Across all our markets, Nike was the most Nike always contains innovative and
highly regarded fitness brand. Reasons dynamic designs. They are always pushing
ranged from practicality, comfort, range of the boundaries in terms of aesthetics and
products and quality of clothing to building a materials. You can always rely on them for
brand of particularly loyal customers. Nike’s fashion, culture, accessibility and comfort
social aspects – its vegan products, support when it comes to everyday styles.
for diversity and inclusivity, among others –
—
were also frequently mentioned.
U.K. Consumer
273. SPENDING HABITS BY SECTOR
The EPAM Consumer Council said…
• They were spending less on fitness than other categories surveyed.
• Although some were eager for a return of the social interaction
of the gym, others – particularly in the U.K. and Germany – were
enjoying the alternatives they found during the pandemic.
• They valued fitness without judgment.
• They appreciated brands that engaged and understood
them, rather than merely selling to them.
• They desired brands to be more than pure fitness
companies – they wanted to feel a sense of community.
283. SPENDING HABITS BY SECTOR
Favored Brands
UK US DE
Nike Nike Nike
“Premium quality product.” “They have shown that they care about “Selection for different body types.”
“Supporting athletes who are the community.” “Because of the reputation and the
making a stand.” “It’s cool.” quality.”
“So easy to ship and so many options.”
Adidas Adidas
“The way they’ve started being more Adidas “I have always remained loyal to the
sustainable.” “Quality and suitable prices.” brand and will always be. Always top
“Good value for money and looks better “They have a good brand of shoes, and quality.”
than most sports brands. Easy to find they last long so I am going to stick
Decathlon
and more styles to choose from.” with them.”
“Offers cheap but good products.”
Gymshark Planet Fitness
Puma
“Inspirational journey.” “They are cleaning their machines really
“Because they are qualitatively better
“Tackling fast fashion, offering well due to COVID.”
than other brands and still cheaper.”
sustainable items.” “The value you get for low prices.”
“Things last forever.”
Peloton
“I often see Peloton advertisements
and think they seem exciting, modern,
innovative and motivational.”
How Our Markets Differed
UK US DE
Purchasing focused more on fitness Purchasing focused more on the Purchasing focused more on the gym
clothing than the gym. gym than fitness clothing. than fitness clothing.
Most likely to have stopped paying for Most likely to have stopped paying Most likely to have stopped paying for
fitness due to affordability (24%). for the gym due to finding cheaper the gym due to feeling uncomfortable in
alternatives (23%). shared spaces (22%).
.
293. SPENDING HABITS BY SECTOR
Travel
Overseas travel will Some COVID discomfort
increase (slowly). remains for flights.
Just under half of our shoppers (48%) had been on vacation in the A third of our survey (33%) researched flights before buying. 25%
three months before the survey. More people traveled within their described themselves as being money conscious when spending
country (32%) than abroad (19%), as travel restrictions existed for on air travel. Only 6% described themselves as frivolous spenders
travelers in some of our markets during the period surveyed. On in this category.
average, males (22%) were somewhat more likely to have been
Almost two in five (38%) admitted to still feeling uncomfortable
on an overseas vacation than females (16%).
about getting on a flight, and given the winter season combined
Looking ahead, over half (54%) said they were planning a vacation. with the emergence of new COVID variants, this figure could
Those planning to take a domestic vacation was set to reduce to increase within the next few months.
32%, while overseas travel would increase to 27%. Germans remained
the most likely to travel abroad, but the biggest shift was in the U.K.,
where overseas travel among our respondents was set to double.
Travel plans - UK
Travel plans - UK
US US
past three months: next six months:
DE DE
% of all respondents % of all respondents
52% 52%
43%
36% 36% 37%
35% 35%
33% 31%
30% 29% 30%
28% 29%
16% 15%
10%
No Yes, in my Yes, No Yes, in my Yes,
country abroad country abroad
303. SPENDING HABITS BY SECTOR
Affordability is a bigger factor than COVID for those not going on vacation.
While COVID and its associated challenges – like worrying about quarantine or rule changes while away – still concerned 20-25%
of travelers, cost was the single most dominant factor for not booking a vacation. Overall, 44% said they could not afford a vacation,
with women (50%) significantly more likely to place affordability as their top reason compared to men (35%).
Reasons for not going on vacation: UK
US
DE
50%
44%
38%
28% 27% 27% 26%
24% 23%
21%
17% 18% 18%
15% 15% 16% 15%
10%
Can’t afford to Worried about Worried I may need Worried restrictions Worried about Don’t understand
catching COVID to quarantine may change while losing money due the restrictions in
I’m away to cancellations other countries
From the Expert
Meet customers (near) where they
are — literally.
Staycations and local tourism will, for many
would-be travelers, remain the most viable
options because they are both lower risk and
less expensive.
—
Nicole France, Evangelist,
Product Marketing, Contentful
313. SPENDING HABITS BY SECTOR
New trust considerations shape A new area of focus for building trust is emerging...
travel company choice. Whilst concerns over price are certainly present, especially
in light of the additional travel and product costs due to
Price, ease of booking and reputation were the most important COVID, trust and brand reputation still remain the number
factors when choosing a travel company, reflecting the growing one priority. A new area of focus for building trust is
COVID-confidence of our respondents. emerging and includes transparency and communication
around health along with safety and wellbeing whilst
Overall, three in 10 (31%) made a booking based on price. 29% traveling. This shift is not a surprise considering consumers
choose a travel company that offers online booking. The reputation and travelers most frequently search terms like ‘tips on
of the travel company was the third most important factor at 22%. personal health and well-being’
During the pandemic, the Consumer Council felt that trust had
grown in importance to such an extent that it dominated even price. Clear, proactive communication around company
This latest survey shows something of a rebalancing. Transparency policies and safety measures go a long way in building
and communication around health, safety and well-being are the trust and reassuring nervous travelers as they look to
emerging considerations among consumers. start traveling again.
—
Mike Plimsoll, Senior Director,
Industry Strategy & Marketing, Sitecore
UK
Reasons for choosing travel companies:
US
DE
33%
31%
30%
29% 29%
28%
25%
22% 22%
20%
19%
18%
17% 17% 17% 17%
16% 16%
The prices are I can book online They have a good I trust the I like their customer They guarantee a
cheap reputation travel company service refund
323. SPENDING HABITS BY SECTOR
The EPAM Consumer Council said…
• Brand trust was the motivating factor in purchases, and
even more important than price.
• They welcomed brands that offered solutions to shoppers’
vacation challenges.
• Brands that stepped up to make travelers feel secure won trust.
333. SPENDING HABITS BY SECTOR
Favored Brands
UK US DE
Ryanair Airbnb Ryanair
“Really low prices.” “It’s a lot cheaper than hotels “The cheapest.”
“The quickest and easiest checkout and more of an experience.”
Booking.com
during pandemic.”
Booking.com “By far the best deals and reviews.”
Jet2 “Best deals and reward program.” “Great offers and beautiful travel
“Always offers good reliable service, destinations.”
Southwest Airlines
great price for a guaranteed product.”
“They have low prices.”
British Airways “They’ve been leaders in the fight
“Treats employees and customers well.” against this pandemic and that’s
“The airline I fly with and they are commendable.”
the most trustworthy.”
easyJet
“Using it for years. I love it for plenty
of reasons, especially their cheap
flight tickets.”
How Our Markets Differed
UK US DE
46% have had a vacation in the past Least likely to have had a vacation in Market most likely to have had a vacation
three months. the past three months (44%), but… in the past three months (53%).
Almost twice as many people (31%) plan ...most likely to have vacationed Most likely to have traveled abroad (29%).
to go abroad in the next six months domestically (35%).
Affordability is least likely
compared to the past three months (16%).
Least likely to have to prevent a vacation (38%)
Travel company reputation matters traveled overseas (10%). compared to other markets.
most to U.K. travelers (25% vs. 22% U.S.
Affordability is most likely
vs. 19% Germany).
to prevent a vacation (50%)
compared to other markets.
343. SPENDING HABITS BY SECTOR
Home
Homeware spend is increasing. Where do you buy most of your
household items from?
Three quarters of our consumers (75%) bought a home item
within the last three months. General eRetailer 33%
Homeowners in our sample were considerably more likely (e.g., Amazon)
to have purchased homeware (83%) than renters (70%). Almost Local stores 29%
one in three renters didn’t buy anything for their home in the
past three months, nearly double the figure for homeowners.
Retail parks 15%
Unsurprisingly, the biggest disparity between buying
habits came in bigger ticket items, with far fewer renters Specialist online 13%
than homeowners buying furniture (for home or garden). retailer
Online is the most prominent
What have you bought HOMEOWNERS
channel for home purchases. for the home in the past RENTERS
three months ?
Online retailers led the way for home purchases (33%),
followed by local stores (29%). Though, the U.K. position
Decorative pieces 39%
differed (see How Our Markets Differed on page 38).
36%
How do you create a great home products
experience online? Accessories 39%
Convenience, flexibility and well-designed 36%
user experiences at every step of a purchase
helps a shopper feel like they are truly part of Indoor furniture 36%
an in-person buying process from the comfort 27%
of their home. As of June 2020, 35%1 of U.S.
respondents said they’d used AR to visualize Garden furniture 26%
furniture or vehicle customizations.
13%
—
Katie Stewart, Nothing 17%
Principal, Channel Accounts, BigCommerce 30%
1
https://www.bigcommerce.com/articles/ecommerce/ecommerce-augmented-reality/
353. SPENDING HABITS BY SECTOR
Convenience beats value and Choice and physical presence
choice in online homeware. feed IKEA’s dominance.
Convenience (45%) was the most popular reason for our consumers The ability to choose their experience and the ability to physically
to shop online, followed by the variety of products (36%) and the view a product were the two most crucial factors in consumer
likelihood of finding what they were looking for (34%). Somewhat homeware purchases. The fact that homeware super-brand IKEA,
surprisingly, value for money was only the fourth most important which was heavily mentioned across each of our markets, delivers
factor when shopping for homeware online (28%). both is a potential explanation for its dominance, as well as a factor
in the popularity of other favored brands, including Home Depot
For those preferring to shop with physical retailers, convenience
(U.S.), Dunelm (U.K.) and Depot (Germany). IKEA was also noted for
(35%) and value for money (30%) were the most frequently stated
its value for money, customer support model and a shift to more
reasons, with low cost (28%) and the experience of physical
sustainable products.
shopping (26%) following.
They’re switching to sustainable methods of making
Though far from being a digital native, IKEA demonstrates
their furniture and reusing things and using parts of the
a clear understanding that digital channels need to be as
wood that would otherwise go to waste.
much a part of its entire operations — from brand promise
to business ethos — as any of its stores and products.
—
U.S. Consumer
—
Nicole France, Evangelist, Product Marketing, Contentful
The factors that matter most when making a home purchase:
Choice 18%
Physically viewing the product 17%
Quick delivery 14%
Reviews 13%
Good customer service 10%
Easy returns 9%
Unpacking/set up 5%
Education around products 5%
Ability to talk to sales assistant in person 5%
Personalized product suggestions 4%
363. SPENDING HABITS BY SECTOR
The EPAM Consumer Council said…
• At this point in the pandemic, they were seeking comfort.
• Sensory experiences mattered, like being able to see
and test products physically.
• Super-brands led the space because of their ability to
deliver price, range of products and speed of delivery
• Ease of product returns was important.
• Sustainability and having a brand purpose earned respect.
• Brands that offered in-home experiences (e.g.,
advice sessions and personalized tutorials) stood out.
373. SPENDING HABITS BY SECTOR
Favored Brands
UK US DE
IKEA IKEA IKEA
“Items are always worth the “They’re switching to sustainable “Modern and cheap, so
money and are very durable.” methods of making their furniture interchangeable.”
and reusing things, and using parts
Dunelm Depot
of the wood that would otherwise
“Good products, price, service. Looks “It’s a bit more expensive, but nice,
go to waste.”
after their customers.” you feel at home at Depot.”
Home Depot
Argos
“Have every home appliance I need.”
“They always offer great value
“Great and affordable decoration items.”
for money with a huge selection
of homewares.” Value City Furniture
”They have been around for a while and
B&M
their furniture is always good quality.”
“Cheap but reliable.”
John Lewis
“Quality products and items at fair
prices and quality stores.”
How Our Markets Differed
UK US DE
The greatest concentration of Most likely to be influenced by reviews Three times more likely to value product
favored home brands. of home products. education (that is, content designed to
help consumers better engage with or get
Retail parks are more popular than local
more from a product) than the U.K. and
stores, bucking the trend seen elsewhere.
four times more likely than the U.S.
384. Themes from a Pandemic What does value for money really mean for our consumers? What role does ethics play in buying decisions? And what is the current state of brand loyalty? The broad themes arising from our latest survey affect every retail sector.
4. THEMES FROM A PANDEMIC

1.
Consumers (still) want                                                          WHAT SHOULD RETAILERS DO NEX T ?

value for money.                                                        Understand and respond to the way value perceptions
                                                                        change by channel.
Value for money was the core issue of our last survey; whatever
else mattered, value for money mattered more. And it still does.        Brands need to be aware of the shifting nature of value in the
When choosing who to spend their money with, value for money            hybrid world. In stores, value is a more traditional combination of
(41%) and low prices (29%) were the top two most factors for our        durability and quality of service and product. Online, as Rita McGrath
survey respondents. Although personal definitions of ‘value’ varied     notes, it is also the way a brand connects with consumers and
from consumer to consumer, most spoke about getting a quality           engages their emotions.
product or service for a price that felt reasonable to them. One        Consumers always expect value, but how brands deliver
participant stated it meant “an adequate price in relation to quality   it needs to be channel-responsive, matching consumer
and durability.” Others described it as giving them “bang for my        expectations at each point.
buck” or making them “feel like I’m saving money and getting a
good deal.”                                                             Make every sale feel like a win.

Quality was the third most important buying factor in its own right               The answer to customers seeking value isn’t necessarily
— 28% said it was top of mind when choosing who to spend with.                    dropping prices or advertising sales across the board.
Yet quality is also an inherent part of our respondents’ calculation              Retailers must focus on (a) cultivating a desirable brand
of overall value, suggesting a broader, deeper influence on results.              through engaging content experiences and (b) facilitating
Although subjective, definitions of quality centered on products                  well-timed commerce interactions that make the sale feel
that were long lasting or durable, or a good service experience.                  like a ‘win’ for the customer.

          Customers have shown that they are value-conscious,                     Enable your creative teams to make your digital domain
          but what this really indicates is that they know their                  into an immersive brand experience through rich and
          purchasing power. What shoppers want is to find the                     relevant content. Seek out personalization tools that
          best deal for them: the feeling that they’ve unlocked                   adapt content as a visitor explores the site. Build a digital
          a perfect combination of value for money and the                        experience that caters to shoppers at every stage of their
          product that they really wanted to purchase.                            journey, not just the shopping cart.

          —                                                                       —
          Jasmin Guthmann, Senior Director,                                       Jasmin Guthmann, Senior Director,
          Global Partner Marketing, Contentstack                                  Global Partner Marketing, Contentstack

The conventional economist’s picture of pricing
is completely wrong…

          …as digital qualities offer the potential for unlimited
          supply. What is scarce, though, is attention and emotion.
          So, brands need to factor that into how they engage
          with customers. Value is moving toward interactions, not
          features and attributes.”

          —
          Rita McGrath, professor at Columbia Business School
          and author of Seeing Around Corners

                                                                                                                                                  40
You can also read