Corporate Performance Dashboard - Quarter 4 - Update - Bolton Council

Page created by Gregory Rodgers
 
CONTINUE READING
Corporate Performance Dashboard - Quarter 4 - Update - Bolton Council
Corporate
Performance
Dashboard

Quarter 4 - Update

2030
Active, Connected & Prosperous
Corporate Performance Dashboard - Quarter 4 - Update - Bolton Council
1. Introduction and Context –the building blocks ............................................................................. 3
2. Chief Executive’s Directorate .......................................................................................................... 8
   Headline Indicator: Stage 1 Complaints ............................................................................................................................. 9
   Headline Indicator: FOI requests ...................................................................................................................................... 10
   Headline Indicator: Corporate Income .............................................................................................................................. 11
   Headline Indicator: Council tax collection ......................................................................................................................... 12
   Headline Indicator: Corporate Savings Programme ......................................................................................................... 13
   Headline Indicator: Staff Sickness .................................................................................................................................... 14
3. People ............................................................................................................................................. 15
   Headline Indicator: Delayed Transfers of care attributable to Adult Social Care per 100,000 population ....................... 16
   Headline Indicator: Long-term support needs met by admission to residential and nursing care homes ........................ 17
   Headline Indicator: % YP academic age 16 and 17 NEET ............................................................................................... 18
   Headline Indicator: Proportion of Section 42 Enquiries where the Risk is either reduced or removed ............................ 19
   Headline Indicator: Good level of development at Early Years Foundation Stage (EYFS) .............................................. 20
   Headline Indicator: Rate (per 10,000) subject to a Child Protection Plan ........................................................................ 21
   Headline Indicator: Rate (per 10,000) of Looked After Children ....................................................................................... 22
   Headline Indicator: % of all pupils achieving the expected standard in Reading, Writing and Maths at Key Stage 2
   (KS2) ................................................................................................................................................................................. 23
   Headline Indicator: Average Attainment 8 score per pupil ............................................................................................... 24
   Headline Indicator: Average Progress 8 score per pupil .................................................................................................. 25
   Headline Indicator: Percentage of primary schools Good or Better ................................................................................. 26
   Headline Indicator: Percentage of secondary schools Good or Better ............................................................................. 27
4. Public Health .................................................................................................................................. 28
   Headline Indicator: Premature CVD mortality ................................................................................................................... 29
   Headline Indicator: Life Expectancy (Male) ...................................................................................................................... 30
   Headline Indicator: Life Expectancy (Female) .................................................................................................................. 31
   Headline Indicator: Physically active adults ...................................................................................................................... 32
5. Place Directorate ............................................................................................................................. 33
   Headline Indicator: Employment Rate .............................................................................................................................. 35
   Headline Indicator: Business Growth Rate ....................................................................................................................... 36
   Headline Indicator: Level 4 Qualifications ......................................................................................................................... 37
   Headline Indicator: Level 2 Qualifications ......................................................................................................................... 37
   Headline Indicator: Additional Dwellings ........................................................................................................................... 38
   Headline Indicator: Visitor Economy ................................................................................................................................. 39
   Headline Indicator: Recycling Rate ................................................................................................................................... 40
   Headline Indicator: Killed and Seriously Injured ............................................................................................................... 41
   Headline Indicator: Victim Based Crime ........................................................................................................................... 42

                                                                                                                                                                                           2
Corporate Performance Dashboard - Quarter 4 - Update - Bolton Council
Introduction and Context – the build blocks

Welcome to the Council’s Performance Dashboard for Quarter 2 (2019/20). This dashboard is part of our
corporate business planning process which includes our corporate plan.

In 2018, with the introduction of new leadership at both the member and officer level there was recognition for
the need to re-energise our corporate business planning process. This view was further cemented by our
peers as a clear outcome of our LGA Peer Review that was undertaken in June 2018 who indicated that a
regular corporate monitoring performance report should be reinstated to support and inform strong decision
making.

Alongside the changes within the Council, our work with our local partners in the Vision Partnership has also
undergone change which will help us progress the Bolton 2030 agenda.

This was done whilst also recognising that we’re at a pivotal point locally in the development of the Greater
Manchester devolution agenda. As a result, our priorities have been clearly aligned to the GM Strategy,
recognising there are inevitably some differences in terms of local priorities and opportunities which we will
need to balance.

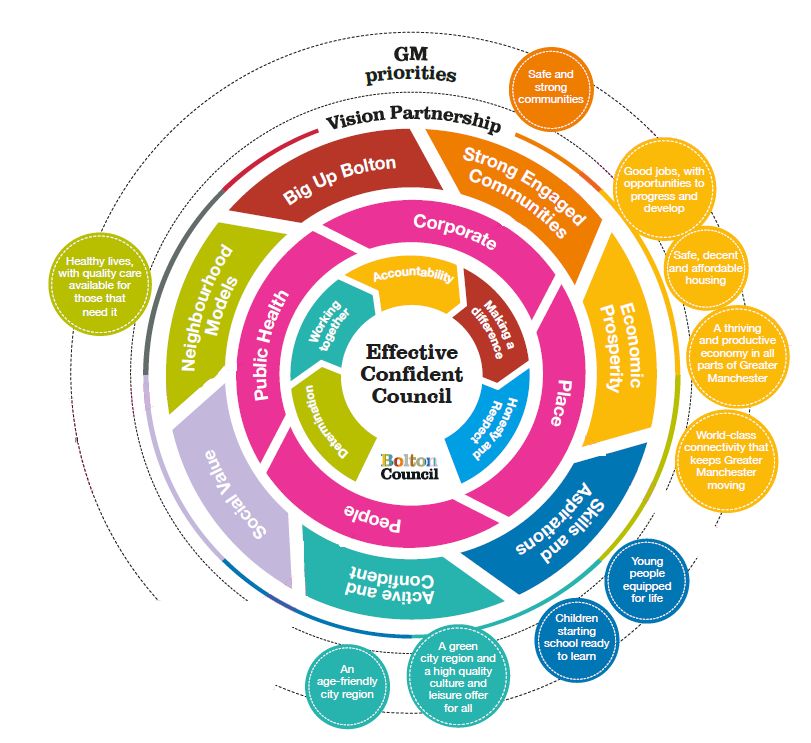
The Bolton Council Performance Framework ensures that the Council’s visions and priorities highlighted in
Bolton2030 are translated in to clear plans and measurable outcomes to be delivered by the directorates
within the organisation.

The performance framework will set out expectations at a Vison level, right through to individual services,
ensuring it reports on key performance indicators (KPIs) within each strand as shown below.
Introduction and Context – the building blocks

                                                                                                                             3
A cross-directorate project group is responsible for the maintenance of this performance management
framework, with the aim to create a holistic approach to performance reporting. The team recognise that this is
an evolving process to ensure informed decision making. The group has developed a set of KPI’s for the three
directorates within the organisation which will feed in to the corporate dashboard. This will further evolve into a
piece which reflects the Councils requirement with regards to intelligence led decision making processes.

The Corporate Performance Dashboard has been set out to report quarterly and annually on a range of
headline and supporting indicators to help us and our stakeholders determine how we are performing as an
organisation and whether we are delivering on the council’s priorities but also reflective of GMCA priorities.

                                                                                                                  4
The Corporate Performance Dashboard is split via the four directorates; Place, People Services, Public Health
and Chief Executive’s. Within each directorate sits several indicators which have been reviewed and agreed
by the directorate’s chief officers. Performance against these indicators will best reflect the direction of travel in
line with the directorate priorities, Bolton 2030 and Greater Manchester Strategy.

   •   Bolton2030 Vision Outcomes
   •   Directorate priority
   •   Link to Greater Manchester strategy priorities where applicable
   •   Provides meaningful intelligence to inform strategy, decisions and delivery
   •   Data readily available, for example some KPI’s may be reported quarterly whilst others may be
       reported annually
   •   Understandable and meaningful
   •   To enable comparison and benchmarking

The number of indicators for each directorate are as follows:

 Chief Executives:             People and Public             Public Health                 Place:
 6 indicators                  Health:                       4 indicators                  9 indicators
                               12 indicators

 Complaints                    Delayed Transfers of
                               care attributable to Adult
                                                             Premature CVD mortality       Employment Rate
                               Social Care per 100,000
                               population
 Request for Information /     Long-term support needs
                                                                                           Business Growth Rate /
 Subject Access                met by admission to
                                                             Life Expectancy (Male)        New Business Start
 Requests                      residential and nursing
                                                                                           Ups
                               care homes
 Corporate Income              % YP academic age 16
                                                             Life Expectancy (Female)      Level 4 Qualifications
                               and 17 NEET
 Council Tax /Business         Proportion of Section 42
                                                                                           Level 2 Qualifications /
 Rates                         Enquiries where the Risk
                                                             Physically active adults      Adult and Community
                               is either reduced or
                                                                                           Learning
                               removed
 Corporate Savings             Good level of
                                                                                           Net Additional
 Programme                     development at Early
                                                                                           Dwellings / Band D and
                               Years Foundation Stage
                                                                                           above Properties
                               (EYFS)
 Staff sickness                Rate (per 10,000) subject                                   Visitor Economy /
                               to a Child Protection Plan                                  Tourism Jobs
                               Rate (per 10,000) of                                        Recycling Rate /
                               Looked After Children                                       Household Waste
                               % of all pupils achieving
                               the expected standard in
                                                                                           Killed & Seriously
                               Reading, Writing and
                                                                                           Injured
                               Maths at Key Stage 2
                               (KS2)
                               Average Attainment 8
                                                                                           Victim Based Crime
                               score per pupil

                                                                                                                      5
Average Progress 8
                              score per pupil
                              Percentage of Primary
                              Schools Good or Better
                              Percentage of Secondary
                              Schools Good or Better

The baselines for each indicator have been worked up differently depending on what the indicator is. For
example, some baselines draw in previous years to measure against, whilst others don’t have a baseline given
the nature of what they are reporting on. For some indicators, the previous quarter will be as an indicator
where applicable.

Targets have been set for the majority of indicators, these targets will be measured against each quarter and
will determine the direction of travel and RAG rating for each indicator. The targets have been set based on
previous performances as well as expected outturns.

The cross-directorate project team will collate and review the detail to ensure it’s in a reasonable state for
Scrutiny via CLT, DLT and key stakeholders each quarter.

This will be part of an exercise to ensure an open data medium is put in place for the Council going forward.

Development in GM and the Bolton Vision partnership will be reformed and reflected in this exercise also.

To determine how we are performing against our key performance indicators a graphical representation has
been used.

The direction of travel determines how the indicator is performing against the baseline set. For example, if the
number of complaints we received was seen to be reducing, this would be considered improving and would
receive an upwards arrow.

The RAG rating is used to determine whether we are on target or not for improving on the KPI. For example, if
the target for residents with level 4 qualifications or higher was 25% and we report we currently have 30% of
residents with a level 4 qualification or higher, this would be deemed green as it is above target.

                                                                                                                   6
Direction of Travel                               RAG Rating

        Improving                               G      On or above target

         The same                               A      Below target

        Worsening                               R      Off target

Good is…                   Explanation / Example
Higher                     Explanation - An increase against the measure
                           Example – Life expectancy, for this particular indicator good
                           would be considered a higher life expectancy age

Lower                      Explanation - A decrease against the measure
                           Example – Staff sickness, lower staff sickness would be
                           considered good
Achieved                   Explanation - The indicator has been reached, this is usually
                           for indicators that are task focused
                           Example – Savings, if we need to make savings within a
                           certain time period, if these savings are made within the
                           timescales then this would be considered achieved

                                                                                           7
The Chief Executive’s directorate has been referenced first as it has a unique role of measuring the
health of the organisation as well as the performance of the directorate. The Chief Executive’s also
acts as an enabler for other parts of the organisation.

2.1 Summary of Headline Indicators
•     The data included is for Quarter 2, 2019/20
•     For those that are updated quarterly, a RAG rating has been added to the indicator

    Headline Indicator   Frequency and Status    Good is…        DOT          RAG

                         Quarterly
    Complaints                                   Lower                         A

                         Quarterly
    FOI’s and SAR’s                              Lower                         A

                         Annual with quarterly
    Income / Budget                              Higher                        G
                         commentary

    Council Tax /        Annual with quarterly
                                                 Higher                        G
    Business Rates       commentary

                         Annual with quarterly
    Savings                                      Achieved                      G
                         commentary

                         Quarterly
    Staff sickness                               Lower                         G

                                                                                                       8
Vision Outcome: Strong and Distinctive                                                  GM Priority: A thriving and productive economy in all part of Greater Manchester
Headline Indicator: Stage 1 Complaints                                                                                                        Table 1
In Quarter 2 2019/201                                              Good is: Lower                         A                                                                         In Quarter 2, 2019/201
                                                                                                                                                                                    There were
There were                                                         Baseline: Q4 18/19
276                                                                                                                Place                     66
                                                                                                                                                                        209         194 Stage 1 complaints were responded to
Total stage 1 complaints received                     1            Target: 272 Stage 1 complaints                                                                        217
                                                                                                                                                                                    258 Stage 1 complaints closed
                                                                                                                                   15
a 9.8 percent increase (234) since Q1
19/20                                                                Link between Vision Outcomes and GM
                                                                                                                 People        8
                                                                                                                                   21
                                                                                                                                                                                    92 Stage 1 complaints remain active2
a 5.5. percent decrease (272) since Q4                                             Priorities
                                                                                                                                        34
                                                                                                                                                                                    12.15 average no. of days for a Stage 1
18/19 (baseline)                                                                                                    CEX            18                                               response (20 working days is the legal deadline)
                                                                                                                                        38
                                                                               VO1             GM 4
Table 1 details the complaints via each
directorate and those that were                                                                                            0            50        100      150    200         250
received, closed and active in this                                                                                                 Closed        Active    Received
period
Supporting Indicator: Stage 2 & Local Government and Social Care Ombudsman complaints
In Quarter 2 2019/201                                                                               Commentary

There were                                                                                          Monitoring officers are now in place for each directorate, these will be responsible for ensuring compliancy with
16                                                                                                  complaints for their individual directorate.
Total Stage 2 complaints
                                                                                                    The complaints policy was approved at CLT in Q1 and is now due to the leader’s briefing in Q3 (November), this
Compared to (7) from the previous quarter (Q1 19/20)                                                will then be followed by communication to the organisation and training and guidance will be issued.

There were                                                                                          The guidance and training will look to detail the correct processes for managing and handling complaints which
0                                                                                                   will look to reflect in the number of complaints making it to stage 2.
Local Government and Social Care Ombudsman open
complaints                                                                                          This will also look to address those complaints that are still noted as being “active” despite them not being, and
                                                                                                    ensure processes are embedded to allow these to be closed. Some progress has already been made on this since
Remaining the same (0) as the previous quarter (Q1 18/19)                                           Q1 which has been reflected in the figures shown.

1 Including complaints from within the People directorate that fell with statutory definiton
2 Active refers to those that remain open, including those that havent been closed in previous quarters

                                                                                                                                                                                                                         9
Vision Outcome: Strong and Distinctive                            GM Priority: A thriving and productive economy in all parts of Greater Manchester
                                                                                                                                             The time to respond to an FOI is    There have been a
Headline Indicator: FOI requests                                                                                                             20 working days unless an           number of older FOIs
In Quarter 2 2019/20                                    Good is:                                                                             extension is requested              with delayed responses
                                                                                      A                          36
                                                                                                                                                                                 due to (a) the over £500
                                                        Higher                                                              96
There were                                                                                                                                   18.9 working days was the           expenditure reports not
374 FOI requests                                        Baseline: Q4 18/19                                                                   average time for a FOI              being published and (b)
                                                                                                         98
compared to 353 the previous quarter (Q1                                                                                                     response within the Q2              not getting responses
19/20)                                                  Target: 91% FOIs answered                                                                                                back in respect of parking
                                                                                                                                             19/201
                                                        on time                                                                                                                  related requests.
                                                                                                                      144                                                         There has also been a
314 FOIs were answered on time                                                                                                               1 working day was the               need for further
                                                         Link between Vision Outcomes and
                                                                                                                                             quickest response time for an       clarification seeking from
accounting for 85.8%                                               GM Priorities
                                                                                                                                             FOI                                 services before they
                                                                                                    People    Place   CEX    Cross Cutting   20 working days after the           could be sent out. At the
340 FOIs should have been answered                             VO1          GM 4                                                             legal deadline was the              weekly team meetings,
on time                                                                                                                                      slowest response time to an         the outstanding FOI
                                                                                            The table above details the FOI’s via each                                           requests are reviewed.
                                                                                                          directorate.                       FOI

Supporting Indicator: Subject Access Requests (SAR)
In Quarter 2, 2019/202                                        Good is: Higher                G       The Information Governance team are
There were
                                                                                                     embedding new processes to ensure a
                                                              Baseline: Q4 18/19                     smoother workflow enabling improved                          CEX        3
44 SAR requests
                                                              Target: 60% answered on                response times.
an increase of 29.4% since the previous
quarter (34)                                                  time
                                                                                                     Issues have also been experienced with a            Cross Cutting           8
                                                                                                     redaction toolkit which has slowed progress
                                                              Link between Vision Outcomes and GM
                                                                            Priorities
                                                                                                     and, in some cases, required duplication of
                                                                                                     work. These issues are also being addressed               People                              25
18 SARs were answered on time or on hold
                                                                                                     by ICT.
accounting for 69.2%
                                                                                                     Moving forward it is intended to improve                    Place           8

                                                                      VO1           GM 4             management information and allow easier
                                                                                                     application of required case extensions.                            0       10        20           30

                                                                                                                                                        The table above shows the number of SARs
                                                                                                                                                        via each directorate
1
    This is only for FOIs answered within this quarter – it may be some of the FOI’s are answered in the next quarter
2
    For those that had been answered in Q1 19/20 only, some legal deadlines may move in to the next quarter

                                                                                                                                                                                             10
Vision Outcome: Strong and Distinctive                          GM Priority: A thriving and productive economy in all parts of Greater Manchester

Headline Indicator: Corporate Income                                                                       Business Rates                                                          Council Tax
For 19/20                                                                          120,000                                             112,805             114,000
                                               Good is: Higher                G                                                                                                                                 113,109

                                                                                   100,000                            86,533
The projected corporate income is              Baseline: 17/18                                     81,950
                                                                                                                                                           112,000
(£’000’s):                                                                          80,000

£225,914                                       Target: £225,914                     60,000                                                                 110,000                           109,164
                                                                                                   38,293
                                                                                    40,000                            29,793
Council Tax: £113,109                                                                                                                   20,600
Business Rates: £112,805                                                                                                                                   108,000
                                                Link between Vision Outcomes and
                                                                                    20,000
                                                                                                      0                    0               0
                                                          GM Priorities
                                                                                          0                                                                106,000
a 0.1% increase from 18/19                                                                          17/18             18/19              19/20
(£259,000)
                                                                                                          Business Rates                                                  103,509
                                                                                                                                                           104,000
                                                      VO2           GM 4                                  Business Rates Top-Up
                                                                                                          Revenue Support Grant (RSG)                      102,000
                                                                                                                                                                          2017/18            2018/19            2019/20

Supporting Indicator: Budget
                                                                                   Commentary
The Council’s Revenue Budget 2019/20 is
£242,529,000 after use of reserves                                                 The relatively small rise in corporate income can be attributed to the £8m reduction in business rates top up
The Projected Outturn at Quarter 2 is                                              grant for 19/20. This offset any increase made from council tax.
£242,529,0001
                                                                                   Under the 100% business rates pilot scheme our RSG is £0. Under the pilot we keep 99% of our business
   £250,000,000
                                                                                   rates as opposed to 49% previously, in lieu of this all Greater Manchester authorities have surrendered
                                £242,529,000         £242,529,000                  their RSG grants.
   £200,000,000
                                                                                   Council Tax - The council tax per dwelling is normally increased from the previous year by a percentage agreed at full council (“the
                                                                                   council tax increase”). The new council tax per household is then multiplied by the tax base to give an overall total for the amount of
   £150,000,000                                                                    council tax which will be collected.

   £100,000,000                                                                    Business rates – each business property in the borough is assigned a rateable value by the Valuation Office Agency. Central
                                                                                   government set each year the rate to be collected from businesses. This rate is multiplied by a business’s rateable value to determine
                                                                                   the amount collected. Prior to 2017/18 the council passed 50% over to central government who re-distributed it. Since 2017/18
    £50,000,000                                                                    certain councils including Bolton have been allowed to keep all the business rates they collect (except for 1% which goes to the Fire
                                                                                   Service) in exchange for additional services such as Public Health. Both RSG and Public Health grant (People) rolled into the 100%
              £0                                                                   Pilot.
                       REVENUE BUDGET AFTER       PROJECTED OUTTURN Q2
                          USE OF RESERVES

                                                                                                                                                                                                           11
Vision Outcome: Strong and Distinctive                               GM Priority: A thriving and productive economy in all parts of Greater Manchester
Headline Indicator: Council tax collection                                                                         Table 1
                                                                                                                                                               We are still seeing people changing
For Q2 19/20                           Good is: Higher                          G                                                                              from paying over 10 months to 12, to
                                                                                                55.76%
                                                                                       55.80%            55.51%
                                                                                                                                                               spread the cost over the whole of the
of the £136.93m council tax payable           Baseline: Q2 18/19
                                                                                       55.40%                     55.21%                                       year.
for 19/20
                                              Target: 54.14% council tax collection                                        54.94%
                                                                                       55.00%
                                                                                                                                    54.62%                     At the end of September, we have
we have collected £74.17m                                                              54.60%                                                                  28,177 charge payers paying over 12
                                                                                                                                             54.14% 54.16%     monthly compared to 25,559 at the
                                               Link between Vision Outcomes and GM     54.20%
summarize                                                    Priorities                                                                                        end of September 18.
Accounting for 54.16% of total income                                                  53.80%
compared to 54.14% for the same                                                        53.40%
quarter in the previous year
                                                       VO2          GM 4               53.00%
Table 1 details the collection for council
tax year on year for Q2

Supporting Indicator: Business rates collection                                                                            Accounts Receivable Collection at 30th September 2019
For Q2 18/19
                                                                                      This accounts for 53.89%             At the end of September 19, the balance payable was £133.53m
At the end of Q2, we have collected                                                   of the total charged and             (£13.94m for previous years and £119.59m raised since 1st April 19) and
£49.53m (53.89%) of £91.91m business rates payable for 19/20                          compares to 52.60% at                we had collected £112.43m (84.20%) of this.
                                                                                      the end of September last
The table below shows the year on year collection rate percentage for Q2              year.                                  94.00%
                                                                                      This increase in collection                                               92.14%
                                                                                      is mainly because we’ve                92.00%

    55.00%               54.65%                                                       already received most of               90.00%
                                                                                                                                                                          88.55%
    54.50%     54.17%              54.10%                                             the payments for the
                                                                  53.89%                                                     88.00%                   86.88%
    54.00%                                   53.58%                                   whole year for Council                                                                        86.41%
    53.50%                                                                            owned properties.                      86.00%      84.57%                                               84.20%
    53.00%                                             52.60%                                                                84.00%
    52.50%
                                                                                                                             82.00%
    52.00%
    51.50%                                                                                                                   80.00%
             2014/15    2015/16   2016/17   2017/18   2018/19   2019/20                                                                  2014/15     2015/16    2016/17   2017/18   2018/19   2019/20

                                                                                                                                                                                              12
Vision Outcome: Strong and Distinctive                        GM Priority: A thriving and productive economy in all parts of Greater Manchester
Headline Indicator: Corporate Savings Programme                                                           Table 1 (£’000)                     Supporting Indicator: Remaining savings
                                                                                                                                              For 19/201
For 19/20                                       Good is: Achieved               G
                                                Baseline: 19/20                                 CEX
                                                                                                                                              There are
There were                                                                                                                  £2,754
                                                                                                                                              £12,810,000
£10,690,000                                     Target: £12,810,000 remaining
                                                savings
                                                                                                                                              remaining savings to be made for 19-21
Savings achieved as of Quarter 21                                                             Place                £1,735.00
                                                 Link between Vision Outcomes and GM                                                           Directorate            Total 2019-21 (£'000)
Accounting for 45% of total savings to                         Priorities
                                                                                                                                                                      savings to achieve
be made (£23,500,000)                                                                  Public Health               £1,656                      People                 £7,602,000
                                                        VO2          GM 4                                                                      Public Health          £0
Table 1 details the total savings                                                            People                                  £4,545
                                                                                                                                               Place                  £3,965,000
achieved for each directorate (19/21)                                                                                                          Chief Executive’s      £1,243,000
so far.                                                                                                £0 £1,000£2,000£3,000£4,000£5,000

Table 2 shows the percentage of savings made within each directorate
for Q2
Table 2
                                                                                Commentary

 CHIEF EXECTIVES                 68.9%                                          All public health savings have been delivered as of Quarter 2. A small number of
                                                                                reviews were implemented in Quarter 2; however, Quarter 3 will see an increase in
             PLACE     30.43%
                                                                                savings achieved as further programmed reviews are brought forward.

   PUBLIC HEALTH                         100%

           PEOPLE       37.41%

                                                                                                                                                                                 13
Headline Indicator: Staff Sick

Vision Outcome: Strong and Distinctive                                                         GM Priority: Healthy lives, with good care for those that need it
                                                                                                               Table 1 details the absences via each directorate compared to the              Supporting Indicator: Days lost per FTE
Headline Indicator: Staff sickness                                                                             previous year
In Quarter 2 2019/201                                                                                                                                                  Table 1
                                                                   Good is: Lower                    G                                                                                        In Quarter 2, 2019/201
                                                                   Baseline: Q2 18/19                                                                  395                                    There were
There were                                                                                                                     PL                     369                                     2
1842                                                                                                                  PE Schools                                         1010
                                                                                                                                                                                              average working days lost per FTE
                                                                   Target: 1943(Q2 18/19)                                                                              930
Staff absences due to sickness                                                                                                                  216
                                                                                                                     PE Children
                                                                                                                                                219
                                                                                                                                                                                              across the whole Council
                                                                                                                               PH       01
a 5.2 percent decrease (1943) since Q2                                                                                                                                                        this was identical to Q2 18/19, but a slight
18/19                                                                                                                   PE Adults               195                                           reduction of 0.3 compared to Q1 19/20
                                                                             VO2          GM 9                                                   224
a 21% percent decrease (2331) from                                                                                            CEX            117
                                                                                                                                             99
the previous quarter (Q1 19/20).
                                                                                                                                    0                500         1000                1500
                                                                    Link between Vision Outcomes and GM
                                                                                                                                             Q2 18/19    Q2 19/20
                                                                                  Priorities

Table 2 shows average working days lost per FTE Q2 18/19 and Q2 19/20                                                                                                                          The two main reasons for sickness across the
                                                                                            Table 4 shows categories of sickness absence for Q2 19/20 (%)                                     Council remains as stress / depression / mental
                                                                                                                                                                                              health & musculoskeletal; these 2 categories
                         PL                                               Table 2                   Headaches or Pregnancy                Genito-            Absence not yet                  account for approximately half of all sickness days
                              2                                                                     Migraines, 1.2 Related, 2.2          urinary, 1           classified, 4.2                 lost.
            PE Children
                                                                                                      Heart, Blood
                         PH                                                                          Pressure, 3.4                                                                            The whole council cumulative sickness absence rate
              PE Adults                                                                      Eye, Ear, Nose                                                                                   is identical to last year with 2 days lost per FTE
                                                                                                                                                                                  Stress,
                                                                                              or Mouth, 4                                                                                     2019/20 (2.4 days 2018/19).
                       CEX                                                                                                                                                      Depression,
                                                                                             Viral Infection,                                                                    MH, 31.4
                                                                                                                                                                                              Attendance figures across GM show Bolton’s
                                  0                 2                 4               6
                                                                                                    4.4                                                                                       attendance figure has improved by 6%. In 2018/19
                                         Q2 18/19       Q2 19/20
                                                                                                                                                                                              44.4% of staff employed had 100% attendance
                                                                                                Chest,
                                                                                                                                                                                              compared with 38.4% in 2017/18.
      70.0 55.0                          64.0                                                Respiratory,
      60.0                     52.1 47.0                     52.0                                3.5
                44.0 44.4 45.8                45.5                46.0 48.0                               Stomach,                                                                            Managers are provided with regular HR
      50.0                                         39.0 42.0
      40.0                                                                                                 Liver, Kidney,                                                                     Management Information to assist them understand
      30.0                                                                                                      6.2                                                                           any absence issues and enable early intervention
      20.0
      10.0                                                                                                                                                                                    where absence may or has become an issue.
       0.0
                                                                                             Other, 7.4                                                                                       In addition, the Council continues to provide a range
                                                                                                                                                                                              of on-going proactive and preventative measures
                                                                                                                                                                                              and support is provided to all employees including
                                                                              Table 3                                                                                                         flu vaccinations, access to a confidential employee
                                                                                                   Operation,                                                             Musculoskelet       assistance programme and support via HML our
                                                                                                    Post-Op                                                                 al, 20.1          Occupational Health Provider.
Table 3 shows 100% attendance for 18/19
                                                                                                   Hospital, 11
1 Whole   council figures including schools                                                 2Childrens   services & Schools non-teaching

                                                                                                                                                                                                                                    14
3.1 Summary of Headline Indicators
   •   The data included is for Quarter 2, 2019/20, as not all data is updated quarterly,
       commentary has been added to each indicator where appropriate.
   •   For those that have been updated quarterly, a RAG has been added.
                                                  Frequency    Good
Headline Indicator                                                      DOT        RAG
                                                  and Status   is…
                                                  Annually
Delayed Transfers of care attributable to Adult
                                                               Lower                     A
Social Care per 100,000 population
                                                  Annually
Long-term support needs met by admission to
                                                               Lower                     A
residential and nursing care homes
                                                  Annually
% YP academic age 16 and 17 NEET                               Lower                     R

                                                  Annually                           Annual –
Proportion of Section 42 Enquiries where the
                                                               Higher               Commentary
Risk is either reduced or removed                                                     added
                                                  Annually
Good level of development at Early Years
                                                               Higher                    G
Foundation Stage (EYFS)

Rate (per 10,000) subject to a Child Protection   Annually
                                                               N/A                       R
Plan
                                                  Annually                           Annual –
Rate (per 10,000) of Looked After Children                     Lower                Commentary
                                                                                      added
% of all pupils achieving the expected standard   Annually
in Reading, Writing and Maths at Key Stage 2                   Higher                    G
(KS2)
                                                  Annually
Average Attainment 8 score per pupil                           Higher                    A

                                                  Annually
Average Progress 8 score per pupil                             Higher                    A

                                                  Annually
Percentage of Primary Schools Good or Better                   Higher                    G

                                                  Annually
Percentage of Secondary Schools Good or
                                                               Higher                    A
Better

                                                                                                 15
GM Priority: Healthy lives with good care available for those that need   People Priority: People can exercise choice and control and live
Vision Outcome: Ageing Well
                                 it                                                                        independently
Headline Indicator: Delayed Transfers of care attributable to
Adult Social Care per 100,000 population
This indicator measures the average number            Good is: Lower                   A
of delayed transfers of care (for those aged
18 and over) that are attributable to social
                                                      Baseline: 4.6 (2017/18)
care, per 100,000 population.

A delayed transfer of care occurs when a
patient who has been assessed as ready
and safe for transfer or discharge from a             Target: 4.0
hospital bed but they are still occupying such
a bed.
                                                       Link between Vision Outcomes, People
                                                             Priorities and GM Priorities
Bolton’s latest published performance on
this indicator is 4.2% and is showing                                   VO6
improvement compared to the previous
year.                                                              GM         PE6
                                                                    9
In 2018/19, Bolton’s performance was:
                                                      Bolton's performance has remained better than the North West average on Delayed Transfers of Social
                                                      Care. Latest published data for 2018/19 showed further improvements in performance on this measure
    •     1.1 percentage points higher than the       throughout the country following several years where delays were increasing. This improvement was also
          national average (3.1)                      achieved on delayed transfers overall and improvement actions are system-wide.
    •     0.3 percentage points lower than the
          North West average (4.5)                    The Bolton locality is working collaboratively to help to reduce pressure on the hospital and improve timely
    •     Ranked 121st in England out of 152          discharges to reduce length of stay. The Integrated Discharge Team is a single team with joint
          authorities                                 management arrangements and working to an agreed list of patients where daily actions are progressed to
                                                      facilitate timely discharge. The discharge to assess process has been established across the system, with
Good is lower for this measure                        the pathway for people for being discharged home fully implemented.

Notes
1Latestpublished data: Measures from the Adult Social Care Outcomes Framework, England 2018/19
Source: NHS England/ONS
Frequency: Annual

                                                                                                                                                                              16
Vision Outcome: Ageing Well      GM Priority: Healthy lives, with good care available for those that need it   People Priority: People in Bolton live longer and healthier lives and stay well

Headline Indicator: Long-term support needs met by admission to
residential and nursing care homes
                                                      Good is: Lower                    A

                                                      Baseline: 971.1 (2017/18)
This indicator measures the number of council-
supported older adults (aged 65 and over)
whose long-term support needs were met by
admission to residential and nursing care             Target: 763.4
homes, per 100,000 population. It is part of the
Adult Social Care Outcomes Framework.
                                                                       VO7
The latest1 published performance on this
indicator is 791.9 (this equates to 389 older                     GM         PE7
people in permanent residential care at the                        9
end of 2018/19).                                       Link between Vision Outcomes, People
                                                             Priorities and GM Priorities

• Bolton’s rate has improved since the
  previous year and is now closer to the
  North West average                                  Avoiding permanent placements in residential and nursing care homes is a good measure of delaying
• Bolton has a slightly higher rate than              dependency, and the inclusion of this measure in the framework supports local health and social care services
  regional and national averages.                     to work together to reduce avoidable admissions. However, it is acknowledged that for some client groups that
                                                      admission to residential or nursing care homes can represent an improvement in their situation and admission to
Good is lower for this measure                        residential care may be necessary to meet increased levels of complex care needs.

                                                      The rate of older adults whose support needs were met by admission to residential and nursing care homes has
                                                      reduced from a 2017/18 peak and is now more closely in line with comparators.

Notes
1
 Latest published data: Measures from the Adult Social Care Outcomes Framework, England 2018/19
Source: NHS Digital
Frequency: Annual

                                                                                                                                                                                  17
Vision Outcome: Starting Well                  GM Priority: Young people equipped for life                     People Priority: Our children have skills and aptitudes to make their way in the world

Headline Indicator: % YP academic age 16 and 17 NEET
                                                                   Good is: Lower                        R

                                                                   Baseline: 2.83 (2015)

The proportion of young people in Bolton
                                                                   Target: 3.0
of academic age 16 and 17 who are Not in
Education, Employment or Training (NEET)
is 3.9%1                                                                Link between Vision Outcomes, People
                                                                              Priorities and GM Priorities
From September 2016, the DfE changed the
                                                                                        VO4
methodology of reporting those young persons
who are Not in Education, Employment or                                            GM         PS3
Training. Therefore, benchmarking data prior                                        2
to 2016 is not available.

Under previous methodology Bolton’s rate in
2015 was 2.83%.                                                    Strong partnership arrangements are in place at Post 16 led by the 11-25 Team Manager. A dedicated external adviser is attached to the
                                                                   schools with sixth forms who provides support and challenge via the Bolton Learning Partnership model. Connexions Bolton is a sub
                                                                   contractor on the GM Esf Skills for Growth Programme which provides opportunities to NEET young people.
The number of young people in Bolton NEET
                                                                   The LA is a key partner in the Bolton Work Based Learning Network which includes work based learning providers and FE colleges from
has continued to raise from levels seen in
                                                                   the town. Strong partnership arrangements are in place with GM Higher to support our NCOP schools with the LA being a key member of
2017-18. Bolton is ranked 120 in England out                       the Steering Group. Bolton also has the Team Bolton Partnership which is a work and skills collaboration of public and voluntary sector
of 152 authorities.                                                partners in Bolton led by the LA.

                                                                   The partnership uses a multi-agency approach, working closely with employers. The Partnership uses existing resources including Skills
                                                                   funding where appropriate to provide responsive employment and skills support. This is with the aim that all our residents are able to
                                                                   (re)connect with learning, develop skills and capitalise on local employment opportunities. Helping our residents including our young
                                                                   people to become more self-reliant and promoting a culture of enterprise are key to the Partnership’s delivery.

                                                                   The Partnership works closely with employers to support them to grow in Bolton and support the local community including recruiting
                                                                   local people. Our businesses span sizes and sectors and we collaborate with them on apprenticeships, entry level and above roles;
                                                                   upskilling existing staff and many other areas.
Notes

1
 Latest published data based on the DfE National Indicator (2018-19).
Source: Department for Education (DfE) Statistical Release
Frequency: Annual

                                                                                                                                                                                             18
Vision Outcome: Living Well    GM Priority: Healthy lives, with good care available for those that need it                                                       People Priority: People can exercise choice and control, and live independently

Headline Indicator: Proportion of Section 42 Enquiries where the Risk is
either reduced or removed                                                                                                           Proportion of Section 42 Enquiries where the Risk is either
                                                         Good is: Higher                    A                                                          reduced or removed
                                                                                                  100%
This indicator measures:                                 Baseline: N/A                             90%
                                                                                                   80%
                                                                                                   70%
The proportion of Section 42 Enquiries where the                                                   60%
                                                                                                   50%
Risk is either reduced or removed                        Target: N/A                               40%
                                                                                                   30%                                                                                                                                                                                                                                                                                                                           Risk Removed
                                                         GM: 84%                                   20%
An enquiry is any action that is taken (or                                                         10%
                                                                                                    0%                                                                                                                                                                                                                                                                                                                           Risk Reduced
instigated) by a local authority in response to            Link between Vision Outcomes, People

                                                                                                                                                                                                                                                                                                                                        St Helens
                                                                                                                                                                          Bury
                                                                                                                                                                                 Cheshire East

                                                                                                                                                                                                                                                                                                                                                                                                   Wigan
                                                                                                                                                                                                 Cheshire West and Chester
                                                                                                                                                                                                                             Cumbria

                                                                                                                                                                                                                                                                        Liverpool

                                                                                                                                                                                                                                                                                                                                                                                                           Wirral
                                                                                                                                                                                                                                       Halton
                                                                                                                                                                                                                                                Knowsley

                                                                                                                                                                                                                                                                                                          Rochdale

                                                                                                                                                                                                                                                                                                                               Sefton

                                                                                                                                                                                                                                                                                                                                                                Tameside
                                                                                                                                                                 Bolton

                                                                                                                                                                                                                                                                                                                     Salford

                                                                                                                                                                                                                                                                                                                                                    Stockport
                                                                                                         North West Member

                                                                                                                                                                                                                                                           Lancashire
                                                                                                                                                     Blackpool

                                                                                                                                                                                                                                                                                                                                                                                      Warrington
                                                                                                                                                                                                                                                                                                 Oldham
                                                                                                                                                                                                                                                                                    Manchester

                                                                                                                                                                                                                                                                                                                                                                           Trafford
                                                                                                                             Blackburn with Darwen

                                                                                                                                                                                                                                                                                                                                                                                                                    North West
                                                                 Priorities and GM Priorities                                                                                                                                                                                                                                                                                                                                    Risk Remained
indications of abuse or neglect in relation to an
adult with care and support needs                                          VO5

Bolton’s latest published performance on this                         GM         PS6
                                                                       9
indicator is 75%.
                                                         Performance has been consistently above NW averages for some time but the region does not perform as well as other
In 2016/17, Bolton’s performance was:
                                                         parts of the country. Bolton remains below national averages where “no further action” has been the outcome of the
                                                         safeguarding enquiry and has a lower percentage (46%) where risk is reduced compared to 2015/16 figures but below the
    •   0.2% higher than the national average
                                                         national average.
    •   9% above than the North West average
                                                         Data has been monitored over some time, and the position is now considered to be stable in the terms of the volume of
    •   8% above the England average                     enquiries. Analysis of safeguarding performance is a priority for Bolton Safeguarding Adults Board, and data is closely
    •   Ranked 9th in the North West Region              monitored. The dedicated Safeguarding team in Adult Social Care at the MASSS (Multi-agency Screening and Safeguarding
                                                         Service) alongside partners and BSAB subgroups are examining effective practice, recording and outcomes and the
                                                         experience of service users. Bolton has been been working with Liverpool City Council via a Peer Review of Safeguarding
                                                         Adults, to share good practice and identify areas for development.
Notes
1
 Latest published data 2016/17
Source: Safeguarding Adults Return (SAR)
Frequency: Annual

                                                                                                                                                                                                                                                                                                                                                                                                                                    19
Vision Outcome: Starting Well       GM Priority: Young people equipped for life            People Priority: Our children have skills and aptitude to make their way in the world

Headline Indicator: Good level of development at Early Years Foundation
Stage (EYFS)
                                                   Good is: Higher                   G
Definition of indicator
                                                   Baseline: 47.6 at 2013
Following an independent review of the EYFS
by Dame Clare Tickell, a new Profile was
published for implementation for the 2012/13       Target: 67%
school year.
                                                   GM: 67.5%
The new Profile and revised EYFS have a
stronger emphasis on the three prime areas          Link between Vision Outcomes, People
which are most essential for children’s healthy           Priorities and GM Priorities
development: communication and language;
physical; and personal, social and emotional                        VO4
development.
                                                               GM         PS3
The new Profile made changes to the way in                      2
which children are assessed at the end of the
EYFS and requires practitioners to make a
best-fit assessment of whether children are
emerging, expected or exceeding against each       Bolton’s Good Level of Development (GLD) has decreased by 0.2% to 67.3% in the most recent data available. Due to a
of the new 17 early learning goals.                Government pilot to revise the Foundation Stage Early Years Profile for 2021 one of Bolton’s highest performing schools
                                                   did not submit GLD data to this set. This accounts for the 0.2% drop in this year’s data which would mean Bolton’s static
Headline information on this indicator             trend is in line with the GM and regional (68.9%). static rates. There was a marginal increase nationally (71.8% from
                                                   71.3%). The 15% attainment gap between children receiving Free School Meals and all children in Bolton is in line with the
Current performance is 67.3%, which is a slight    national figure.
fall from last year. Bolton is currently ranked
                                                The 2019 GLD attainment gap has also narrowed for children with English as an Additional Language with a increase of
135 nationally out of 152.                      1.8% to 60.6% achieving GLD and 22.9 % of children with Special Educational Needs Disabilty achieved a GLD. The 2019
                                                   GLD gap has widened by 1.8% for most disadvantaged including Free School Meals and Looked After Children with 52%
                                                   achieving a GLD.
Notes
1
 Latest published data 2019
Source: DfE
Frequency: Annual

                                                                                                                                                                            20
Vision Outcome: Starting Well                  GM Priority: Young people equipped for life          People Priority: Our children are safe, healthy and active

Headline Indicator: Rate (per 10,000) subject to a Child Protection Plan
                                                           Good is: N/A                       R
              1
The latest published rate of children
who were the subject of a child                            Baseline: 39.3 (2017/18)
protection plan in Bolton is 48.0 per
10,000 of the population.
                                                           Target: N/A
Bolton’s rate was 8.7 percentage points higher
in 2018/19 than in 2017/18. However, was:
                                                                             VO4
• 12.5 children per 10,000 of the population
  lower than Bolton’s Statistical Neighbour                             GM         PS1
  average (60.5)                                                         2

• But 4.3 children per 10,000 of the                         Link between Vision Outcomes, People
                                                                   Priorities and GM Priorities
  population higher than the National
                                                           The Safeguarding Service manages a cohort of Bolton’s most vulnerable children subject to child protection
  average (43.7)
                                                           plans, long term child in need plans and children in care proceedings through to adoption. Caseloads have
                                                           increased year on year for the last 3 years, though Bolton’s Child Protection Plan (CPP) rates are low compared
The local data2 for this quarter has seen an               to our peers.
increase in the rate subject to a CPP from the
previous quarter (Q1 = 38.4 and Q2 = 53.5).                Numbers of Children requiring a safeguarding intervention are fluctuating from month to month but the overall
This is above the published data for 2017/18               trend is for a lower level of referrals. However, levels of Children and Young people classed as Children in Need
and above the latest available national data,              or needing a higher level safeguarding intervention are more stable. The Department continues to work closely
but below North West comparator data.                      with partners to identify and respond to key safeguarding issues which require action on a multi-agency basis.
However, the percentage who became the
subject of a plan for a second or subsequent
time has remained stable since the previous
quarter.

No comparator benchmarking is set for this indicator

Notes
1Latest published data based on the DfE National Indicator (2019).
Source: Department for Education (DfE) Statistical Release
Frequency: Annual
2 Local data is available monthly and quarterly from management information reports.

                                                                                                                                                                 21
Vision Outcome: Starting Well                GM Priority: Young people equipped for life                   People Priority: Our looked after children aspire and achieve

Headline Indicator: Rate (per 10,000) of Looked After Children
The latest published rate of Looked After                                                                                  Rate (per 10,000) of Looked After Children
                                                                Good is: Lower                       A
Children (LAC) in Bolton is 87 per 10,000 of                                                               100.00
the population (580 children)1                                  Baseline: 85.0 (2016)                       90.00
                                                                                                            80.00
                                                                Target: 85.0 per 10,000 of the              70.00
Bolton’s rate of LAC was 2.4% higher in 2017 than
in 2016                                                         population.                                 60.00
                                                                GM: 84                                      50.00
                                                                                                            40.00
In 2017, Bolton’s rate was:                                         Link between Vision Outcomes, People
                                                                                                            30.00
                                                                          Priorities and GM Priorities
                                                                                                            20.00
• 25 children per 10,000 of the population higher                                   VO4                     10.00
  than the National average (62.0)                                                                           0.00
                                                                               GM         PS4                       2009      2010    2011    2012   2013     2014     2015    2016   2017
• 6.1 children per 10,000 of the population                                     2
                                                                                                                     Bolton          North West       Statistical Neighbours      England
  higher than Bolton’s Statistical Neighbour
  average (80.9)
                                                                Numbers of looked after children have continued to rise in Bolton due to various factors - the reception of a number of sibling groups
                                                                into care, comparatively low numbers of discharges from care, and the proportion of children looked after under Interim Care Orders
• 3 children per 10,000 of the population higher                is also increasing. The proportion of young people whose cases are open to the Leaving Care Team and who are in touch with the
  than the Greater Manchester average (84.0)                    team is notably higher the national average. Increasing complexities of children and young people are adding to pressures. The
                                                                changing nature of communities means the likelihood of placements with multiple siblings is increasing.
                                                                Bolton’s Looked After Children Strategy was refreshed in Autumn 2017, re-stating Bolton Council’s commitment to ensuring that life
In 2017, the percentage of Looked After                         chances for Looked After Children are maximised.
Children Adopted was 23%                                        27% of children are placed out of borough, which is lower than statistical neighbours; a review of external placements has
                                                                commenced to consider return to placement nearer Bolton. A Tracker will help continue to drive the discharge of Care Orders which
                                                                will reduce numbers of LAC and subsequently increase capacity within the service, along with the drive to ensure children have a
This is 3 percentage points lower than the previous
                                                                permanent placement. To increase the number of children in permanent foster placements, 40 children have been identified to be
year. Bolton’s rate of LAC adopted remained higher              approved as long term by the end of the year. Improved planning at case transfer stage will lead to improved quality of social work as
than its comparators at 8 percentage points higher              receiving social workers and families have a clear understanding of plans and expectations.
than the national average and 3.6 percentage                    A project has been initiated to review and improve the commissioning of services to ensure we achieve outcomes for our Looked After
points higher than the Statistical Neighbour                    Children and reduce placement costs.
average.
Notes

1Latestpublished data based on the DfE National Indicator (2017).
Source: Department for Education (DfE) Statistical Release
Frequency: Annual

                                                                                                                                                                                            22
Vision Outcome: Starting Well              GM Priority: Children starting schools ready to learn           People Priority: Our children have skills and aptitudes to make their way in the world

Headline Indicator: % of all pupils achieving the expected standard in                             % of all pupils achieving the expected standard in Reading, Writing and Maths at Key
                                                                                                                                       Stage 2 (KS2)
Reading, Writing and Maths at Key Stage 2 (KS2)
                                                         Good is: Higher                   G
Definition of indicator                                                                             70.0
                                                         Baseline 56 % in 2016
The combined reading, writing, and maths measure
uses the reading and maths test results along with                                                  65.0
the outcome of the writing teacher assessment            Target: 57.3%
(TA). To reach the expected standard in all of
reading, writing and maths, a pupil must achieve a                                                  60.0
scaled score of 100 or more in reading and maths
tests and an outcome of 'reaching the expected            Link between Vision Outcomes, People
standard' or 'working at greater depth' in the writing          Priorities and GM Priorities        55.0
TA. Together, these subjects give a broad measure
of pupil attainment. To reach the higher standard, a                      VO4
pupil must achieve a scaled score of 110 or more in                                                 50.0
the reading and maths tests, and an outcome of                       GM         PS3                              2015-16              2016-17             2017-18              2018-19
‘working at greater depth’ in the writing TA.                         1

Attainment in all of reading, writing and maths is                                                           Bolton        North West        Statistical Neighbours      England         GM
not directly comparable to earlier years (2016 and
2017) because of changes to the writing TA
frameworks in 2018.                                      Attainment at the end of Key Stage 2 over the last 3 years is relatively stable but for the first time in 4 years the
Headline information on this indicator                   combined attainment measure is below the national average. This is due to a dip in reading outcomes in 2019.
                                                         62% of pupils reached the expected standard in all of reading, writing and maths combined, down from 66% in
Current performance 62%, representing a fall             2018. 11% of pupils reached the higher standard in 2019, up from 10% in 2018 and in line with the national
of 4 percentage points from last year, currently         figures.
ranked 106 in England out of 152, however still
remains above target.                                    Pupil progress across KS2 in 2019 continues to be positive in all 3 subjects.

Notes

1
 Latest published data 2019
Source: DfE
Frequency: Annual

                                                                                                                                                                                    23
Vision Outcome: Starting Well         GM Priority: Children starting school ready to learn     People Priority: Our children have skills and aptitude to make their way in the world

Headline Indicator: Average Attainment 8 score per pupil
                                                   Good is: Higher                    A                           Average Attainment 8 Score per pupil
                                                                                             50.0

Definition of indicator                            Baseline: 48.2, for 2015                  48.0

Attainment 8 measures the average                                                            46.0
achievement of pupils in up to 8 qualifications    Target: 50%
including English (double weighted if the          GM: 45.5%                                 44.0
combined English qualification, or both
language and literature are taken), maths            Link between Vision Outcomes, People    42.0
                                                           Priorities and GM Priorities
(double weighted), three further qualifications
that count in the English Baccalaureate                              VO4                     40.0
(EBacc) and three further qualifications that                                                          2014-15         2015-16          2016-17         2017-18          2018-19
can be GCSE qualifications (including EBacc                     GM         PS3
subjects) or any other non-GCSE qualifications                   1                                  Bolton        North West         Statistical Neighbours       England        GM
on the DfE approved list.

Headline information on this indicator             The Bolton Learning Partnership adds capacity to the local system through sharing and developing best practice; joint
                                                   professional development at all levels; coherent recruitment of staff at all levels; short term school to school improvement
Current performance 44.5. This represents a        support and the provision of an ‘External Adviser’ to provide further support and stretch. This local capacity is
slight fall from last year. Ranked 108 in          supplemented by our engagement with both regional and national agencies.
England out of 152 authorities. Comparator
authorities have also fallen though England        Nearly all headline measures showed an improved attainment position from the previous year and a continued positive
average as a whole has increased.                  trend. Two measures that dipped slightly were Maths at Level 5 and EBACC Languages at Level 4 – but these were both
                                                   noticeably higher than 2 years previously.There is a positive picture when comparing the improving performance in Bolton
                                                   schools relative to other Greater Manchester authorities.

Notes
1
 Latest published data 2019
Source: DfE
Frequency: Annual

                                                                                                                                                                            24
Vision Outcome: Starting Well       GM Priority: Children starting school ready to learn           People Priority: Our children have skills and aptitude to make their way in the world

Headline Indicator: Average Progress 8 score per pupil
                                                   Good is Higher                     A                           Average Progress 8 score per pupil
                                                                                            0.0
Definition of indicator                                                                               2015-16              2016-17               2017-18              2018-19
                                                   Baseline: - 0.2 in 2016                                                   -0.1
                                                                                            -0.1
Progress 8 aims to capture the progress a                                                                                                          -0.1
                                                                                                        -0.1
pupil makes from the end of Key Stage 2 to the                                                                                                     -0.1                 -0.1
                                                                                            -0.1
end of Key Stage 4. It compares pupils’                                                                                      -0.1
                                                   Target: - 0.12                                       -0.2
                                                                                                                                                   -0.2
achievement – their Attainment 8 score – with                                               -0.2
the average Attainment 8 score of all pupils                                                                                                                            -0.2
                                                                                                        -0.2
nationally who had a similar starting point (or                                             -0.2
                                                                     VO4
‘prior attainment’), calculated using                                                                                        -0.3
assessment results from the end of primary                      GM                          -0.3
school.                                                                    PS3
                                                                 1
Progress 8 is a relative measure, therefore the                                             -0.3
                                                     Link between Vision Outcomes, People
national average Progress 8 score for                      Priorities and GM Priorities
mainstream schools is very close to zero.
When including pupils at special schools the
national average is not zero as Progress 8                                                         Bolton       North West          Statistical Neighbours      England             GM
scores for special schools are calculated using
Attainment 8 estimates based on pupils in          The Bolton Learning Partnership adds capacity to the local system through sharing and developing best
mainstream schools                                 practice; joint professional development at all levels; coherent recruitment of staff at all levels; short term school
                                                   to school improvement support and the provision of an ‘External Adviser’ to provide further support and stretch.
Headline information on this indicator             This local capacity is supplemented by our engagement with both regional and national agencies.
The Bolton Progress 8 score (-0.20) has            Nearly all headline measures showed an improved attainment position from the previous year and a continued
dropped slightly since 2018 but remains higher     positive trend. Two measures that dipped slightly were Maths at Level 5 and EBACC Languages at Level 4 –
than 2017.                                         but these were both noticeably higher than 2 years previously. There is a positive picture when comparing the
                                                   improving performance in Bolton schools relative to other Greater Manchester authorities.

Notes
1
 Latest published data 2019
Source: DfE
Frequency: Annual

                                                                                                                                                                               25
People Priority: Our children have skills and aptitude to make
Vision Outcome: Starting Well                             GM Priority: Children starting school ready to learn
                                                                                                                            their way in the world
Headline Indicator: Percentage of Primary Schools Good or Better
                                                    Good is Higher                    G               Percentage of Primary Schools/Pupils Good or Better
Definition of indicator
                                                                                            100.00%
                                                    Baseline: 86% in 2015                    90.00%
This indicator measures the proportion of                                                    80.00%
publicly funded mainstream Primary Schools in                                                70.00%
Bolton ranked Good or Better by Ofsted at                                                    60.00%
                                                                                             50.00%
their most recent full Ofsted inspection. The       Target: Not set                          40.00%
proportion of pupils in Bolton attending a good                                              30.00%
or better school is included to provide                                                      20.00%
                                                     Link between Vision Outcomes, People    10.00%
additional context. As at 30 June 2019, the                Priorities and GM Priorities
                                                                                              0.00%
indicator includes the data of 97 schools - thus
each inspection result shifts the headline figure                    VO1
by just over one percentage point.
                                                                GM         PE3
                                                                 1
Headline information on this indicator                                                                 % Of Schools Good or Better        % of Pupils attending Good or Better schools

Bolton is ranked 79th out of 152 in the country     The Primary School Improvement Group brings together representatives of Bolton Primary Headteachers
at the end of Quarter 2 with 88.7% of primary       across Bolton with School Improvement professionals from the Local Authority, and termly briefings for Primary
schools judged to be good or outstanding. On        Heads are facilitated by the local authority. These meetings inform strategic decision making – for example the
this measure Bolton remains above the               views of our partners helped to shape the primary Service Level Agreement. Partnership groups provide a
England average of 87.5%. On the measure            context for our improvement offer to individual primary schools. These are delivered through specific pathways
for the proportion of pupils attending a good or    of support dependent on whether they are causing concern or have been identified as being vulnerable to being
outstanding school, Bolton is ranked 67th in        judged RI or inadequate by Ofsted.
the country and remains above the England
average. 90.1% of Bolton primary pupils attend      The Primary School Improvement Team deliver and commission (through Teaching Schools and other partners)
a good or outstanding school compared to            bespoke CPD to meet the identified needs of schools. The training is well attended and evaluated positively.
87.5% nationally.

Notes
1
 Latest published data September 2019
Source: Watchsted analysis of Ofsted Inspection
Frequency: Quarterly

                                                                                                                                                                              26
People Priority: Our children have skills and aptitude to make
Vision Outcome: Starting Well                            GM Priority: Children starting school ready to learn
                                                                                                                            their way in the world
Headline Indicator: Percentage of Secondary Schools Good or
Better
                                                                                                       Percentage of Secondary Schools/Pupils Good or
                                                   Good is Higher                    A
                                                                                                                           Better
Definition of indicator                            Baseline: 65% in 2015                   100.00%
                                                                                            90.00%
This indicator measures the proportion of                                                   80.00%
publicly funded mainstream Secondary                                                        70.00%
                                                   Target: TBC                              60.00%
Schools in Bolton ranked Good or Better by
Ofsted at their most recent full Ofsted                                                     50.00%
inspection. The proportion of pupils in Bolton      Link between Vision Outcomes, People    40.00%
attending a good or better school is included to          Priorities and GM Priorities      30.00%
provide additional context. As at 30                                                        20.00%
                                                                    VO1
September 2019, the indicator includes the                                                  10.00%
data of 19 schools - thus each inspection result               GM                            0.00%
                                                                          PE3                        01/09/2015    01/09/2016       01/09/2017   01/09/2018      Q1 2019-20     Q2 2019-20
shifts the headline figure by over five                         1
percentage points.                                                                                    % of Schools Good or Better          % of Pupils attending a Good or Better School

Headline information on this indicator             The Bolton Learning Partnership adds capacity to the local system through sharing and developing best
                                                   practice; joint professional development at all levels; coherent recruitment of staff at all levels; short term school
Bolton’s secondary schools now rank 107th out      to school improvement support and the provision of an ‘External Adviser’ to provide further support and stretch.
of 152 in the country with 68.4% of secondary      This local capacity is supplemented by our engagement with both regional and national agencies.
schools judged to be good or outstanding, with
69.7% of secondary pupils in Bolton attending      The key system capacity challenge that remains is the recruitment of quality staff at all levels. The situation in
a good or outstanding school.                      Bolton is consistent with the national picture and the Bolton Learning Partnership is considering strategies to
                                                   support the process in terms of both recruitment and retention.

Notes
1
 Latest published data Sept 2019
Source: Watchsted analysis of Ofsted Inspection
Frequency: Quarterly

                                                                                                                                                                                27
You can also read