CORPORATE PRESENTATION JANUARY 2020 - JUMBO Group
←
→
Page content transcription
If your browser does not render page correctly, please read the page content below
CORPORATE PRESENTATION
JANUARY 2020
IMPORTANT NOTICE
                     JUMBO GROUP LIMITED CORPORATE PRESENTATION
DISCLAIMER
This presentation is prepared for information purposes only, without regard to the objectives, financial situation nor needs of any specific person. This
presentation does not constitute or form any part of any offer for sale or subscription of, or solicitation of any offer to buy or subscribe for, any securities nor
shall it or any part of it form the basis of, or be relied on in connection with, any contract or commitment whatsoever.
This presentation was prepared exclusively for the parties presently being invited for the purposes of discussion. Neither this presentation nor any of its content
may be distributed, reproduced, or used without the prior written consent of Jumbo Group Limited (“Company”). The Company does not make any
representation or warranty, expressed or implied as to the accuracy of the information contained herein, and expressly disclaims any and all liability based, in
whole or in part, on such information, errors therein or omissions therefrom.

FORWARD-LOOKING STATEMENTS
This presentation may contain certain forward-looking statements with respect to the financial condition, results of operations and business of the Company
and its subsidiaries and certain of the plans and objectives of the management of the Company and its subsidiaries. Such forward-looking statements involve
known and unknown risks, uncertainties and other factors which may cause the actual results or performance of the Company and its subsidiaries to be
materially different from any future results or performance expressed or implied by such forward-looking statements. Such forward-looking statements were
made based on assumptions regarding the present and future business strategies of the Company and its subsidiaries and the political and economic
environment in which the Company and its subsidiaries will operate in the future. Reliance should not be placed on these forward-looking statements, which
reflect the view of the management of the Company and its subsidiaries as of the date of this presentation only.

CONFIDENTIALITY
This presentation is given to you on a confidential basis and solely for your information and must not be reproduced, disclosed, distributed or passed to any
other person. No copy of this presentation shall be taken or transmitted to any country where distribution or dissemination of this presentation is prohibited. By
accepting this presentation, you agree to be bound by the limitations and restrictions set out herein.

                                                                                                                                                                       2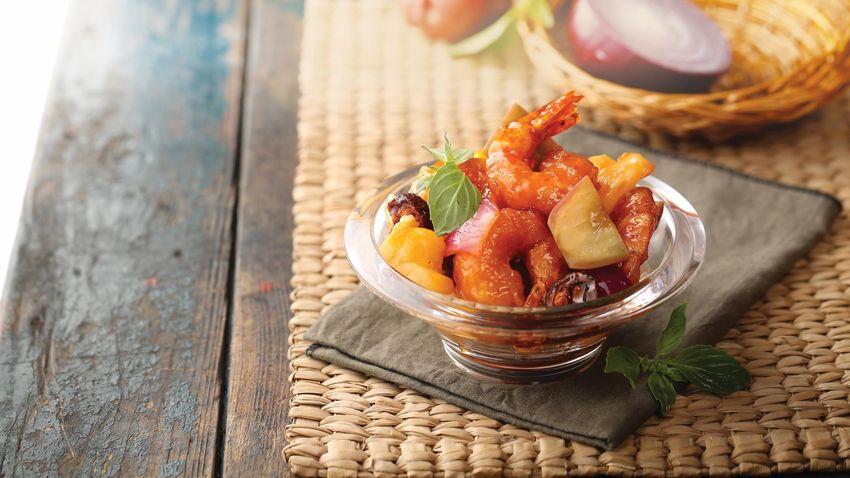
AGENDA
•   Corporate Overview
•   Our Brands’ Developments
•   Growth Strategies
•   Latest Financials
C O R P O R AT E
  O V E RV I E W
ABOUT JUMBO
           OUR HUMBLE                                       OUR CURRENT
           BEGINNINGS                                       ACHIEVEMENTS

• Started out in Singapore in 1987 with a single   • One of Singapore’s leading multi-dining concept F&B
  JUMBO Seafood outlet (now our flagship             establishments
  restaurant) at the East Coast Seafood Centre     • Listed on SGX Catalist since November 2015
                                                   • Famous for its Award-Winning Chilli Crab, a symbolic
                                                     dish of Singapore
                                                   • Operates a network of 38 outlets, spanning across 15
                                                     cities in Asia                                         5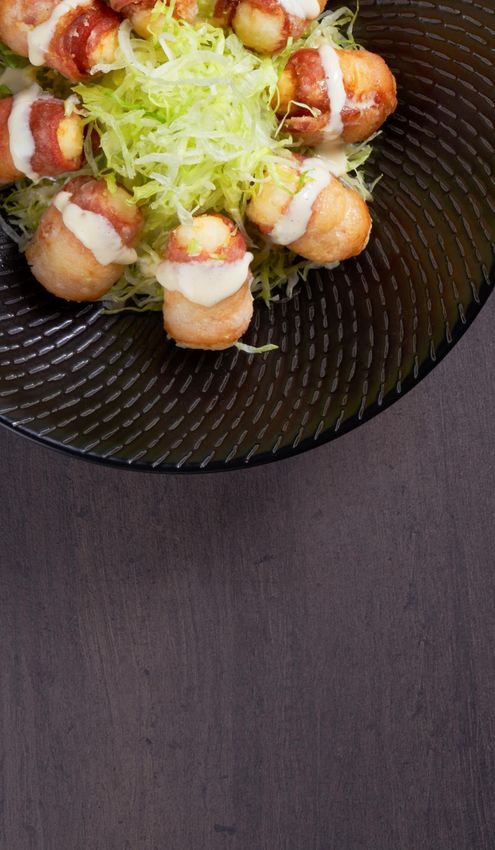
Beijing
                                       Seoul
                           Ilsan
                                               Osaka   Tokyo     We own 6 brands…
       Xi’an

                    Shanghai

                           Fuzhou
                              Taoyuan
                                Taipei
                                   Hsinchu
                                   Taichung

   Bangkok
                Ho
                Chi
                                                               and manage 2 brands…
                Minh

Singapore
                                                                across 15 Cities
                                                                    in Asia           6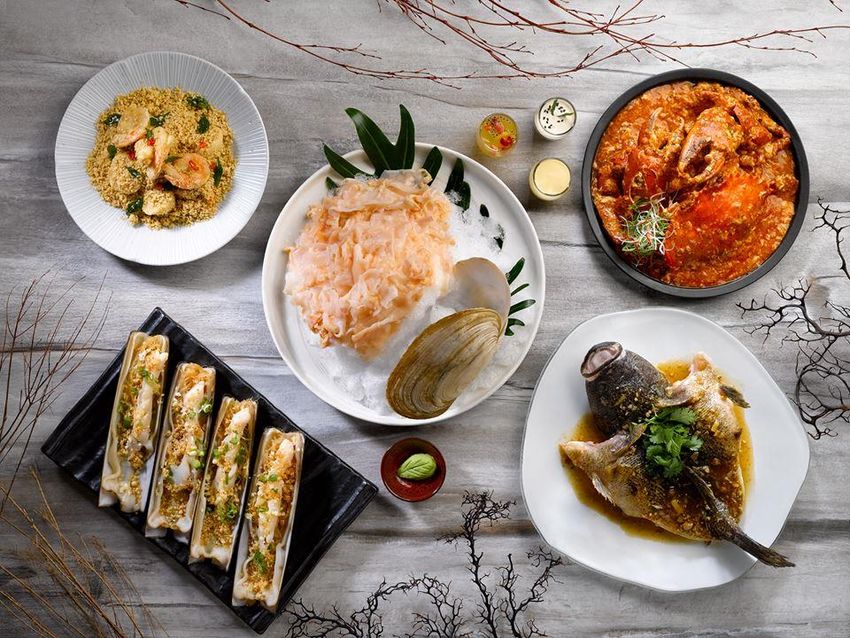
THE BIG NAME IN
                SEAFOOD

1.9 tonnes        9,000              1,200
 of crabs sold   diners served     staff employed in
   each day          daily       Singapore and China
                                                       7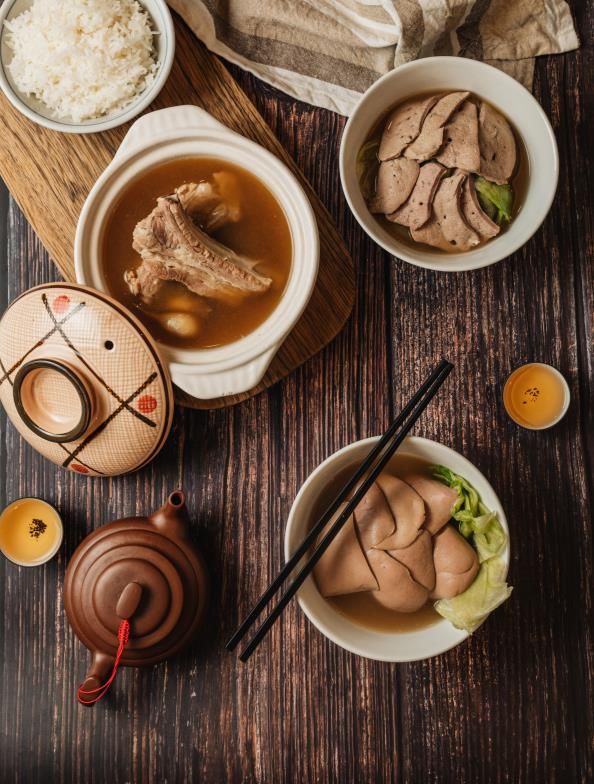
CORPORATE MILESTONES
      OUR                  OVERSEAS                     START OF            GROWTH OF OUR         CREATION OF NEW          CREATION OF NEW
   BEGINNING              EXPANSION                   FRANCHISING             BKT BRAND              CHICKEN RICE            CASUAL DINING
                                                                                                         BRAND                   CONCEPT
  Flagship JUMBO         Flagship JUMBO            First JUMBO Seafood     First NASBKT Outlet
                       Seafood Restaurant          Franchise Opened in     Opened in Shanghai         First XINYAO        First JUMBO Kitchen
Seafood Restaurant
                            in Shanghai                 Ho Chi Minh                              Hainanese Chicken Rice     Outlet Opened in
    in Singapore
                                                                                                    Outlet Opened in             Shanghai
                                                                                                        Shanghai
     1987                    2013                         2017                                               2019

                2008                        2015                           2018

           SCALING UP FOR               GOING                  BEING A             BKT STEPPING OUT
              EXPANSION                 PUBLIC               FRANCHISEE              OF SINGAPORE
       Establishment of JUMBO       Listed on SGX          First Tsui Wah Cha        First NG AH SIO
            Central Kitchen             Catalist          Chaan Teng brought      Bak Kut Teh (NASBKT)
                                                             into Singapore     Franchise Opened in Taipei

                                                                                                                                                8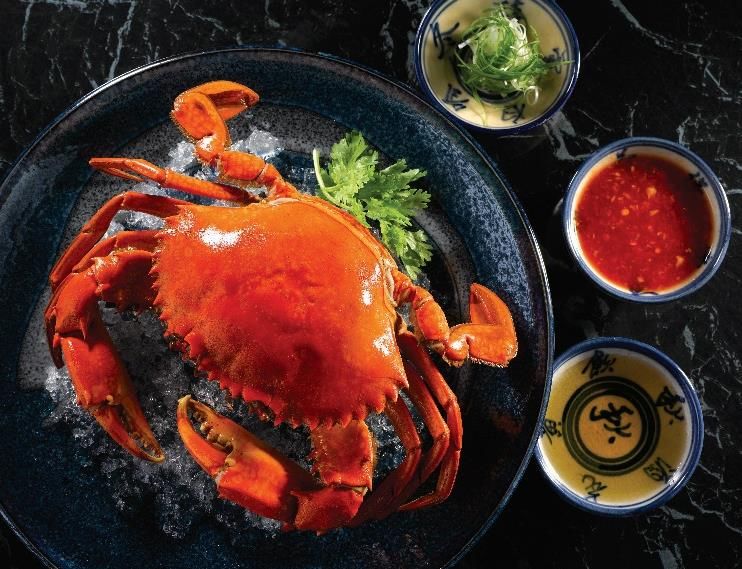
NETWORK EXPANSION,
                        GROWING TOPLINE
                                                              153.7          153.6    2015 – 2019 Revenue
Revenue, S$m             136.8
                                              145.3                                       CAGR: 5.8%
               122.8                                                                        38
                                                                               34
                                                                                            12
                                                                28             10
                                                25
                22        23                                    9
                                                 5
                 4        4
Number of
outlets
                                                                               24           26
                18        19                    20              19

               FY15      FY16                  FY17           FY18            FY19         Dec-19
                                Self Managed Outlets   Franchised Outlets   Revenue
                                                                                                            9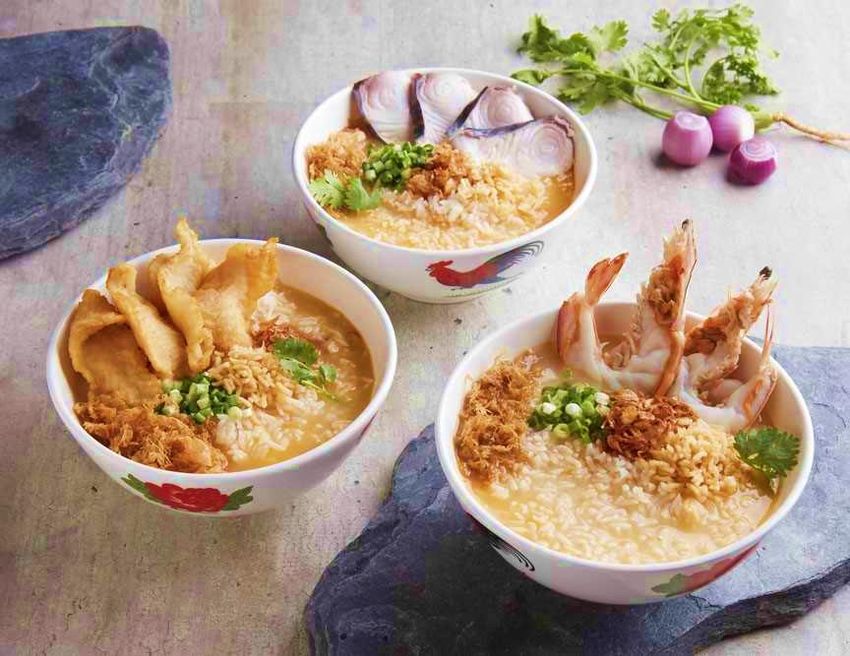
NEW OUTLET
                                      OPENINGS
                                                             2019
                     BRANDS
                                               NEW OUTLETS                  CITIES
JUMBO Seafood
 Self Managed                                       1           Singapore
 Franchised                                         2           Seoul & Ilsan
JUMBO Kitchen (Self Managed)                        1           Shanghai
Zui Teochew Cuisine (Self Managed)                  1           Singapore
Chao Ting (Self Managed)                            1           Singapore
NASBKT
 Self Managed                                       1           Shanghai
 Franchise                                          3           Hsinchu, Taipei, Taoyuan
XINYAO Hainanese Chicken Rice (Self Managed)        1           Shanghai
Tsui Wah (Self Managed)                             1           Singapore
Total                                              12

                                                                                           10
OUR BRANDS’ DEVELOPMENTS
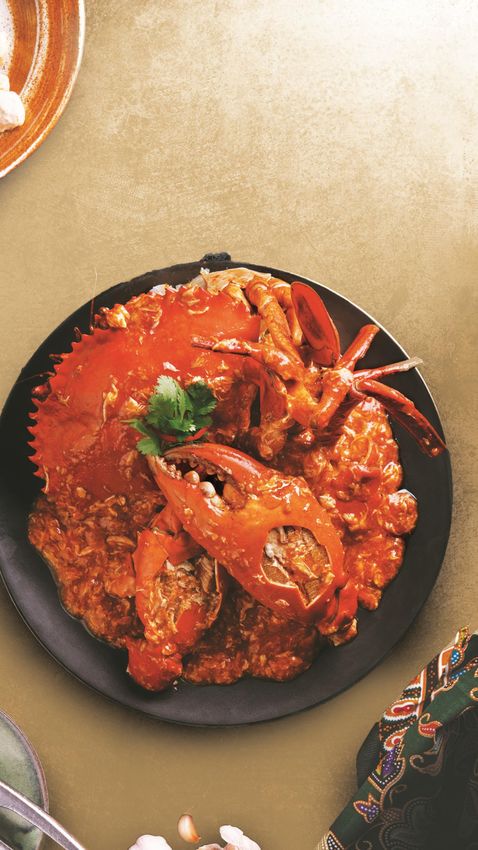
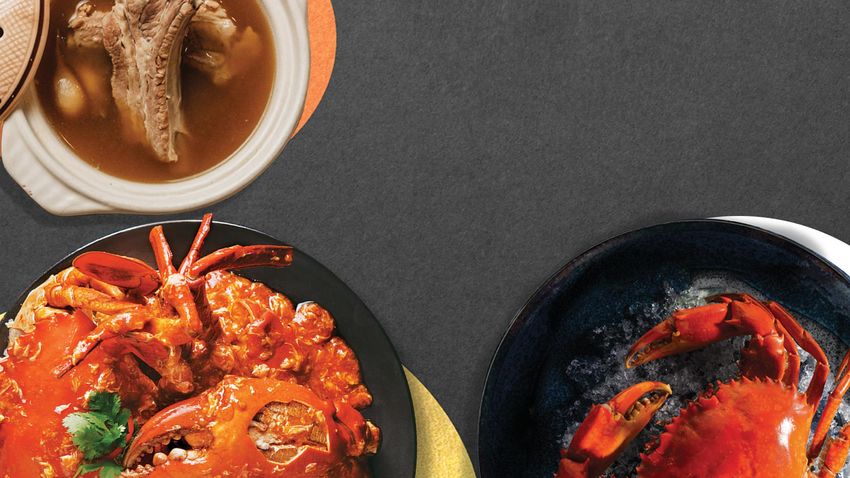
•    Our pioneer brand – Renowned for its Singapore-
     style seafood cuisine
•    Iconic Award-Winning Chilli Crab
                  Number of
      Cities
                   Outlets
                              2 new outlets added in 2019, namely
     Singapore       6
                              ION Orchard & Jewel
     Shanghai        3
      Beijing        1
       Xi’an         1
      Fuzhou         1
     Taichung        1        Jumbo Group took over the
      Taipei         1        management of these 2 outlets in 2019

    Ho Chi Minh      1
     Bangkok         1
                              Franchised Outlets
       Seoul         1
       Ilsan         1
       Total         18
                                                                      12
• A new concept created in 2019, aimed to cater
to the growing population of smaller families
and the next generation
• Positioned as casual, quality yet affordable
Singapore-style seafood cuisine
First outlet started
in Shanghai
in October 2019
13• Founded in 1955 with over a million bowls
served since then
• A heritage dish renowned for its savoury, pork-
based, peppery Teochew style soup
Number of
Cities
Outlets
Singapore 4
Shanghai 1 New outlet opened in December 2019
Taipei 2
Hsinchu 1 Franchised Outlets
Taoyuan 1
Total 9
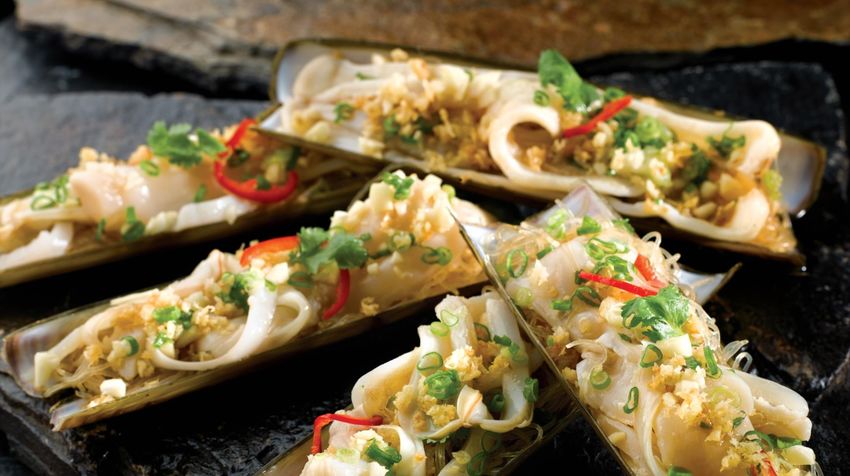
14• Well-known for high-quality, refined iconic
Teochew classic dishes
• Strategically located within sites of historic
significance in Singapore, syncing nicely with
the elegance of Teochew cuisine
Our second outlet, opened
in April 2019, is located
within a beautiful
two-storey heritage
building at Far East Square
15• Another creative new concept introduced in
2019, aimed at the fast-moving crowd who still
yearns to savour a bowl of delicious quality
seafood broth without heading to a restaurant
• Casual quick-service establishment specialising
in Teochew ‘Pao Fan’ – Perfectly cooked grains
of rice served in flavourful broth
First outlet started operations
in April 2019, at Far East
Square in Singapore
16• After BKT, we once again embark on the mission to
introduce one of Singapore’s famous national
dishes, the Hainanese Chicken Rice, to those abroad
• Choosing Shanghai as the testbed for this new
concept as this dish bonds the traditional culture
and flavours of the same origin between Hainan
(China) and Singapore
First outlet commenced
business in December 2019,
at One ITC, Shanghai
17• One of the most popular Hong Kong Style
“Cha Chaan Teng” names, Jumbo Group
brought the brand to Singapore in 2018, via a
joint venture with Tsui Wah
• A symbolic move as Tsui Wah establishes its
presence outside the Greater China region
A second outlet was added at
The Heeren, along Orchard
Road in September 2019
18• An unique collaboration between four of
Singapore’s best-loved seafood dining groups
• Finest of Singapore’s seafood cuisine
encapsulated under one roof
Number of
Cities
Outlets
Singapore 1 Managed by Jumbo Group
Tokyo 2
Licensed Outlets
Osaka 1
Total 4
19GROWTH S T R AT E G I E S
GROWTH DRIVERS
                                • Leveraging on strong brand equity of current brands to deepen presence
                                  in existing markets, via opening of new outlets, and expansion of
         ORGANIC EXPANSION        franchise / joint venture outlet network
                                • Innovation and development of new concepts

                                                 Acquisitions of reputable and quality brands in similar or complementary
                     INORGANIC GROWTH
                                                 industries to further strengthen our product offerings or enhance our
                                                 capabilities

  Expanding                                          Preparing for the future by focusing on these 4 key aspects:
Our Reach By            INFRASTRUCTURE &             • Increasing the efficiency and productivity of corporate and strategic
                                                        functions
Staying Ahead              CAPABILITIES              • Enhancing Central Kitchen & Logistic Functions’ capabilities to support
 of the Curve                                           growth and expansion
                                                     • Investing in Information Technology Systems to further strengthen our
                                                        competitive edge
                                                     • Developing a robust human capital development framework to attract and
                                                        groom the talents
                WIDEN REVENUE
                   SOURCES      • Retail packs    • Home Delivery
                                • Catering        • Collaborations

                                                                                                                            21
EXPANSION PLANS
• Adding at least 4 self-managed outlets, including:
- 1 x Tsui Wah in Singapore
- 2 x NASBKT, in Shanghai and Beijing respectively
- 1 x XINYAO Hainanese Chicken Rice in Shanghai
• Boosting the number of franchised outlets in:
- Greater China
- Thailand
- South Korea
- Vietnam
• Entering new high-potential markets:
- Macau
- Indonesia
- Australia
22SCALE-UP SG
JUMBO is honoured to be selected to
participate in the Scale-Up SG programme
SCALE-UP SG FRAMEWORK
PREPARE STRATEGISE ACCELERATE GRADUATE
COMPLETED IN PROGRESS
• Identification of key focus areas • Business expansion – to incubate new ideas
(i.e. revenue growth, M&A strategies and talent and expand product lines and concepts
management) • Digital transformation – to holistically address
• Setting aspiration targets technical, management and people systems
• Drafted roadmap to achieve key objectives within a digital environment to succeed
Note: Scale-Up SG is a programme initiated by Enterprise Singapore that helps selected high-growth local companies scale rapidly, become leaders in their fields
and be groomed into future global champions. 23L AT E S T FINANCIALS
FINANCIAL HIGHLIGHTS
   REVENUE                GROSS PROFIT
  S$153.6m                     S$97.9m
  (FY18: S$153.7m)            (FY18: S$96.6m)
  Down 0.1% YoY                Up 1.4% YoY

                     FY2019
     PATMI                      EBITDA
   S$11.7m                     S$19.4m
  (FY18: S$11.0m)             (FY18: S$18.3m)
    Up 5.9% YoY                Up 5.8% YoY

                                                25
FINANCIAL HIGHLIGHTS
Growing Topline, Stable Margins
62.9% 63.2% 63.4% 62.9% 63.8%
GP Margin
153.7 153.6
145.3
136.8
122.8
Revenue &
Gross Profit, S$m
92.1 96.6 97.9
77.3 86.5
FY15 FY16 FY17 FY18 FY19
Gross Profit Cost of Sales GP Margin
26FINANCIAL HIGHLIGHTS
Reaping the benefits of scale expansion with rebound in profitability
15.1% 16.1% 15.4%
EBITDA Margin 11.9% 12.6%
22.0 22.4
18.6 18.3 19.4
15.5 14.5
EBITDA &
10.6 11.0 11.7
PATMI, S$m
FY15 FY16 FY17 FY18 FY19
EPS (cents) 1.7 2.4 2.3 1.7 1.8
EBITDA PATMI EBITDA Margins
27FINANCIAL HIGHLIGHTS
Solidifying our leadership position at home ground amidst
uncertainty in overseas markets
Greater China,
18%
Revenue 20%
Breakdown by
Geography FY18
80%
FY19
Singapore, 82%
28FINANCIAL HIGHLIGHTS
Revenue mix shifts due to closing of JPOT. Stellar performance by
JUMBO Seafood Singapore, on back of 2 new outlets
Others, 2% Franchise, 1%
NASBKT, 6%
Zui Teochew
Cuisine, 9% 6%
Revenue
6%
Breakdown by
8%
Brands FY18 60%
JUMBO Seafood, 20% JUMBO Seafood,
China, 18% SG, 64%
FY19
29FINANCIAL HIGHLIGHTS
EBITDA movement, FY19 vs FY18
(S$’000)
+5.9%
-0.1% -2.5% -11.3% -0.6% -1.3% +6.6% +12.5% -3.1% N.M. +7.6% ->100%
30FINANCIAL HIGHLIGHTS
FY2019 FY2018 Variance
PROFIT & LOSS
S$'000 % of Revenue S$'000 % of Revenue S$'000 %
Revenue 153,631 100.0% 153,690 100.0% (59) (0.0%)
Cost of sales (55,690) 36.2% (57,098) 37.2% 1,408 (2.5%)
Gross profit 97,941 63.8% 96,592 62.8% 1,349 1.4%
Other income 2,380 1.5% 2,682 1.7% (302) (11.3%)
Employee benefits expense (47,196) 30.7% (47,504) 30.9% 308 (0.6%)
Operating lease expenses (14,098) 9.2% (14,289) 9.3% 191 (1.3%)
Utilities expenses (3,913) 2.5% (3,670) 2.4% (243) 6.6%
Depreciation expense (5,438) 3.5% (4,833) 3.1% (605) 12.5%
Other operating expenses (14,901) 9.7% (15,370) 10.0% 469 (3.1%)
Share of results of associates (824) 0.5% (115) 0.1% (709) 2.0%
Profit before tax 13,951 9.1% 13,493 8.8% 458 3.4%
Income tax expense (3,096) 2.0% (2,876) 1.9% (220) 7.6%
Profit for the year 10,855 7.1% 10,617 6.9% 238 2.2%
EBITDA 19,389 12.6% 18,326 11.9% 1,063 5.8%
Profit Attributable to Shareholders 11,668 7.6% 11,022 7.2% 646 5.9%
Earning Per Share (EPS) (Cents)
Basic and Diluted 1.8 1.7
31FINANCIAL HIGHLIGHTS
As at As at
ASSETS 30 Sep 2019 30 Sep 2018 LIABILITIES AND EQUITY 30 Sep 2019 30 Sep 2018
S$'000 S$'000 S$'000 S$'000
Current assets Current liabilities
Cash and cash equivalents 46,575 46,583 Trade and other payables 13,466 13,786
Trade and other receivables 14,107 11,717 Provision for reinstatement costs 2,051 2,047
Short-term investments 432 436 Income tax payable 2,470 2,318
Inventories 1,714 1,542 Total current liabilities 17,987 18,151
Total current assets 62,828 60,278
Non-current liabilities
Non-current assets Deferred tax liability 370 301
Investment in associates 1,446 2,068 Total non-current liabilities 370 301
Available-for-sale investment 75 75
Investments at fair value through profit or loss 3,201 3,708 Capital and reserves
Goodwill 782 782 Share capital 48,806 48,806
Property, plant and equipment 21,764 20,811 Treasury shares (447) -
Club memberships 238 238 Currency translation reserve (521) (352)
Total non-current assets 27,506 27,682 Merger reserve (2,828) (2,828)
Retained earnings 23,728 19,754
Total assets 90,334 87,960 Equity attributable to owners of the
68,738 65,380
Company
Non-controlling interests 3,239 4,128
Total equity 71,977 69,508
Total liabilities and equity 90,334 87,960
32FINANCIAL HIGHLIGHTS
FY2019 FY2018 FY2019 FY2018
CASHFLOW STATEMENT
$'000 $'000 $'000 $'000
Operating activities Investing activities
Profit before income tax 13,951 13,493 Acquisition of property plant and equipment (6,128) (6,220)
Adjustments for: Acquisition of investment in associates (577) (1,353)
Depreciation expense 5,438 4,833 Acquisition of investments at fair value through profit or
- (4,000)
Interest income (342) (42) loss
Dividend income from short-term investments - (7) Acquisition of treasury shares (487) -
Loss on property plant and equipment written off 288 85 Proceeds from disposal of property plant and equipment 13 123
Gain on disposal of property plant and equipment (23) - Proceeds from reduction of investments in associate - 220
Fair value loss on investments at fair value through profit Reinstatement cost paid (102) (98)
507 292
or loss Dividend income from short-term investments - 7
Write back of impairment loss on investment in Dividend income from associates 375 -
- (500)
associates Net cash used in investing activities (6,906) (11,321)
Write back of reinstatements costs (219) - Financing activities
Fair value loss (gain) on shortterm investments 4 (10) Capital contribution from noncontrolling interest in a
Share-based payment expense 40 256 - 1,312
subsidiary
Unrealised foreign exchange gain (459) (214) Dividends paid (7,694) (10,907)
Share of results of associates 824 115 Net cash used in financing activities (7,694) (9,595)
Operating cash flows before movements in working capital 20,009 18,301
Trade and other receivables (2,390) (2,681) Net decrease in cash and cash equivalents (6) (4,709)
Inventories (172) (63) Cash and cash equivalents at beginning of the year 46,583 51,262
Trade and other payables (320) 3,701 Effect of foreign exchange rate changes (2) 30
Cash generated from operations 17,127 19,258 Cash and cash equivalents at end of the year 46,575 46,583
Interest income 342 42
Income tax paid (2,875) (3,093)
Net cash from operating activities 14,594 16,207
33FINANCIAL HIGHLIGHTS
Strong balance sheet coupled with healthy liquidity position
to support stable absolute payout
75%
Payout ratio 70% 70%
66%
0.7 0.7
Net dividend per 0.7 0.7
ordinary share, 0.5
Singapore cents 1.0
0.5 0.5 0.5
FY16 FY17 FY18 FY19
Interim Final Special Payout Ratio
Notes:
1. Payout ratio is computed based on profit attributable to owners of the Company (i.e. PATMI)
2. FY19 final dividend of 0.7 cents per share is subject to approval at the AGM on 17 January 2020 34JUMBO GROUP LIMITED
THANK YOU
This presentation has been prepared by Jumbo Group Limited (the “Company”) and has been reviewed by the Company’s sponsor, United Overseas Bank Limited (the “Sponsor”), for compliance with Rules
226(2)(b) and 753(2) of the Singapore Exchange Securities Trading Limited (the “SGX-ST”) Listing Manual Section B: Rules of Catalist.
This presentation has not been examined or approved by the SGX-ST. The SGX-ST assumes no responsibility for the contents of this presentation, including the correctness of any of the statements or opinions
made or reports contained in this presentation.
The contact person for the Sponsor is Mr. Chia Beng Kwan, Senior Director, Equity Capital Markets, who can be contacted at 80 Raffles Place, #03-03 UOB Plaza 1, Singapore 048624, telephone: +65 6533 9898.You can also read