Correlates of Gambling - Volume 40, Issue 1 - Repositório do ISCTE-IUL
←
→
Page content transcription
If your browser does not render page correctly, please read the page content below
Volume 40, Issue 1

                                               Correlates of Gambling

                                                       Ana Brochado
                              Instituto Universitário de Lisboa (ISCTE-IUL), DINÂMIA''''CET

                   Margarida Abreu                                                    Victor Mendes
      ISEG-Universidade de Lisboa, UECE and REM                           CMVM-Portuguese Securities Commission and
                                                                                       CEFAGE-UE

                                                            Abstract
This study's main objective was to identify which of gamblers' demographic, geographic and socioeconomic
characteristics correlate with more frequent lottery playing and stock market trading. The data were collected from
two unrelated cross-sectional samples of equity investors and lottery players from a European country. Based on a
multiple correspondence analysis of both samples, higher levels of spending on central state lotteries and stocks with
lottery features were found to be associated with individuals who have similar socioeconomic characteristics.

1. Ana Brochado - Corresponding author; email:ana.brochado@iscte-iul.pt; DINÂMIA'CET – IUL is supported by FCT Fundação para a
Ciência e a Tecnologia, Portugal (PEST-BASE/03127/2020). 2. Margarida Abreu - ISEG - Universidade de Lisboa, Department of
Economics; UECE; REM (Research in Economics and Mathematics. email: mabreu@iseg.ulisboa.pt. UECE (Research Unit on Complexity
and Economics) is financially supported by FCT (Fundação para a Ciência e a Tecnologia), Portugal. This article is part of the Strategic
Project (UID/ECO/00436/2019). 3. Victor Mendes - The opinions expressed in this document are those of the author, and not necessarily
those of the CMVM. CEFAGE-UE is supported by the Fundação para a Ciência e a Tecnologia - Portuguese Foundation for Science and
Technology (grant UID/ECO/04007/2019).
Citation: Ana Brochado and Margarida Abreu and Victor Mendes, (2020) ''Correlates of Gambling'', Economics Bulletin, Volume 40, Issue
1, pages 456-462
Contact: Ana Brochado - ana.brochado@iscte-iul.pt, Margarida Abreu - mabreu@iseg.ulisboa.pt, Victor Mendes - victormendes@cmvm.pt.
Submitted: February 06, 2020. Published: February 10, 2020.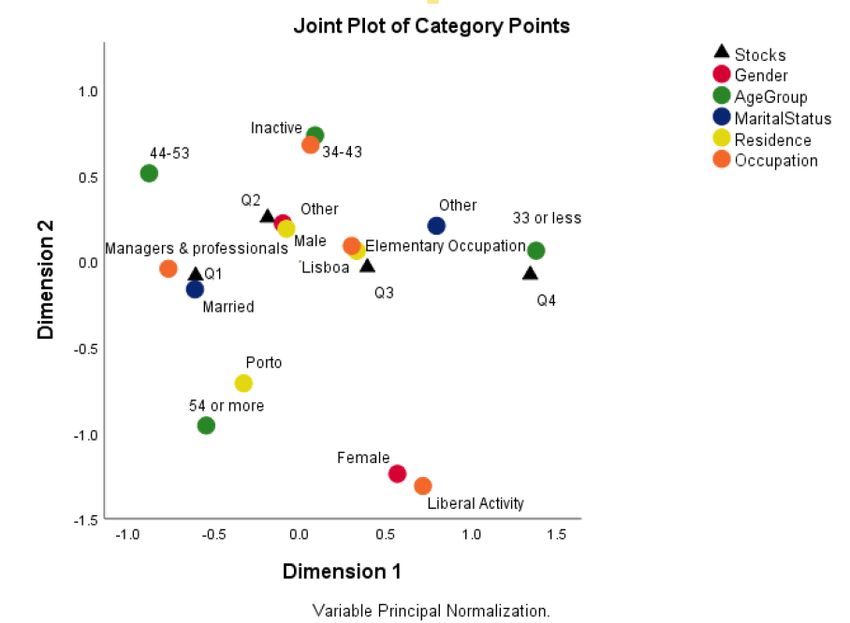
1. Introduction

        Gambling has been attracting individuals for centuries (Meng and Pantzalis 2018)
because ‘the desire to gamble is deep-rooted in the human psyche’ (Kumar, 2009, p.
1889). Previous studies (Grinblatt and Keloharju 2009, Dorn et al. 2015, Gao and Lin
2015, and Kumar et al. 2016) report evidence that, for some individual investors, trading
functions as a gambling activity. Sensation or thrill seeking can thus be seen as a
psychological attribute that underlies the propensity both to play lotteries and to trade in
stocks (Grinblatt and Keloharju 2009). Moreover, people’s risk behaviours in one setting
predicts risk-taking propensities in other settings (Barsky et al. 1997). Similar to playing
lotteries, stock trading can offer individuals fun and excitement (Dorn et al. 2015).
        Gao and Lin (2015) report the existence of a substitution effect between stock
trading and lottery participation in Taiwan. Barber et al. (2009) also suggest that investors
might view stock trading as an opportunity to gamble, and Dorn et al. (2015) report that
large jackpots significantly reduce the amount of stock trading activity. Kumar et al.
(2016) examine gambling-motivated trading activity (i.e., gambling-induced sentiment)
and conclude that lottery-like stocks are associated with return comovement. Kumar
(2009) further conjectures that state lotteries and stocks with lottery-type features attract
individuals with similar socioeconomic characteristics in the USA.
        Previous studies have identified the demographic characteristics associated with
greater propensity to gamble, higher portfolio concentration on lottery-type stocks (e.g.
Kumar 2009) and stronger participation and more frequent gambling in government
lotteries (Lam 2007, Ariyabuddhiphongs 2011 and Brochado et al. 2018). This paper adds
to the literature by studying a new behavioural outcome, namely, the level of gambling
(i.e. spending) among specific segments of both stock traders and lottery players. The
main objectives are to identify gamblers’ sociodemographic and geographic
characteristics correlated with (1) more high-risk stock trading activity and (2) more
spending on lottery playing. Using micro-level data, this study aims to answer the
following research question: Are the sociodemographic and geographic characteristics of
lottery gamblers and stock market gamblers similar?

                                      2. Methods

        Kumar et al. (2011) argue that individuals’ gambling propensity will be stronger
in countries with a higher percentage of Catholics as the Roman Catholic Church
maintains a tolerant attitude towards moderate levels of gambling. Our research focuses
on Portugal, where Catholics represent88% of the population.1 We use data from two
unrelated cross-sectional samples of equity gamblers (the equity sample) and lottery
gamblers (the lottery sample).
        The equity sample was collected from a database of retail investors’ accounts
provided by one of the top three banks in Portugal. The dataset for each account includes
transactions in financial instruments over a 10-year period including dates, ISIN codes,
quantities traded and prices, as well as sociodemographic data covering the first account
holder’s marital status, birth date, gender, occupation and residence.
        We adopt the definition of stocks that includes the perception of stocks as
gambling tools (i.e. stocks viewed as lotteries), which has previously been applied in the

1
    Source: INE (2011 census).
literature (Kumar 2009 and Gao and Lin 2015). Gambling in financial market contexts
can thus be seen as “the desire to seek lottery-type payoffs (i.e. extreme returns at a low
cost) using financial assets” (Kumar et al. 2016, p. 85). We use a sample of 469 investors
considered gamblers (i.e., individuals that meet at least one of the following
characteristics: i) do not use any source of information about financial markets and
instruments (Abreu and Mendes 2018); ii) has a poorly diversified portfolio, with less
than 5 different stocks; iii) these are low-liquidity stocks).
The Santa Casa da Misericórdia de Lisboa (SCML) runs the central government’s
games in Portugal in the name and on behalf of the state. The SCML stimulates the
demand for government games, promotes them and returns to society at large portion of
what individuals have spent on gambling.2 We focus on the EuroMilhões, a poll-betting,
transnational lottery in which players select 5 numbers from 1 to 50 and 2 different ‘lucky
star’ numbers from a pool of 11 numbers. The EuroMilhões’s revenues account for
approximately 30% of the SCML’s gross sales. Our lottery sample is obtained by using
non-probability convenience sampling that targeted at least occasional players of one of
the games on offer.
The data were collected by means of a self-administered survey given to gamblers
in three retail points of sale. Respondents provide information about which games they
gamble, how often and how much they spend on gambling; they also provide
sociodemographic information. In total, 462 completed questionnaires are considered.
The two samples are composed of an almost equal number of respondents, and
both included active ‘gamblers’ among players in lotteries or stock market traders. The
amount spent on the EuroMilhões and the stock trading’s value are converted into ordinal
scales based on the respective quartiles.
Table 1. Sample characteristics
Notes: n = number; * source: Instituto Nacional de Estatística’s (n.d.) last data available: age groups
reported for Portugal are 15–35, 35–44, 45–53 and 55+ years old.
Lottery sample Equity sample
Portugal*
Variable Category (n = 462) (n = 469)
Count % Count % %
Male 316 68.4 399 85.1 47.3
Gender
Female 146 31.6 70 14.9 52.7
≤ 33 122 26.4 102 21.7 25.1
34–43 126 27.3 133 28.4 16.9
Age Group
44–53 130 28.1 150 32.0 17.2
≥ 54 84 18.2 84 17.9 40.8
Married 258 55.8 266 56.7 46.6
Marital Status
Other 204 44.2 203 43.3 53.4
Lisbon 268 58.0 142 30.3 12.8
Residence Oporto 130 28.1 80 17.1 20.4
Other 64 13.9 247 52.6 66.7
Managers & Other
122 26.4 129 27.5 20.8
Professionals
Elementary
Occupation 248 53.7 88 18.8 36.5
Occupations
Self-employed 26 5.6 180 17.1 –
Unemployed 66 14.3 72 36.6 42.6
2
The redistribution is done either through prizes to be won or of the net profit to a vast range of institutional
beneficiaries operating in the areas of health, sport, culture, social welfare and cohesion.The two datasets include the following variables: gender, age group, marital status,
residence and occupation (Table 1). The samples have similar age group averages but the
percentage of individuals with an elementary occupation is higher in the lottery sample
than in the equity sample. Compared with the Portuguese population, there is a higher
percentage of gamblers in lotteries and in stocks who are male, older, married and have
more qualified occupations. Also, there is a lower percentage of unemployed gamblers
than in the Portuguese population.
3. Results
3.1 Ordinal regression
We use ordinal regression to assess sociodemographics’ influence on the amounts
‘invested’ in lotteries and stocks. The dependent variable is measured at the ordinal level
(i.e. four quartiles), and the regressors are converted into binary variables.
Estimation results (Table 2) show that males are more likely to spend more on lotteries
and stocks than females. Younger gamblers (less than 34 years old) are less likely to spend
more on lotteries and stocks than the older individuals. Residence, however, is not
correlated with the lottery- and stock-spending quartiles, and married individuals and
managers and other professionals are more likely to spend more on lotteries and stocks.
For lotteries, people with an elementary occupation are more likely to spend more than
the unemployed, while self-employed individuals are likely to spend less on stocks than
unemployed people are.3
Table 2. Ordinal regression
Base categories: 1 gender = female; 2 age group = 54+; 3 marital status = not married; 4 residence = other; 5
occupation = unemployed; 6 EuroMilhões (monthly spending) = quartile 4; 7 equity (annual transaction
value) = quartile 4; link function: complementary log-log; ** and *** denote statistical significance at 5%
and 1%, respectively.
EuroMilhões6 Equity7
Variable Category Std. Std.
Estimate Estimate
Error Error
Gender1 Male 0.514 0.186 *** 0.712 0.257 ***
≤ 33 -0.852 0.275 *** -2.266 0.299 ***
Age Group2 34–43 -0.112 0.260 -0.849 0.253 ***
44–53 -0.185 0.258 -0.264 0.289
Marital Status3 Married 0.319 0.180 ** 0.367 0.210 **
Lisbon -0.393 0.259 -0.263 0.205
Residence4
Oporto -0.059 0.289 0.197 0.259
Managers & Other Professionals 1.050 0.288 *** 0.599 0.240 **
Occupation5 Elementary Occupations 0.448 0.263 ** -0.397 0.259
Self-employed 0.469 0.431 -0.488 0.267 **
Cox and Snell 0.202 0.257
Pseudo R2 Nagelkerke 0.209 0.279
McFadden 0.139 0.117
3 A pooled logistic regression was also estimated by combining both samples to check for robustness. Non tabulated
results confirm the previous findings.3.2 Multiple correspondence analysis
Multiple correspondence analysis provides a visual representation of each
sample’s categories and facilitates a fuller understanding and description of the nature of
the relationships between the selected categorical and/or qualitative variables and their
associated categories. Upon computation of the eigenvalues (a measure of the
corresponding dimension’s importance in terms of explaining variability in the input
data), two dimensions for interpretation are retained for they account for 51.9% (58.4%)
of the total variance in the lottery (equity) sample.
The most important variables for each dimension are then identified. A joint plot
of category points is created to represent graphically the categories of the five variables
under analysis. The spatial distribution of category points reflects associations (for
spatially-close point categories) or oppositions (for spatially-distant and diagonally-
located point categories).
The discriminating measures allow us to conclude that lottery spending, gender
and age better explain the first dimension (variance explained = 26.8%). However, marital
status, occupation and residence are more relevant in the second dimension (i.e. 25.1%).
In the equity sample, stock trading, age group and marital status better explain the first
dimension (variance explained = 34.6%), while gender, age group, residence and
occupation are more important in the second dimension (i.e. 23.7%) - Table 3.
Table 3. Discriminating measures
Lottery Sample Equity Sample
Dimension Dimension
Mean Mean
1 2 1 2
Lottery Spending 0.45 0.36 0.41 Stock Trading 0.56 0.02 0.29
Gender 0.32 0.08 0.20 Gender 0.06 0.28 0.17
Age Group 0.42 0.22 0.32 Age Group 0.64 0.49 0.57
Marital Status 0.20 0.24 0.22 Marital Status 0.49 0.03 0.26
Residence 0.16 0.43 0.29 Residence 0.05 0.11 0.08
Occupation 0.05 0.18 0.12 Occupation 0.28 0.50 0.39
Active Total 1.61 1.51 1.56 Active Total 2.08 1.42 1.75
Inertia 0.27 0.25 0.52 Inertia 0.35 0.24 0.58
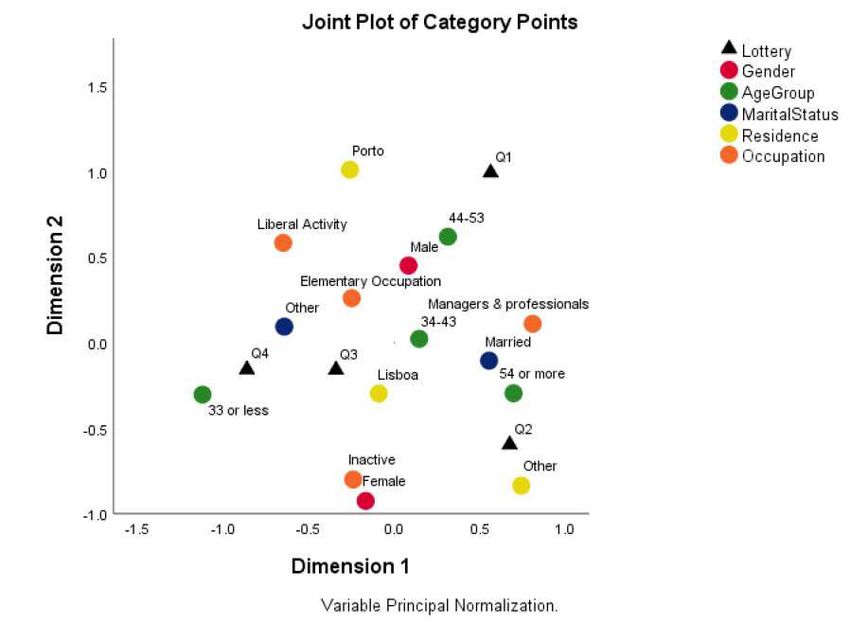
Thus, lottery spending’s quartiles 1 and 2 (higher spending) are mainly associated
with male, older and married individuals, who reside outside the two largest Portuguese
cities and who are managers or highly skilled professionals. Quartiles 3 and 4 are mainly
connected with younger and unmarried people. Among lottery gamblers, an association
exists between being female and inactive (Figure 1).Figure 1. Multiple correspondence analysis (EuroMilhões)
For the equity sample, stock trading’s quartiles 1 and 2 (higher trading value) are
mainly associated with male, older and married individuals, who reside outside Lisbon
and Oporto and who are managers or highly skilled professionals. Quartiles 3 and 4 (lower
trading) are linked mainly with younger, unmarried people. Among equity gamblers, an
association exists between being female and self-employed (Figure 2).
Figure 2. Multiple correspondence analysis (stock trading)4. Discussion
Our result that male equity traders are more prone to gamble in the stock market
is consistent with previous research in different environments (e.g., Dorn et al. 2015,
Kumar et al. 2016 and Meng and Pantzalis 2018). We also show that male gamblers
exhibit a higher level of trading activity than female traders, and this result is novel. In
fact, previous research has concluded that men participate more in the stock market, but
the trading intensity of equity gamblers has not been previously studied.
Overall, the propensity to gamble in the stock market appears to be lower in the
54 or more years old age bracket, which makes up a smaller proportion of the sample of
active gamblers compared with national statistics. However, older individuals are more
likely to spend more on stocks than are traders with less than 34 years of age. Married
individuals are more likely to gamble and to spend more; managers and other
professionals are also more likely to gamble and to spend more in the stock market than
unemployed people. This set of original results reveals that the profile of gamblers who
engage in more intensive equity trading activity is different from the profile of investors
who merely show a preference for lottery-type stocks.
Regarding the lottery sample, our results also support the conclusion that a higher
level of lottery spending is linked with gender (i.e. males), a finding which is in
accordance with previous research (Ariyabuddhiphongs 2011 and Brochado et al. 2018).
In addition, older individuals spend more on lotteries. Lam (2007) also confirmed a
positive association between age and frequency of gambling, and Ariyabuddhiphongs
(2011) identified a nonlinear association between individual lottery involvement (e.g.
spending) and age groups. Consistent with Brochado et al. (2018), individuals with an
elementary occupation tend to participate more frequently in lotteries (they account for
more than 53% of out lottery sample); however, we add to the literature by showing that
higher spending is associated with more qualified occupations.
Putting our results together, we identify that gamblers’ spending on both stocks
and government lotteries is similarly correlated with gender, age, occupation and marital
status. Human aspirations may justify gambling behaviours in different markets, and, to
some extent, gambling-motivated investments could be justified by a desire to maintain
or increase upward social mobility, even for those who are wealthier. Individuals’
characteristics can thus supersede their tendency to gamble in terms of causality (Kumar
2009).
5. Concluding remarks
We add to the literature on gambling by identifying the main correlates of
gamblers’ spending and providing more evidence for patterns in this behavioural
propensity. Our results identify a homogeneous sociodemographic and geographic profile
for stock market and lottery gamblers. Empirical data analyses reveal that gender, age,
marital status and occupation have similar impact on expenditures in lotteries and stocks,
thus providing evidence that gamblers are gamblers regardless of the ‘instrument’ used
to extract fun and excitement.
Our contributions to the literature are significant on two levels. First, our results
confirm Kumar’s (2009) similar clienteles hypothesis and raises it to a new behaviouraloutcome: gambling expenditures. Second, we use micro-level data comprising two
datasets of active gamblers: lottery players and stock traders.
Despite these contributions, an important limitation is the use of unrelated
samples: if the gamblers identified based on stock trading data could be matched to their
state lottery purchase records, more cogent conclusions about gamblers’ demographic
profile could be derived. Future studies may also want to include different types of
investments (e.g. warrants) and lotteries (e.g. instant lotteries).
References
Abreu, M. and V. Mendes (2018) “The investor in structured retail products: advice
driven or gambling oriented?” Journal of Behavioral and Experimental Finance 17, 1–9.
Ariyabuddhiphongs, V. (2011) “Lottery gambling: a review” Journal of Gambling
Studies 27, 15–33.
Barber, B., Lee, Y.-T., Liu, Y.-J. and T. Odean (2009) “Just how much do individual
investors lose by trading?” Review of Financial Studies 22, 609–632.
Barsky, R.B., Juster, F.T., Kimball, M.S. and M.D. Shapiro (1997) “Preference
parameters and behavioral heterogeneity: an experimental approach in the health and
retirement study” Quarterly Journal of Economics 112, 537–579.
Brochado, A., Santos, M., Oliveira, F. and J. Esperança (2018) “Gambling behavior:
instant versus traditional lotteries” Journal of Business Research 88, 560–567.
Dorn, A.J., Dorn, D. and P. Sengmueller (2015) “Trading as gambling” Management
Science 61, 2376–2393.
Frino, A., Lepone, G. and D. Wright (2019) “Are paper winners gamblers? Evidence from
Australian retail investors” Accounting & Finance 59, 593–614.
Gao, X. and T.-C. Lin (2015) “Do individual investors trade stocks as gambling?
Evidence from repeated natural experiments” The Review of Financial Studies 28, 2128–
2166.
Grinblatt, M. and M. Keloharju (2009) “Sensation seeking, overconfidence, and trading
activity” Journal of Finance 64, 549–576.
Kumar, A. (2009) Who gambles in the stock market? Journal of Finance 64, 1889–1933.
Kumar, A., Page, J.K. and O.G. Spalt (2011) Religious beliefs, gambling attitudes, and
financial market outcomes Journal of Financial Economics 102, 671–708.
Kumar, A., Page, J.K., O.G. Spalt (2016) “Gambling and comovement” Journal of
Financial Quantitative Analysis 51, 85–111.
Lam, D. (2007) “An exploratory study of gambling motivations and their impact on the
purchase frequencies of various gambling products” Psychology Marketing 24, 815–827.
Meng, Y. and C. Pantzalis (2018) “Monthly cyclicality in retail investors’ liquidity and
lottery-type stocks at the turn of the month” The Journal of Banking and Finance 88,
176–191.
Mitton, T. and K. Vorkink (2007) “Equilibrium underdiversification and the preference
for skewness” The Review of Financial Studies 20, 1255–1288.You can also read