Correlation Between Saturated Fatty Acid Chain-Length and Intermolecular Forces Determined with Terahertz Spectroscopy - Amazon S3
←
→
Page content transcription
If your browser does not render page correctly, please read the page content below
doi.org/10.26434/chemrxiv.7553054.v1

Correlation Between Saturated Fatty Acid Chain-Length and
Intermolecular Forces Determined with Terahertz Spectroscopy
Shuting Fan, Michael Ruggiero, Zhengfang Qian, Vincent P. Wallace

Submitted date: 07/01/2019 • Posted date: 08/01/2019
Licence: CC BY-NC-ND 4.0
Citation information: Fan, Shuting; Ruggiero, Michael; Qian, Zhengfang; P. Wallace, Vincent (2019):
Correlation Between Saturated Fatty Acid Chain-Length and Intermolecular Forces Determined with
Terahertz Spectroscopy. ChemRxiv. Preprint.

We measured crystalline (C-form) saturated fatty acids with even carbon numbers ranging from 12 to 20 using
temperature dependent terahertz time-domain spectroscopy (THz-TDS). Absorption features between 0.5 to
2.75 THz were identified at temperatures from 96 K to 293 K, and a systematic red-shift was obvserved with
the increasing carbon chain length. The origins of these absorption bands were uncovered using
state-of-the-art ab initio density functional theory (DFT) calculations. Similar vibrational motions in the
absorption bands of the different materials highlight the unique role that THz-TDS has for probing weak
non-covalent interactions in these materials. Our results showcase the utility of the terahertz region, which is
beyond the scope of related vibrational techniques, providing direct evidence of the effect of chain length on
the intermolecular interactions of these molecules.

File list (1)

preprint.pdf (633.53 KiB)                                                      view on ChemRxiv       download file
Correlation between saturated fatty acid chain-length and intermolecular
forces determined with terahertz spectroscopy
a b a c
Shuting Fan, Michael T. Ruggiero, Zhengfang Qian* and Vincent P. Wallace †
a. College of Electronic Science and Technology, Shenzhen University, 3688 Nanhai Rd, Shenzhen, Guangdong Province, China, 51806 0.
b. Department of Chemistry, University of Vermont, 82 University Place, Burlington, Vermont, 05405, United States of America.
c. Department of Physics, The University of Western Australia, 35 Stirling Highway, Perth, WA, 6009, Australia.
* zq001@szu.edu.cn
† vincent.wallace@uwa.edu.au
We measured crystalline (C-form) saturated fatty acids with low-density lipoprotein (LDL) cholesterol level as well as
even carbon numbers ranging from 12 to 20 using atherosclerosis risks, whereas stearic acid has the exact
temperature dependent terahertz time-domain spectroscopy opposite effect 4. Clearly, the structures and associated
(THz-TDS). Absorption features between 0.5 to 2.75 THz were intermolecular interactions in various FFAs plays a significant
identified at temperatures from 96 K to 293 K, and a role on physiological behaviour, and additionally these
systematic red-shift was obvserved with the increasing phenomena are of great importance in other fields, such as
carbon chain length. The origins of these absorption bands the pharmaceutical, cosmetics, and food industries 5. Thus,
were uncovered using state-of-the-art ab initio density an in-depth investigation into the three-dimensional
functional theory (DFT) calculations. Similar vibrational packing and associated intermolecular forces in biologically-
motions in the absorption bands of the different materials relevant FFAs is critical to understand and predict the
highlight the unique role that THz-TDS has for probing weak behaviour of this important class of materials.
non-covalent interactions in these materials. Our results Crystalline FFAs offer an efficient means of probing the
showcase the utility of the terahertz region, which is beyond forces present with atomic-level precision. While clearly the
the scope of related vibrational techniques, providing direct crystalline form is often not directly used in vivo, the
evidence of the effect of chain length on the intermolecular arrangement of fatty acids in materials like cell membranes
interactions of these molecules. represents a pseudo-ordered material, with a bulk
arrangement that closely resembles what is found in the
Fatty acids are an important class of biomolecules consisting crystal 6, 7. The molecular assembly of fatty acids has
of a non-polar aliphatic hydrocarbon chain terminated by a previously been studied using several methods. Both Fourier
carboxylic acid head group. Naturally occurring fatty acids transform infrared spectroscopy (FTIR) and Raman
often contain an even number of carbon atoms, are spectroscopy have been used to investigate the vibrational
unbranched, and play a critical role in countless biological dynamics of these materials 8, 9, 10, 11. However, these mid-IR
processes. While many recognize fatty acids as a fuel source, methods probe the high frequency vibrational modes (above
they also contribute significantly to the proper functioning -1
200 cm ), which are primarily associated with intramolecular
of cellular processes. For instance, free fatty acids (FFA), interactions such as the deformation of covalent bonds.
together with cholesterol, ceramides, and dead corneocytes, While these methods are powerful for understanding the
form a rigid ‘brick and mortar’ structured stratum corneum nature of the intramolecular forces, they only provide
(SC) layer in mammalian epidermises whose barrier function indirect information into the intermolecular forces, and
is essential to mammal survival 1, 2. It is well known that the therefore the molecular packing and related phenomena.
carbon chain length of the fatty acid molecules is closely Recently, THz-TDS has been proven to be a powerful tool
associated with their functionalities, and often abnormalities for probing the intermolecular forces in molecular solids.
in their structure are a sign of serious pathological disease. Terahertz, or far-IR, radiation (~0.3-10 THz or ~10-333 cm
-
A study in 2014 found that the FFAs present in the SC layer 1
) can excite low-frequency large-amplitude collective
of patients suffering from atopic eczema (AE) have a shorter vibrational motions in condensed phase materials, which
chain length on average compared to those from the healthy subsequently probe a large portion of both the
control group or from the non-lesioned skin of the AE intermolecular and intramolecular potential energy
patients 3. The reduction in carbon chain length of the hypersurface. While conceptually similar to the more
epidermal surface lipids results in a less ordered hexagonal common FTIR spectroscopy, the nature of terahertz motions
lateral packing of the lipids and disrupts the barrier function are shaped by long-range interactions, which results in each
of the SC layer in AE patients. In contrast, the longer carbon material having a unique spectral fingerprint at terahertz
chains can form a denser and highly ordered orthorhombic frequencies. This has led to THz-TDS being used to
organization that maintains the functionality of the SC layer investigate many condensed phase materials, including
in healthy people. The differences in the chain length of the polymorphism of crystal structures 12, 13, 14, protein and water
FFAs could also cause opposite metabolic consequences dynamics 15, 16, and phase transformation phenomena 17, 18.
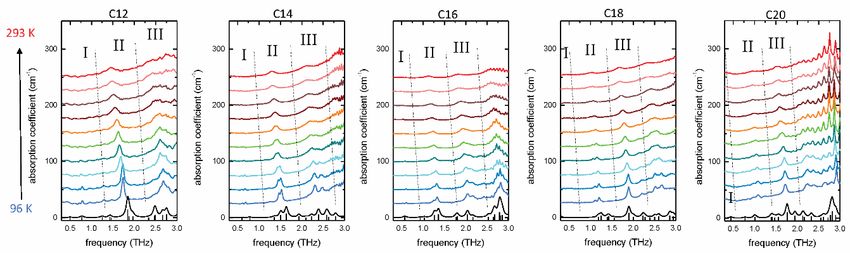
when ingested. Palmitic acid (C16:0) uptake can increase The intermolecular vibrational modes of many biologicallyFig. 1 The temperature dependent terahertz spectra of the fatty acids measured. The curves in colour are the absorption coefficients calculated from the experiment. The
black curves are the simulated vibrational spectra from our DFT calculations.
important materials, such as amino acids 19, 20, short chain temperatures for lauric acid and arachidic acid, while it at the
peptides 21, nucleobases and the corresponding nucleosides same time splits into two closely located peaks in that of
22, have been successfully probed with THz-TDS. myristic acid, palmitic acid and stearic acid.
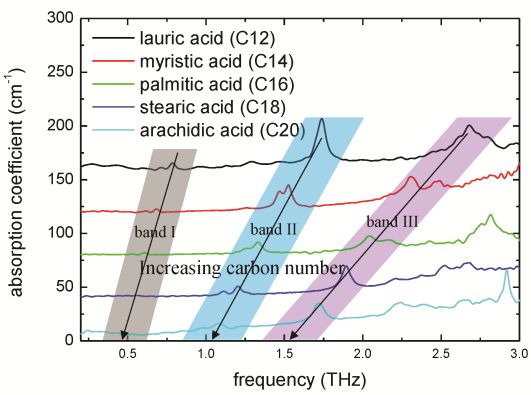
The dependence of terahertz phonons on the entire Interestingly, apart from the temperature dependent shift, a
potential energy hypersurface has a serious consequence, in chain length dependent pattern is also identified from our
that even in materials where the molecular conformations experiment. At 96 K, the absorption bands evolve to lower
are identical but where the bulk arrangements differ (i.e. frequencies with the lengthening of the carbon chain as
polymorphism), the two spectra cannot be directly shown in Fig. 2. Moreover, when the multiple features in
compared. Unlike the mid-IR, where specific motions are each band evolve into one single broad peak at 293 K, the
known to occur at predictable frequencies and a large set of dependence of the peak locations to the carbon atom
materials can be screened by observing spectral ‘shifting’, number becomes linear as plotted in Fig. 3. While, in general,
the terahertz motions in different materials are far too materials with different compositions cannot reasonably
complex, and often very different, to make direct have their terahertz spectra readily compared (i.e.
comparisons possible. However, in the case of the naturally comparing spectral shifting) due to the dependence of
occurring crystalline FFAs, the packing motifs, symmetry, and terahertz transitions on the entire potential energy surface,
overall forces are all consistent, making them one of the few this class of materials are all isostructural, implying that in
cases where spectral changes across the series can be this particular case spectral shifting can be interpreted
identified, quantified, and explored in detail using THz-TDS. meaningfully. However, unlike more traditional mid-IR
Five saturated FFAs with even carbon numbers were methods, the lack of functional group specific transitions at
acquired from Sigma-Aldrich, namely lauric acid (C12), terahertz frequencies necessitates the use of advanced
myristic acid (C14), palmitic acid (C16), stearic acid (C18), and computational methods in order to interpret and assign low-
arachidic acid (C20). These samples were used without frequency spectral data.
further purification. We prepared the samples by depositing
molten FFA onto a z-cut quartz window, followed by placing
a second quartz window on top prior to solidification and
recrystallization. The samples were measured in a
commercial THz-TDS system (Terapulse4000, TeraView, Ltd.,
Cambridge, UK). The details on the terahertz measurements
are available in the ESI. All samples were confirmed to be in
the C form by powder X-ray diffraction experiments.
The temperature dependent terahertz spectra of the
measured fatty acids are shown in Fig. 1. Due to spectral
bandwidth limitations, our analysis is restricted to
frequencies below 2.75 THz, where it was observed that the
absorption features were concentrated in three frequency
bands labelled I, II, III in Fig. 1. As the temperature was
increased from 96 K to 293 K, the features undergo a red-
shift, which is attributed to the thermal expansion of the Fig. 2 The evolving of the absorption bands with increasing carbon atom number at
crystalline lattice 23. Band I exhibits very weak absorption 96 K.
peaks at low frequencies that are buried in the thermal noise
as the temperature increases. The broad feature in band II at
.
293 K becomes much more prominent at lowerTable 1 Experimental and simulated vibrational transitions for the peaks in bands I, II, and III, as well as the vibrational force constants and reduced masses .
Band I Band II Band III
Peak position
Carbon Peak position (THz) Peak position (THz)
(THz) Force Reduced Force Reduced Force Reduced
number
constant Mass constant Mass constant Mass
Exp. (N/m) (AMU) Exp. (N/m) (AMU) Exp. (N/m) (AMU)
Sim. Sim. Sim.
(96K) (96K) (96K)
12 0.79 0.7752 0.2127 5.4069 1.74 1.8474 0.9755 4.3660 2.68 2.4702 1.6781 4.2007
14 0.68 0.7840 0.2141 5.3208 1.53 1.6381 0.7935 4.5166 2.31 2.3906 1.6395 4.3819
16 0.61 0.5763 0.0944 4.3408 1.26 1.2684 0.5102 4.8439 2.04 2.0391 1.1205 4.1164
18 - 0.2820 0.0231 4.4379 1.11 1.1850 0.4309 4.6874 1.90 1.8986 1.0496 4.4478
20 - 0.1383 0.0055 4.3984 1.08 1.0097 0.3144 4.7105 1.72 1.7621 0.9025 4.4396
head (videos of the representative motions are available in
the ESI). The prominent feature in band I corresponds to a
rigid rotation of the carbon chain, with two chains joined via
hydrogen bonds moving symmetrically. The main features in
bands II and III correspond to a torsion of the carbon chain
about the centre of the chain, with II corresponding to in-
phase motion between adjacent molecules while III
corresponds to out-of-phase motion.
The assignment of the experimental spectra using the DFT
simulations enables a more in-depth description of the
intermolecular forces present in these materials to be
obtained. Based on the solution of the vibrational
Schrodinger equation, the frequencies of vibrational
transitions are dependent on both the reduced mass and the
Fig. 3 The linear dependence of the peak location on the carbon number at 293 K.
force constant for a given mode. Decomposition of these
Band I is buried in the thermal noise
parameters for specific vibrational modes in the studied fatty
Fully-periodic density functional theory (DFT) simulations acid crystals (Table 1) highlights that while the reduced
were performed using the CRYSTAL17 software package 24. masses generally decrease with increasing chain length
The 6-311g (2d, 2p) basis set 25 and Perdew-Burke- (which would result in a larger vibrational transition energy),
Ernzerhof (PBE) 26 density functional were used in the force constants drastically decrease with increasing chain
conjunction with the D3-BJ dispersion correction by Grimme length. Thus, the origins of the observed spectral shifting lie
et al 27, 28. The geometries of each crystal were fully optimized in significantly decreased intermolecular interactions, which
with no constraints other than translational and space group are particularly localized on the carbon chain. This is not
symmetry (lattice vectors and atomic positions free to relax), surprising, as shorter chain fatty acids are dominated by
and upon complete optimization the vibrational normal hydrogen bonding interactions which are much stronger
modes and frequencies were determined using a finite- than intermolecular van der Waals forces that dominate the
difference method, with IR-intensities calculated using the interactions for longer chain fatty acids. This finding proves
Berry Phase method 29, 30, 31. The results of the vibrational the great potential for terahertz spectroscopy in
simulations are also shown at the bottom of Fig. 1, and are understanding the origins of intermolecular interactions in
in excellent agreement with the experimentally observed condensed molecular systems, particularly for the
spectra. characterization of the FFAs or in other practical settings.
Analysis of the individual vibrational modes in the studied In summary, we measured the fatty acids with even-number
materials highlights that there indeed do exist identical of carbon atoms from 12 carbons to 20 carbons using a THz-
mode-types that persist throughout increasing chain length. TDS system. The absorption coefficients were calculated.
Additionally, there is an increasing vibrational density of Several absorption bands were observed at room
states with increasing chain length, which is expected given temperature between 0.5 to 2.75 THz. With the increase of
the number of vibrations in solids scales linearly with the the carbon chain length, these absorption bands shift
number of atoms within a given unit cell. All of the vibrations towards lower frequencies indicating their association with
in the highlighted regions correspond to large-amplitude the vibrational modes of the lattice. In the low temperature
motions of the carbon tails about the central carboxylate measurements, three absorption bands can be identifiedthat evolve to lower frequencies systematically with 15 B. Born, S. J. Kim, S. Ebbinghaus, M. Gruebele, M.
increasing carbon chain length. At 293 K, the peak locations Havenith, Faraday Discuss., 2008, 141, 161-173.
16 U. Heugen, G. Schwaab, E. Bründermann, M. Heyden, X.
show a linear dependence on the carbon chain length, which Yu, D. M. Leitner, M. Havenith, Proc.Natl.Acad.Sci.U.S.A.,
makes terahertz a potential tool for FFA characterization in 2006, 103, 12301-12306.
practical settings. At 96 K, the spectra were further compared 17 M. T. Ruggiero, W. Zhang, A. D. Bond, D. M. Mittleman, J.
with those calculated by ab initio calculations. The A. Zeitler, Phys.Rev.Lett., 2018, 120, 196002.
calculation enabled the assignment of the experimental 18 M. T. Ruggiero, J. Kölbel, L. Qi, J. A. Zeitler, Faraday
Discuss., 2018, 10.1039.C8FD00042E.
spectra, and revealed that the experimentally observed 19 J. Neu, H. Nikonow, C. A. Schmuttenmaer, The Journal of
bands exhibit identical mode-types, which is uncommon in Physical Chemistry A, 2018, 122, acs.jpca.8b04978.
the terahertz spectral range. The similarities in mode types 20 J. T. Jr, T. M. Korter, Journal of Physical Chemistry A, 2013,
allows these materials to be one of the few where spectral 117, 10504-10512.
shifting of terahertz phonons across different materials is 21 C. S. P. Jr, O. Kambara, S. Kawaguchi, K. Yamamoto, K.
Tominaga, Journal of Infrared Millimeter & Terahertz
acceptable, and provides a basis for directly extracting the Waves, 2010, 31, 799-809.
intermolecular interaction strengths for the series of studied 22 B. M. Fischer, M. Walther ., P. Jepsen U., Physics in
FFAs. The findings in this paper provides a means for the Medicine & Biology, 2002, 47, 3807-3814.
complete description of intermolecular interactions in fatty 23 M. D. King, W. D. Buchanan, T. M. Korter, J.Pharm.Sci.,
acids. 2011, 100, 1116-1129.
24 R. Dovesi, A. Erba, R. Orlando, C. M. Zicovich‐Wilson, B.
SF thanks the funding support from the National Natural Civalleri, L. Maschio, M. Rérat, S. Casassa, J. Baima, S.
Science Foundation of China (61805150) and the Shenzhen Salustro, Wiley Interdisciplinary Reviews Computational
University Start-up Fund (00000148). MTR thanks the Molecular Science, 2018, 8, e1360.
University of Vermont for its continued support. VPW and SF 25 R. Krishnan, J. S. Binkley, R. Seeger, J. A. Pople,
thank the the Australian Research Council for financial J.Chem.Phys., 1980, 72, 650-654.
26 J. P. Perdew, K. Burke, M. Ernzerhof, Phys.Rev.Lett., 1996,
support (Discovery Project, DP 150100635 and Linkage 77, 3865-3868.
Project LP 160100325). VPW is the recipient of the Cancer 27 G. Stefan, A. Jens, E. Stephan, K. Helge, J.Chem.Phys.,
Council of Western Australia Youngberg’s Fellowship. 2010, 132, 154104.
28 S. Grimme, S. Ehrlich, L. Goerigk, Journal of
Computational Chemistry, 2011, 32, 1456-1465.
References 29 Y. Noel, C. Zicovich-Wilson, B. Civalleri, P. D’Arco, R.
Dovesi, Physical Review B, 2001, 65, 014111.
1 A. Pappas, Dermato-endocrinology, 2009, 1, 72-76. 30 F. Pascale ., C. Zicovich-Wilson, F. Gejo Ló, B. Civalleri ., R.
2 D. Khnykin, J. H. Miner, F. Jahnsen, Dermato- Orlando ., R. Dovesi ., Journal of Computational
endocrinology, 2011, 3, 53-61. Chemistry, 2004, 25, 888–897.
3 S. J. Van, M. Janssens, E. C. Kaye, P. J. Caspers, A. P. 31 C. Zicovich-Wilson, F. Pascale ., C. Roetti ., V. R. Saunders,
Lavrijsen, R. J. Vreeken, J. A. Bouwstra, Exp.Dermatol., R. Orlando ., R. Dovesi ., Journal of Computational
2014, 23, 45-52. Chemistry, 2004, 25, 1873-1881.
4 D. Senyilmaztiebe, D. H. Pfaff, S. Virtue, K. V. Schwarz, T.
Fleming, S. Altamura, M. U. Muckenthaler, J. Okun, A.
Vidalpuig, P. Nawroth, Nature Communications, 2018, 9,
3129.
5 J. Qin, Y. Ying, L. Xie, Applied Spectroscopy Reviews, 2013,
48, 439-457.
6 P. Somerharju, J. A. Virtanen, K. H. Cheng, Biochimica et
Biophysica Acta (BBA) - Molecular and Cell Biology of
Lipids, 1999, 1440, 32-48.
7 S. Sonnino, A. Prinetti, H. Nakayama, M. Yangida, H.
Ogawa, K. Iwabuchi, Glycoconj.J., 2009, 26, 615-621.
8 R. G. Sinclair, A. F. Mckay, R. N. Jones, J.Am.Chem.Soc.,
1952, 74, 2570-2575.
9 R. N. Jones, A. F. Mckay, R. G. Sinclair, J.Am.Chem.Soc.,
2002, 74, 2575-2578.
10 J. R. Beattie, S. E. J. Bell, C. Borgaard, A. Fearon, B. W.
Moss, Lipids, 2006, 41, 287.
11 C. H. Warren, D. L. Hooper, Canadian Journal of
Chemistry, 2011, 51, 3901-3904.
12 P. F. Taday, I. V. Bradley, D. D. Arnone, M. Pepper,
J.Pharm.Sci., 2003, 92, 831-838.
13 J. A. Zeitler, D. A. Newnham, P. F. Taday, T. L. Threlfall, R.
W. Lancaster, R. W. Berg, C. J. Strachan, M. Pepper, K. C.
Gordon, T. Rades, J.Pharm.Sci., 2010, 95, 2486-2498.
14 Strachan, J. Clare, Rades, Thomas, Newnham, A. David,
Gordon, C. Keith, Michael, Chemical Physics Letters, 2004,
390, 20-24.preprint.pdf (633.53 KiB) view on ChemRxiv download file
You can also read