COSMOS GALAXIES PLANETS - Prof. Joel Primack Research Projects Physics 205 - 23Feb2021
←
→
Page content transcription
If your browser does not render page correctly, please read the page content below
Prof. Joel Primack
Research Projects
Physics 205 - 23Feb2021

    COSMOS
    GALAXIES
    PLANETS
Prof. Joel Primack
Research Projects

    COSMOS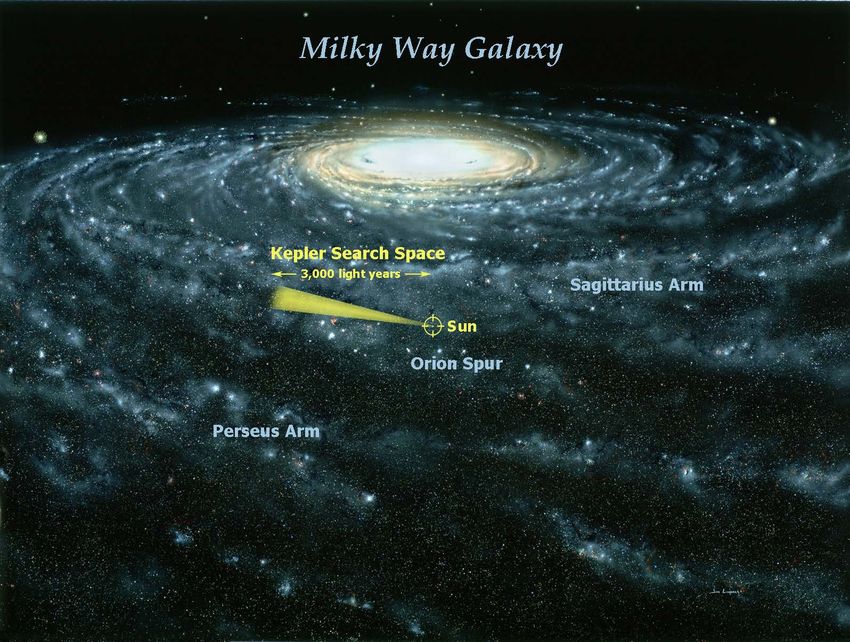
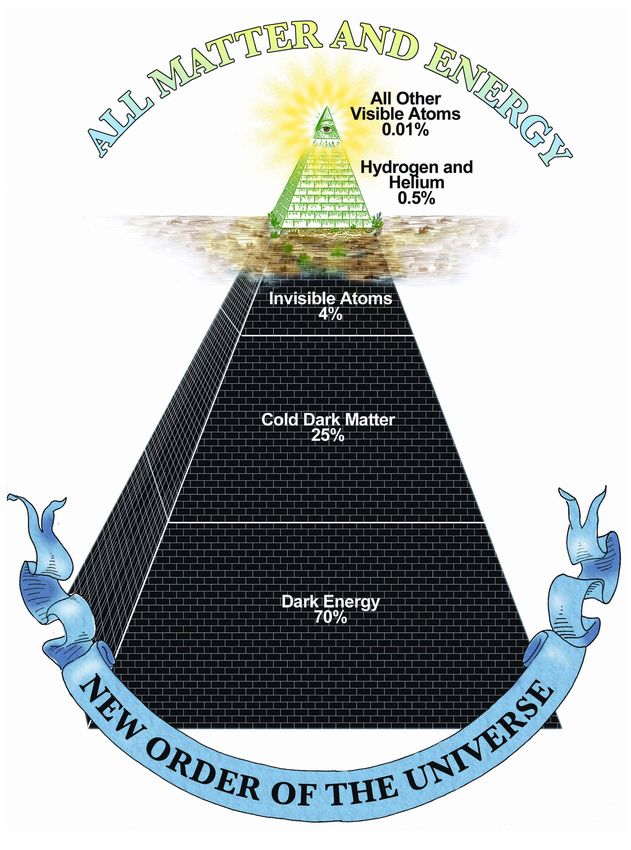
Hubble Space Telescope Ultra Deep Field - ACS

This picture is beautiful but misleading, since it
only shows about 0.5% of the cosmic density.

The other 99.5% of the universe is invisible.
COSMIC
DENSITY
PYRAMID
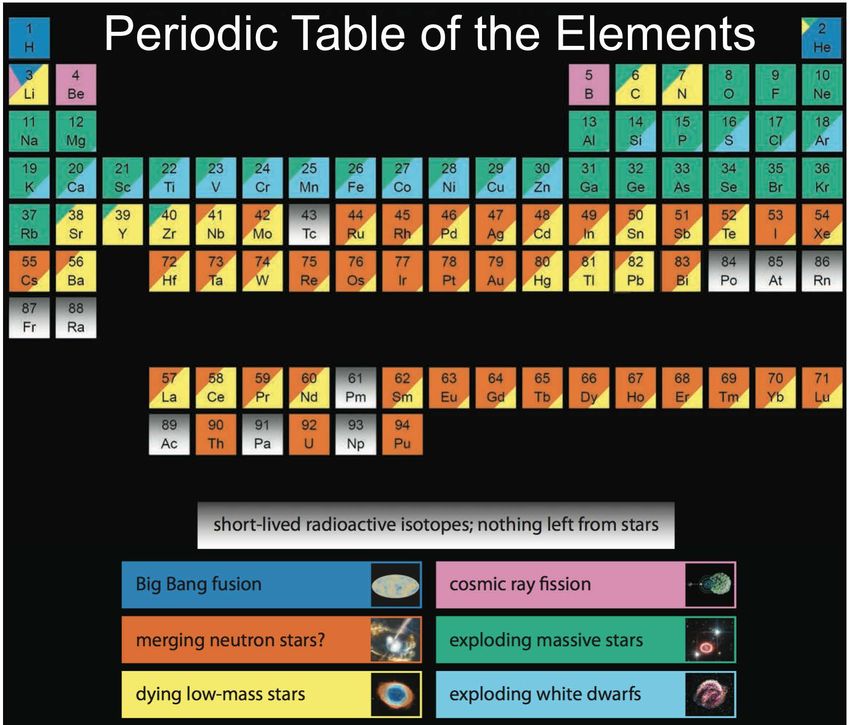
Periodic Table of the Elements

                                 stardust

                                   stars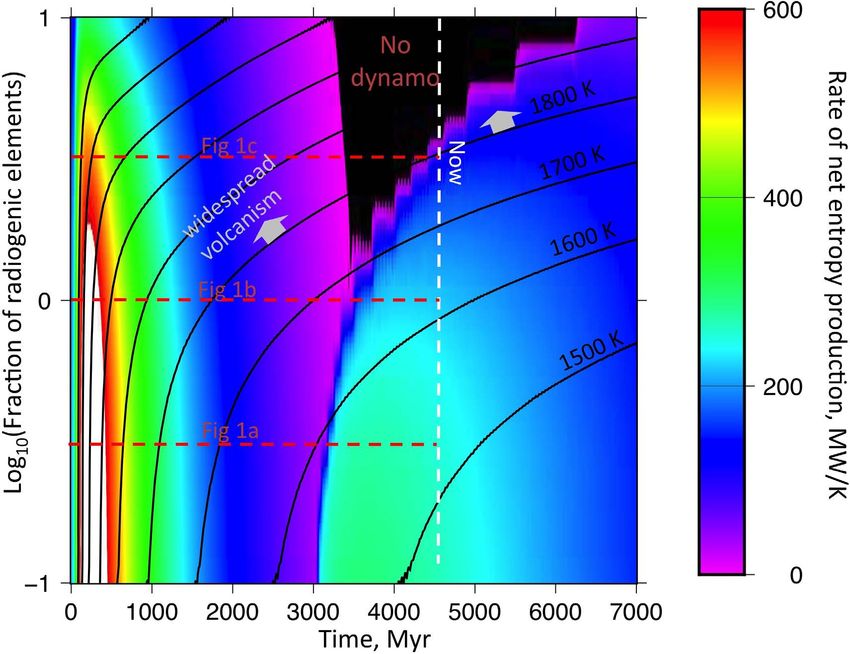
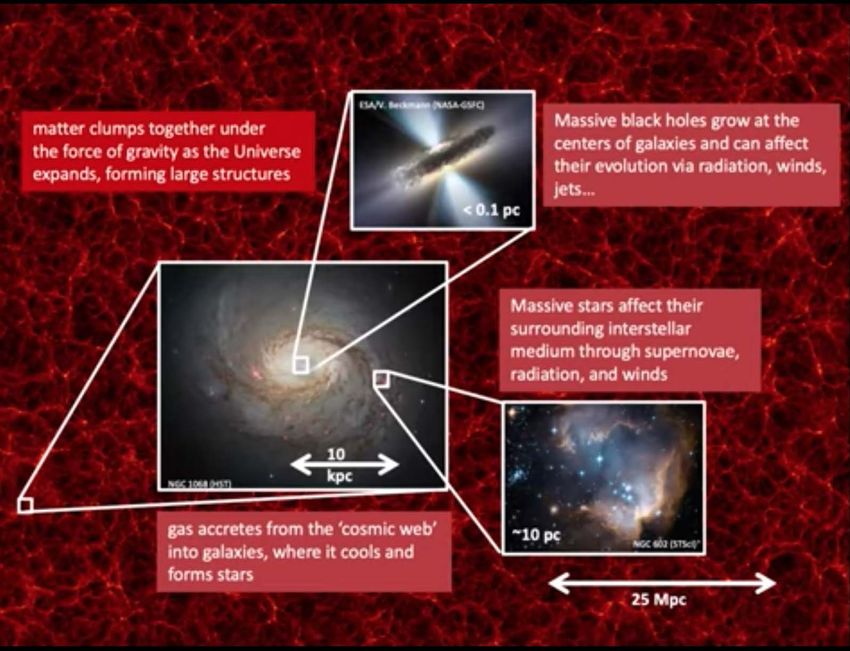
Many stars in the very early universe may have been much more
massive than our sun, in binary star systems with other massive
stars. When these stars ended their lives as supernovas, they
became massive black holes or neutron stars. The Laser
Interferometer Gravitational-wave Observatory (LIGO) has now
detected > 50 mergers of massive black holes. This confirmed
key predictions of Einstein’s general relativity for the first time.

In August 2017 LIGO and VIRGO announced the discovery of
gravity waves from merging neutron stars. Data from telescopes
shows that such events probably generate most of the heavy
elements like europium, gold, thorium, and uranium.
Matter and
Energy
Content
of the
Dark Universe
Matter
Ships
on a ΛCDM
Dark Double
Energy Dark
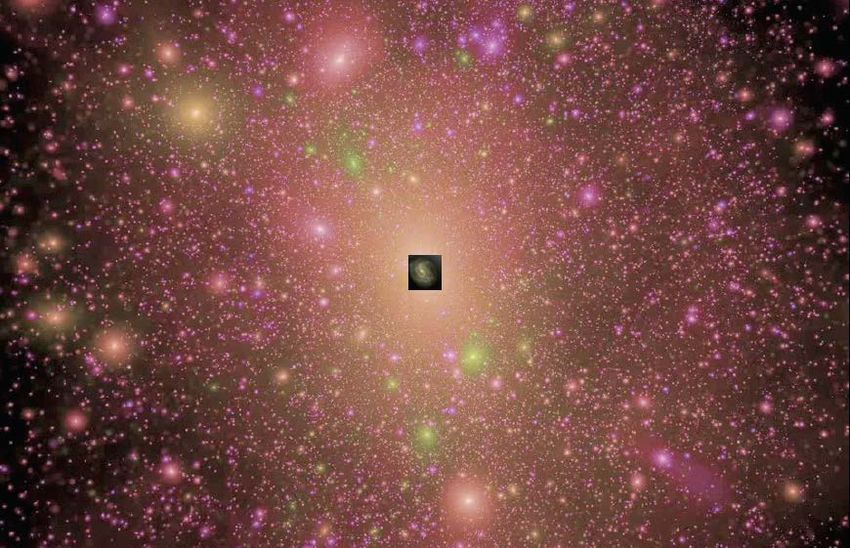
Ocean Imagine that the entire
Theory
universe is an ocean of dark
energy. On that ocean sail billions
of ghostly ships made of dark matter...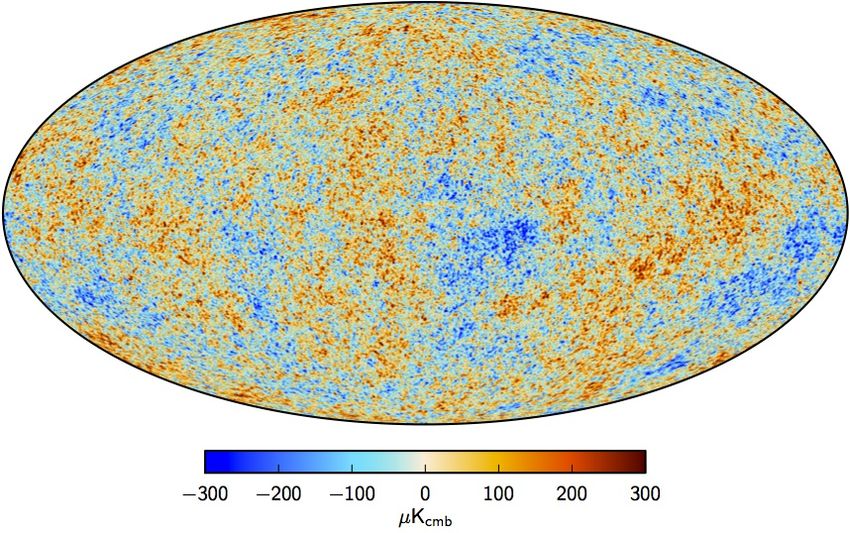
CDM Structure Formation: LinearMatter
                                Theory and
                                                                                                    Energy
                                                                                                    Content

                                                           growth by 105 x
                                                                                                    of the
                                                                                    Cold DM
                                         inside horizon                                             Universe
                                         outside horizon                                                         Hot DM
                                                                               Cluster and smaller-scale
                                                                               ν fluctuations damp
                                                                               because of “free-streaming”

Scale factor a = 1/(1+z)            log a ➞
                                                                                            Cold DM
   CDM fluctuations that enter the horizon during the
   radiation dominated era, with masses less than about
   1015 M , grow only ∝ log a, because they are not in
          ⦿

   the gravitationally dominant component. But matter
   fluctuations that enter the horizon in the matter-
   dominated era grow ∝ a. This explains the
   characteristic shape of the CDM fluctuation
   spectrum, with δ(k) ∝ k-n/2-2 log k and δprimordial = kn
   Primack & Blumenthal 1983,
   Primack Varenna Lectures 1984                                             Blumenthal, Faber, Primack, & Rees 1984
CDM Structure Formation
CDM Structure Formatio Milky Way mass
Dwarf galaxies galaxies start
start forming forming
Clusters start
forming
growth by 105 x
inside horizon
outside horizon
t 0.4 20 500 Myr
z 1000 100 10
Scale factor a = 1/(1+z) log a ➞Matter Distribution Agrees with Double Dark Theory!
Hlozek et al. 2012Cosmic Background
Cosmic Background Radiation
Radiation Angular scale 6000
6000 Planck Collaboration: Cosmological parameters
5000
90 18 1 0.2 0.1 5000 0.07
European
European 6000
Double
6000
4000
4000
Planck Collaboration: The Planck mission
Planck Collaboration: The Planck mission
[µK2 ]2 ]
Double
Space
DDTTTT[µK
5000 3000
Dark
Space
3000
5000 Dark Planck Collaboration: Cosmological parameters
Theory
Theory 4000 2000
Agency
2000
[µK ] ]
Agency 4000 [µK 2 3000
1000
1000
PLANCK Cosmic
T2T
PLANCK 3000 Variance 00
D
2000 600
600 60 60
Satellite
300
300 30
Fig. 7. Maximum posterior CMB intensity map at 5 resolution derived from the 30
DDTTTT
Satellite 2000
0
joint baseline analysis of Planck, WMAP, and
00 0 0
408 MHz observations. A small strip of the Galactic plane, 1.6 % of the sky, is filled in by a constrained realization that has the same
1000
D
statistical properties as the rest of the sky.
-300 -30
Temperature-Temperature
0
Fig. 7. Maximum posterior CMB intensity map at 5 resolution derived from the joint baseline analysis of Planck, WMAP, and
408 MHz observations. A small strip of the Galactic plane, 1.6 % of the sky, is filled in by-30
{
-300
Data
a constrained realization that has the same
Temperature-Temperature -600
statistical properties as the rest of the sky.
-60-60
Data
0 -600
600 22 10
10 30
30 500
500 1000
1000 1500 1500 2000
2000 2500 2500
60
300 30
Released 1000
DT T
Fig.
Fig. 9.
Fig.9. The
10.The Planck
Planck
0Planck 2015
T T2015
power temperature
spectrum. power
temperature power
The points spectrum. At multipoles
in theAtupper
spectrum. panel show
multipoles `
` 30the 30 we show
wemaximum-likelihood the
show the maximum estimates maximum likelihood
likelihoodof frequency
the primary
frequency averaged averaged
CMB 0
Released
September 24, temperature
temperature
spectrum-300
spectrum
computed computed
spectrumascomputed
describedfrom from the
in thethetext Plik
Plik cross-half-mission
for cross-half-mission
the best-fit foreground likelihood
likelihood
and nuisance with
Fig.
with
8. Maximum
foreground
foreground
parameters
posterior amplitude Stokes and
Q (left)
and
ofother
and U
other
the Planck+WP+highL
(right) maps derived
nuisance
nuisance parametersfitdeter-
from Planck observations
parameters
between 30 and 353 GHz.
deter-
listed
-30
mined from the MCMC analysis
analysis of ofthethebasebase⇤CDM cosmology.InInthe
⇤CDMcosmology. the multipole range 2 ` 29, we plot
IX 2015).the power
These mapS have been highpass-filtered with a cosine-apodized filter between ` = 20 and 40, and the a 17 % region of the Galactic
spectrum
February
2019 9, mined from the MCMC
in Table 5. The red line shows the best-fit base ⇤CDM spectrum. The lower panel multipole range 2 29,
shows the residuals with respect to the theoretical
` we plot the power spectrum
plane has been replaced with a constrained Gaussian realization (Planck Collaboration From Planck Collaboration X
-60
(2015).
estimates -600from the Commander component-separationalgorithm
Commandercomponent-separation algorithmcomputed
computed over 9494 %% of
thethe sky. TheThe best-fit base ⇤CDM theoretical
estimates
model. from
The 0the
error bars are computed from the full covariance matrix, over
appropriately ofweighted sky. across best-fit
each base
band (see
⇤CDM Eqs. theoretical
36a and
2015 spectrum
spectrum
36b),
the and
fitted
fitted
include
toPlanck
to
2 the Collaboration:
the
beam
Planck TT+lowP
2
Planck TT+lowP
10
uncertainties and
likelihoodisisplotted
3010
likelihood
uncertainties
Cosmological parameters
plotted
50
500
in the
inthe
theupper
inforegroundupper
1000 500
These model
Fig.
panel.
8. panel.
Maximum
Residuals
Residuals
beenparameters.
consistency
posterior inamplitude
results between
1000
1500
Stokes theQTT
with
andand
(left) the U
full(right)
respect
viewed as work in progress. Nonetheless, we find a high level of
with respect
TT+TE+EE
One to
maps derived 1500 to
this
2000
from
way of
this
model
Planck observations
assessing the
model are
between
constraining power
30 and
are
contained 2000
shown
2500
353
in
shown
8.2.2. Number of modes
GHz.
a par- in in 2500
the lower
lower panel. The error
error bars
barsshow show±1 uncertainties.From
±1 uncertainties. FromPlanck
Planck Collaboration not depend strongly onXIII (2015).
Agrees with
with Double
DoubleDark Theory!
likelihoods.
mapS have Furthermore, thewith
highpass-filtered cosmological parameters filter
a cosine-apodized (whichbetween = 20 and 40,ofand
` measurement theanisotropies
a 17 % region of the Galactic
panel. The Collaboration comparable errors XIII (2015).
ticular CMB is to determine the
plane has been do
replaced ⌧) derived from
with a constrained Gaussianthe T E spectra have
realization (Planck Collaboration IX 2015). From Planck Collaboration X
Agrees Dark Theory! Multipole moment,
to the T T -derived parameters, and they are e↵ective number of a modes that have been measured. This `m
(2015). consistent to within typically 0.5 or better. is equivalent to estimating 2 times the square of the total S/N
Temperature-Polarization
in the power spectra, a measure that contains all the available
Polarization- 100
viewed as work 16
Double Dark Theory Temperature- Double Dark Theory
in progress. Nonetheless, we find a high level of 8.2.2. Number of modes
140 consistency in results between the TT and the full TT+TE+EE
likelihoods. Furthermore, the cosmological parameters (which One way of assessing the constraining power contained in a par-
20
Fig. 1. Planck 2018 temperature power spectrum. At multipoles ` 30 we show the frequency-coadded temperature sp ticular measurement of CMB anisotropies is to determine the
Temperature-Polarization showing a precise Polarization-Polarization
do not depend strongly on ⌧) derived from the T E spectra have
Fig. 19. The temperature angular
computed from the Plik cross-half-mission
power spectrum of the primary
Polarization CMB from Planck,
likelihood, with foreground and other nuisance
measurement Polarization
of seven
parameters
acoustic peaks, that
fixed to a best fit80as
15000
comparable errors to the T T -derived parameters, and they are
consistent to within typically 0.5 or better.
e↵ective number of a`m modes that have been measured. This
is equivalent to estimating 2 times the square of the total S/N
are well fit by a simple six-parameter ⇤CDM theoretical model (the model
the base-⇤CDM 70 plotted is the one labelled [Planck+WP+highL] in Planck Collaboration
cosmology. In the multipole range 2 ` 29, we plot the power spectrum estimates from the Com
in the power spectra, a measure that contains all the available
µK2 ]
10
XVI (2013)).
component-separationThe shaded area aroundcomputed
algorithm, the best-fit curve
overrepresents
86 % ofcosmic variance,
the sky. Theincluding the sky cut
base-⇤CDM used. The error
theoretical bars on individual
spectrum best fit points
to 60
the
DT E [µK2 ]
16
10000
also include cosmic variance.
TT,TE,EE+lowE+lensing The horizontal
likelihoods axis is logarithmic
is plotted in light up to `in
blue 50,
the and linear
upper beyond.
panel. The vertical
Residuals scale
with is
respect
`(` 1)C
to this
/2⇡. The measured
model are sh
5
0 = + l
0
C EE [10
the lower panel. The error bars show diagonal uncertainties,
spectrum shown here is exactly the same as the one shown in Fig. 1 of Planck5000
±1 including cosmic variance (approximated as Gaussian)
Collaboration XVI (2013), but it has been rebinned to show better 40
including uncertainties
the low-` region. in the foreground model at ` 30. Note that the vertical scale changes at ` = 30, where the horizon
switches from
-10 logarithmic to linear. -70
20
Double Dark Theory 0
Double Dark Theory
the best-fit
-20 temperature data Angularassuming
alone, scale -140 tected
the base-⇤CDM by Planck
estimates fromover
T Ethe
andentire sky, and
E E (the which therefore appro
“spectrum-based” con-
0
model, adding 90 the18beam-leakage
1 model
0.2 and fixing the0.1Galactic theboth
tains baseline
Galactic likelihood we
and extragalactic
Plik use No
objects. thepolarization
map-basedin-ap
16
dust amplitudes to the central values of the priors obtained from with the polarization efficiencies
6000 10
formation
100 is provided for the sources ⇣ at⌘ this time.the
fixed to
Theefficienc
⇣ 4 ⌘
PCCS
8
using the 353-GHz maps. This is clearly a model-dependent pro- EE EE
tained from the fits on E E: c100 = 1.021; c143
DT E
C EE
cedure, but
50000given that we fit over a restricted range of multipoles, 0 di↵ers0 from the ERCSC
⇣
EE
⌘ in its extraction philosophy: more e↵ort
EE fit 0
where the T T spectra are measured to cosmic variance, the re-
-8 0.966;
has-100 and
been made on the c 217 completeness
= 1.040. The CamSpec likeliho
of the catalogue, without re-
EE fit
-10 scribed in the next section, uses spectrum-based e↵ectiv -4
sulting polarization
-16
4000 calibrations are insensitive to small changes ducing notably the reliability of the detected sources, whereas
in the underlying cosmological model. 1000 ization efficiency 30 corrections, leaving an 1500
overall tempera
µK2]
2 10 30 500 1500 2000 2 10
thepolarization
ERCSC was built in the 500
calibration spirit
free of
1000
to releasing
vary within a reliable 2000
catalog
a specified pr
In principle, the polarization efficiencies found by fitting theThe Hubble parameter H0 is the expansion rate of the universe today.
2 difficulty for ΛCDM is the Hubble parameter tension:
A possibly serious
Cosmic Background
Radiation plus ΛCDM
gives H0 = 67.4±0.4
Ia Supernovae
& Cepheids
Several kinds of
nearby observations
give H0 = 73.3±0.8
Lensed Quasar
Time Delays
Verde Treu Riess 2019
“Early Dark Energy,” a 1.brief
Figure period
Compilation of ~5%
of Hubble extra
Constant dark and
predictions energy at z ~taken
measurements 4000,
from could
the re- resolve this
cent literature and presented or discussed at the meeting. Two independent predictions based onA brief episode of Early Dark Energy
} EDE about ~ 35,000 years after the Big Bang
modifies the ΛCDM extrapolation of H0
and avoids the Hubble tension.
1.0
Cosmic
Density
Fraction
0.8
0.6
Radiation
ri/rtot
Matter
Dark Energy
0.4
0.2
0.0
100 101 102 103 104 105 106
Figure 1. Compilation of Hubble Constant predictions and measurements taken from the re-
1+z
cent literature and presented or discussed at the meeting. Two independent predictions based on
early-Universe data (Planck Collaboration et al. 2018; Abbott et al. 2018) are shown at the top
left (more utilizing other CMB experiments have been presented with similar findings), while the Solid curves represent our ΛCDM+EDE
middle panel shows late Universe measurements. The bottom panel shows combinations of the
late-Universe measurements and lists the tension with the early-Universe predictions. We stress model, and dashed curves are standard
ΛCDM with the Planck parameters. Our
that the three variants of the local distance ladder method (SHOES=Cepheids; CCHP=TRGB;
MIRAS) share some Ia calibrators and cannot be considered as statistically independent. Like-
wise the SBF method is calibrated based on Cepheids or TRGB and thus it cannot be considered
as fully independent of the local distance ladder method. Thus the “combining all” value should
be taken for illustration only, since its derivation neglects covariance between the data. The
N-body simulations show that structure
three combinations based on Cepheids, TRGB, Miras are based on statistically independent
datasets and therefore the significance of their discrepancy with the early universe prediction is
forms earlier than in standard ΛCDM, but
correct - even though of course separating the probes gives up some precision. A fair summary is
that the di↵erence is more than 4 , less than 6 , while robust to exclusion of any one method, the present-day universe is very similar.
team or source. Figure courtesy of Vivien Bonvin.
Verde, Treu, Riess 2019 Klypin, Poulin, Prada, Primack, et al. 2020A brief episode of Early Dark Energy
5 HALO ABUNDANCES
about ~ 35,000 years after the Big Bang
To study halo mass functions we use simulations with 500h 1 Mpc
modifies theboxes
and 1000h 1 Mpc ΛCDM extrapolation
and mesh of H0
size Ng = 7000. Simulations
and avoids
with larger the
2h 1 Gpc Hubble
boxes have lowertension.
mass and force resolutions
– not sufficient for analysis of galaxy-mass halo abundances.
1.0 Halos in simulations were identified with the Spherical Over-
Cosmic density halofinder BDM (Klypin et al. 2011; Knebe et al. 2011) that
Density uses the virial overdensity definition of Bryan & Norman (1998).
Fraction The resolution was not sufficient for identifying subhalos, so only
0.8
distinct halos are studied.
Figure 10 shows the halo mass function at different redshifts.
The EDE model predicts more halos at any redshift, but the dif-
0.6 ference is very small at z = 0: a 10% effect for very massive
Radiation
ri/rtot
15 1
clusters M ⇡ 10 h M and just 1% for Milky Way-mass ha-
Matter
12 1
los with M = 10 h M . These differences hardlyDark make any EDE: 50% more cluster at z ~ 1, 2x more massive galaxies at z ~ 4
Energy
0.4 impact on predicted statistics of galaxies and clusters with obser-
Figure 10. Halo mass function at redshifts z = 0 4. Full curves in the bot-
vational uncertainties and theoretical inaccuracies being larger than
tom panel are for the EDE simulations and dashed curves are for the ⇤CDM
differences in halo abundances. simulations. The smaller box and better resolution simulations EDE0.5 and
0.2 The situation is different at larger redshifts: the number of ha- ⇤CDM0.5 are used for masses below M ⇠ 2 ⇥ 1013 h 1 Mpc. At z = 0 halo abundances are
0.0
even more at larger redshifts. For example, the EDE model predicts very similar for the models: EDE predicts ⇠ 10% more of the most mas-
100 101 102 103 10512 1 sive clusters M ⇡ 1015 h 1 M and 1%-2% more of galaxy-size halos with
4 6
almost twice more galaxy-size halos with10M > 3 ⇥ 10 h M 10
1+z M ⇡ 1012 13 h 1 M . The differences in abundances increase substantially
with the redshift. Klypin, Poulin, Prada, Primack, et al. 2020
Solid curvesandrepresent
4 The broadening our
attenuation of the ΛCDM+EDE
BAO feature is exponential,
t h computed
model, and dashed curves are standard
as adopted in our model given in Eq. 2, with a scale ⌃ nl
Research Projects:
following Crocce & Scoccimarro (2006); Matsubara (2008), i.e. ⌃nl th =
h
ΛCDM Ø with i 1/2the Planck parameters. Our
1
Plin (k)dk .
3⇡ 2
N-body simulations show that structure Run and analyze high-resolution EDE N-body simulations
forms earlier than in standard ΛCDM, but MNRAS 000, 000–000 (0000)
Fill high-res simulations with galaxies and clusters
the present-day universe is very similar.
Compare with observations
Klypin, Poulin, Prada, Primack, et al. 2020Prof. Joel Primack
Research Projects
COSMOS
GALAXIESAquarius Simulation
Volker Springel
Milky Way
100,000 Light Years
Milky Way Dark Matter Halo
1,500,000 Light Years
18Bolshoi Cosmological
Simulation
Anatoly Klypin & Joel Primack
1 Billion Light Years1 4
3
2
21Almost all the stars today are in large galaxies like our Milky
Way. Nearby large galaxies are disk galaxies like our galaxy
or big balls of stars called elliptical galaxies. But most
galaxies in the early universe didn't look anything like our
Milky Way. Many of them are pickle-shaped and clumpy.
We are just now figuring out how galaxies form and evolve
with the help of big ground-based telescopes, and Hubble
and other space telescopes that let us see radiation that
doesn’t penetrate the atmosphere.
Hubble
Space
Telescope
Keck
Observatory“Face Recognition for Galaxies”
Deep Learning Identifies High-z Galaxies in a Central
Blue Nugget Phase in a Characteristic Mass Range
Marc Huertas-Company, Joel Primack, Avishai Dekel, David Koo, Sharon Lapiner,
Daniel Ceverino, Raymond Simons, Greg Snyder, et al. ApJ 2018
Cosmological zoom-in simulations model how individual galaxies evolve through
the interaction of atomic matter, dark matter, and dark energy
Our VELA galaxy simulations agree with HST CANDELS observations that most
galaxies start prolate, becoming spheroids or disks after compaction events
A deep learning code was trained with VELA galaxy images plus metadata
describing whether they are pre-compaction, compaction, or post-compaction
The trained deep learning code was able to identify the compaction and post-
compaction phases in CANDELized images
The trained deep learning code was also able to identify these phases in real HST
CANDELS observations, finding that compaction occurred for stellar mass 109.5 -10.3
Msun, as in the simulations
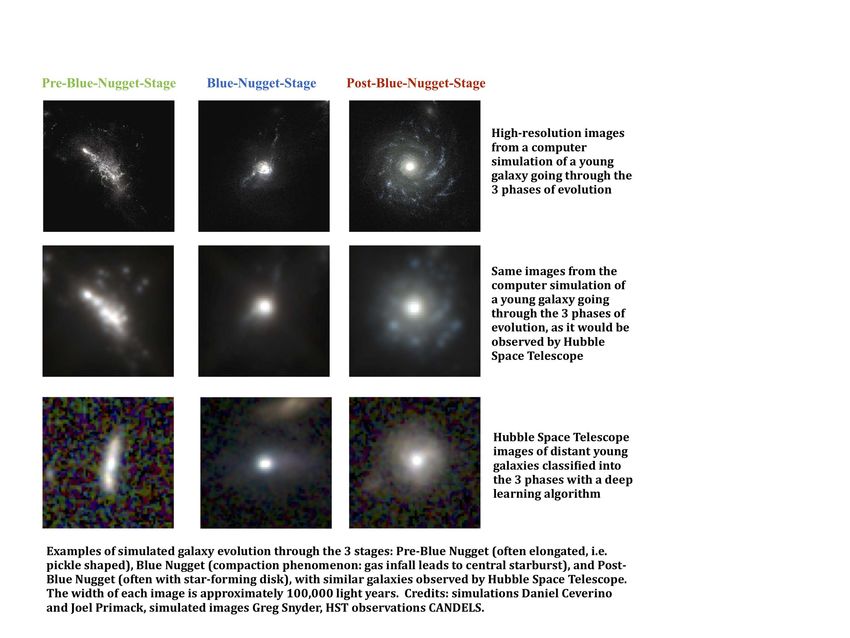
James Webb Space Telescope will allow us to do even better“Face Recognition for Galaxies”
Huertas-Company,
Pre-BN BN Post-BN Primack, et al. ApJ 2018
VELA High-Res
Sunrise Images
VELA HST-Res
Sunrise Images
CANDELS HST
ImagesConvolutional Neural Net
(Deep Learning)
Galaxy Evolution
Phase Determination:
HST vs. JWST
Deep learning does much
HST = Hubble Space Telescope better with JWST images
JWST = James Web Space TelescopeConvolutional Neural Net (Deep Learning)
High-Redshift Galaxy Giant Clumps: HST vs. JWST
Figure 2: E↵ect of varying feedback
on the frequency and properties of
HST clumps. The figure shows the same
VELA galaxy at z ⇠ 2 simulated with
two di↵erent feedback strengths (weak:
left column, strong: right column).
Rows show HST (top) and JWST imag-
ing. More low-mass clumps are ob-
JWST served in a weak feedback regime. The
NIRCam resolution better captures the
di↵erence, especially in central regions.
simulations suggest that clumps can live long enough to migrate towards the centers of th
host galaxies, eventually merging into the progenitors of today’s bulges (e.g., Mandelk
et al., 2017). This scenario is supported by observed radial color gradients of clumps (e.
Förster Schreiber et al., 2011; Guo et al., 2018). On the other hand, some other mod
and simulations suggest that clumps are self-disrupted by their powerful starburst-induc
(a)
outflows on a timescale of a few tens of Myr (e.g., Genel et(b) al., 2012; Oklopčić et al., 201
FigureThe two scenarios
4: Example distinguish
of (a) clump between
detection di↵erent
with ML feedback
and (b) models
SED fitting for and strengths,
optical detectedas clum
properties
clumps are very sensitive
in CANDELS. A similarto feedback
approach (e.g.,
will Mandelker
be followed et al.,
in this 2017).extending
program, Strong feedback
the ten
to disrupt
analysis clumps
of clump rather to
properties quickly, (Figures from
z > 3. preventing themmyfrom
JWST proposal.)
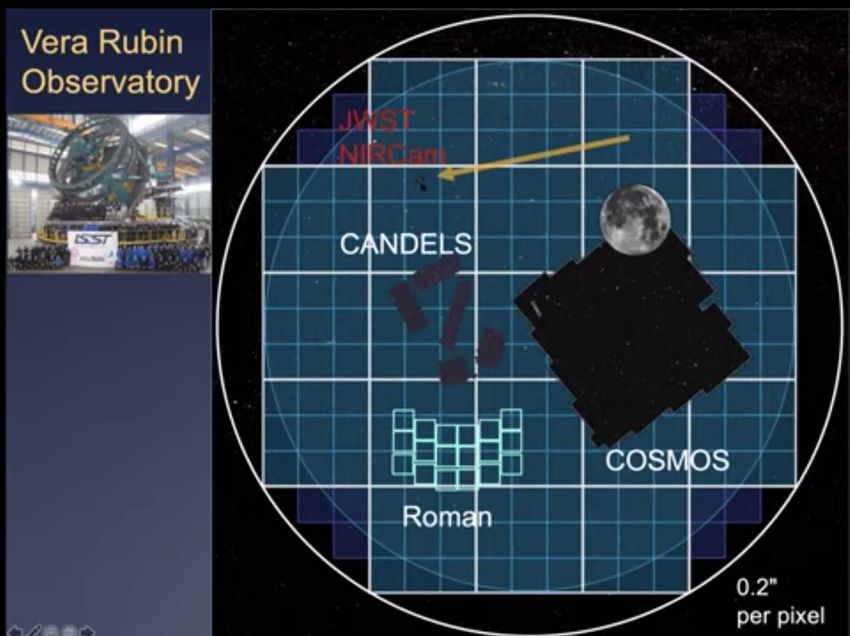
acquiring large stellar masses aHST New observatories will have great new capabilities: JWST - higher res, more light, > λ Roman (WFIRST) - 100x HST area Rubin (LSST) - all S sky transients, co-added depth 27
GALAXIES
                   Research
                   Projects:
Run and analyze more high-resolution galaxy simulations

Convert them into realistic images, including galaxy substructures

Use improved Semi-Analytic Models to predict galaxy populations

Compare with images from HST, JWST, Roman Space Telescope
and ground-based telescopes including Subaru HSC and Rubin
Prof. Joel Primack
Research Projects
COSMOS
GALAXIES
PLANETSWe have now discovered about 4000 planetary systems, mainly using star radial velocities from ground-based telescopes and planet-star transits observed by NASA’s satellites Kepler and TESS.
We used to think that our system is typical, with rocky
planets near our star and gas giants farther away.
Our system also seems unusually “clean” with relatively little
debris and dust. We know that there was a “late great
bombardment” of the inner planets about 800 million years
after the solar system formed. It seems likely that there was
a gigantic rearrangement of the Solar System back then.
There may be galactic habitable zones — not too close to galaxy
centers where there are frequent supernovae, nor too far where
metals (elements beyond He) may be too rare to form rocky planets.
Of the ~ 4000 planetary systems astronomers have discovered,
there are very few like ours, with all the planets widely spaced in
nearly circular orbits. Most planetary systems are much smaller.
The most common type of planet seems to be 2 to 6 times Earth’s
mass, a “super-Earth”. No such planet exists in our Solar System.
Some planets are in the habitable zone around their stars in
which water would be in liquid form, but most of these planets are
probably not hospitable to advanced forms of life. For one thing,
they might not have an optimal abundance of the long-lived
radioactive elements thorium and uranium to power a magnetic
dynamo and plate tectonics. Too much Th and U would result in a
lava world with frequent flood vulcanism, which caused the greatest
mass extinction events on Earth. Our living Earth may be a rare
“Goldilocks” planet with just the right amount of Th and U.
Radiogenic Heating and its Influence on Rocky Planet Dynamos and Habitability
  Francis Nimmo, Joel Primack, S. M. Faber, Enrico Ramirez-Ruiz, and Mohammadtaher Safarzadeh
  10                                      Nimmo et al.
                         Astrophysical Journal Letters (November 2020)

                      3x Earth’s Th and U

                          Earth’s Th and U

                       ⅓ Earth’s Th and U
3x Earth’s Th and U No magnetic dynamo & frequent flood vulcanism Earth’s Th and U Magnetic dynamo & plate tectonics ⅓ Earth’s Th and U Magnetic dynamo but no plate tectonics 34
PLANETS
                    Research
                    Projects:
Predict radioactive heating habitability of rocky exoplanets using
their star’s Europium abundance

Run 2D and 3D simulations of rocky planets, to verify and improve
on our 1D modeling

Examine other long-term constraints on habitability of rocky
planets: changes in orbits, obliquity, effects of supernovas …
Prof. Joel Primack
Research Projects
Physics 205 - 23Feb2021
COSMOS
GALAXIES
PLANETSSome Concluding Thoughts
Without Dark Matter We Wouldn’t Exist
With only the ordinary matter, the universe would be
a low-density featureless soup
Dark matter started to form structures very early
Galaxies formed within bound “halos” of dark matter
Stars formed within galaxies, and stars made elements
beyond hydrogen and helium: carbon, oxygen, …
Rocky planets formed from these heavier elements
Life began and evolved on one such planet
Dark matter is our ancestor and our friend!
Science Is Much Stranger Than Fiction
Before the discovery that most of the density of the
universe is invisible, no one imagined this
What else remains to be discovered?Joel Primack RECENT PhD STUDENTS
Rachel Somerville (PhD 1997) Jerusalem (postdoc) – Cambridge (postdoc) – Michigan (Asst.
Prof.) – MPI Astronomy Heidelberg (Professor) – STScI/Johns Hopkins – Rutgers (Professor)
Michael Gross (PhD 1997) Goddard (postdoc) – UCSC (staff) – NASA Ames (staff)
James Bullock (PhD 1999) Ohio State – Harvard (Hubble Fellow) – UC Irvine (Professor, Dean)
Ari Maller (PhD 1999) Jerusalem – U Mass Amherst (postdoc) – CityTech CUNY (Assoc. Prof.)
Risa Wechsler (PhD 2001) Michigan – Chicago (Hubble Fellow) – Stanford U (Prof., KIPAC Dir.)
T. J. Cox (PhD 2004) – Harvard (postdoc, Keck Fellow) – Carnegie Observatories (postdoc) –
Data Scientist at Voxer, San Francisco – Data Scientist at Apple, Cupertino
Patrik Jonsson (PhD 2004) UCSC (postdoc) – Harvard CfA (staff) – SpaceX Senior Programmer
Brandon Allgood (PhD 2005) – Numerate, Inc. (co-founder)
Matt Covington (PhD 2008) – analytic understanding of galaxy mergers, semi-analytic models of
galaxy formation – U Minn (postdoc) – U Arkansas (Assoc. Prof. of Geology)
Greg Novak (PhD 2008) – running and comparing galaxy merger simulations with observations –
Princeton (postdoc) – Inst Astrophysique de Paris (postdoc) – Data Scientist at Stitch Fix
Christy Pierce (PhD 2009) – AGN in galaxy mergers – Georgia Tech (postdoc) – teaching
Rudy Gilmore (PhD 2009) – WIMP properties and annihilation; extragalactic background light
and gamma ray absorption – SISSA, Trieste, Italy (postdoc) – Data Scientist at TrueCar, L.A.
Alberto Dominguez (PhD 2011) – UCR (postdoc), Clemson (postdoc), Madrid (postdoc)
Lauren Porter (PhD 2013) – semi-analytic predictions vs. observations – Data Sci at Facebook
Chris Moody – analysis of high-resolution galaxy simulations: galaxy morphology transformations
(PhD 2014) – Data Scientist at Square – Chief Data Scientist at Stitch Fix, San Francisco
Christoph Lee (PhD 2019) – galaxy simulations vs. observations with AI – Data Sci at Outschool
David Reiman (PhD 2020) – astrophysics deep learning applications – AI Scientist at DeepMind
Joel Primack CURRENT PhD STUDENTS
Viraj Pandya — semi-analytic models compared with observations (with Rachel Somerville)
Clayton Strawn — circumgalacticlactic medium: simulations vs. observations
James Kakos — combining spectroscopic & photometric redshifts with SORTYou can also read