COVID-19: April Data Update - April 15, 2021
←
→
Page content transcription
If your browser does not render page correctly, please read the page content below
COVID-19:
April Data Update
     April 15, 2021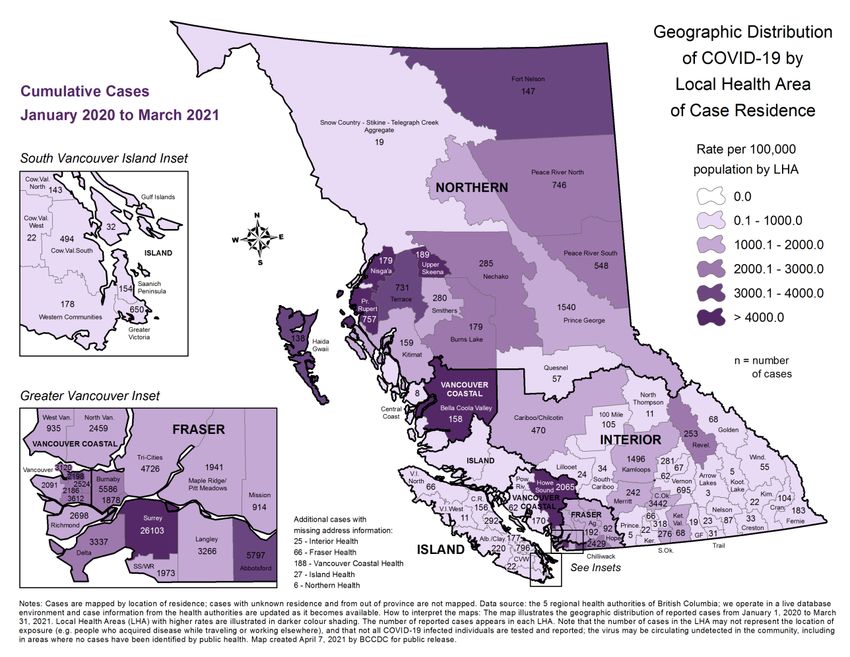
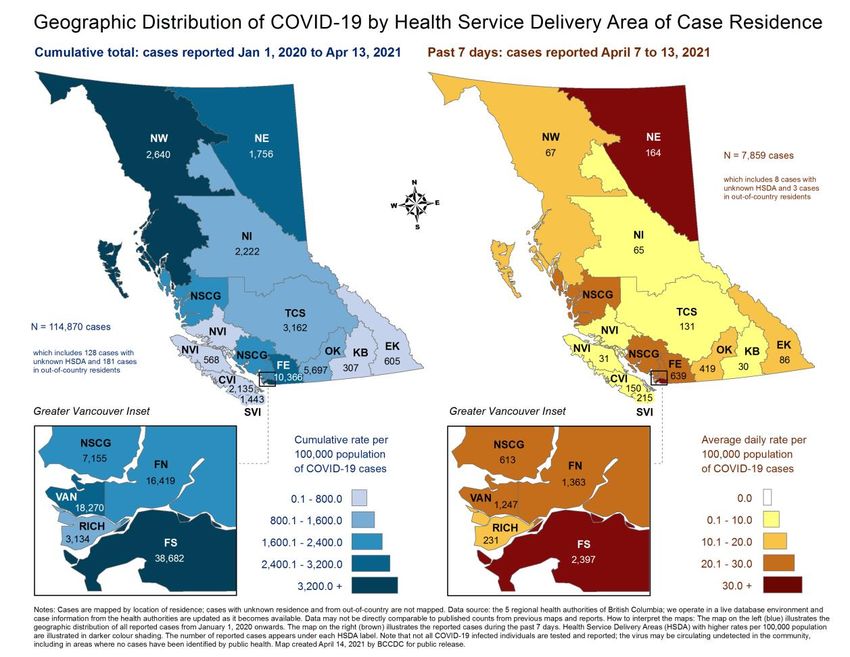
Geographic
Distribution of
COVID-19 by
Health Service
Delivery Area of
Case Residence

                   2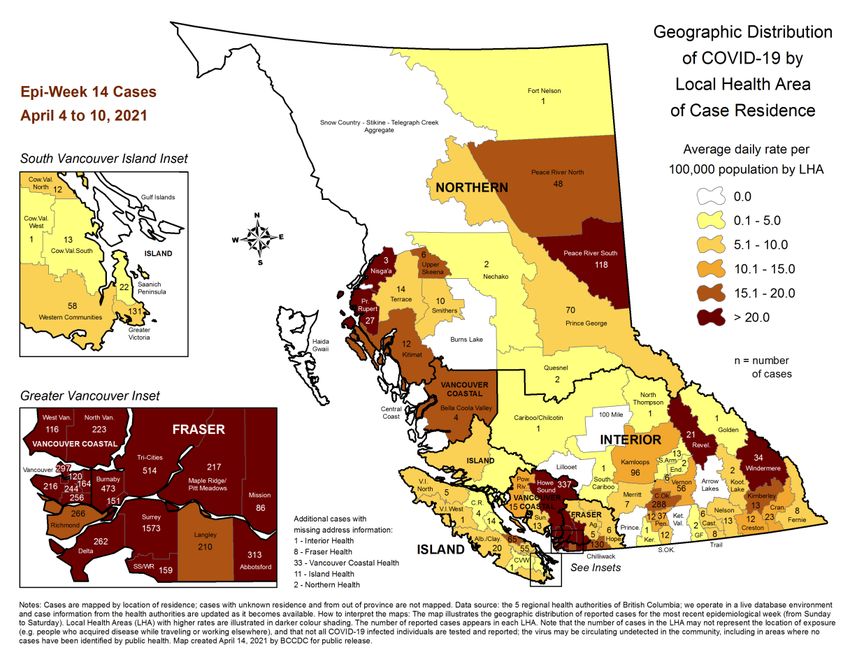
Geographic
Distribution of
COVID-19 by Local
Health Area of
Case Residence
Jan 2020-Mar 2021

                    3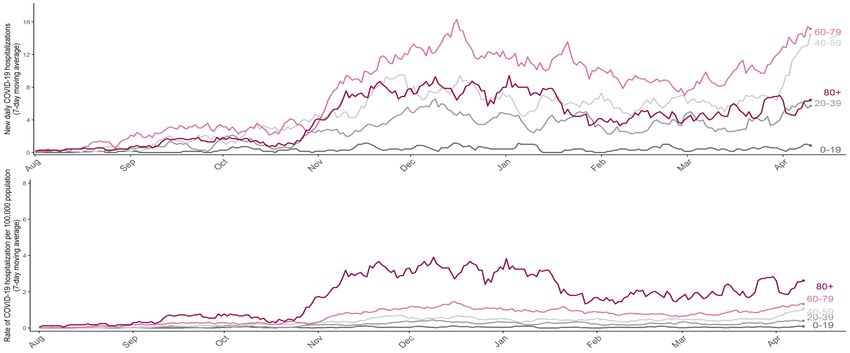
Geographic
Distribution of
COVID-19 by Local
Health Area of
Case Residence in
past 7 days

                    4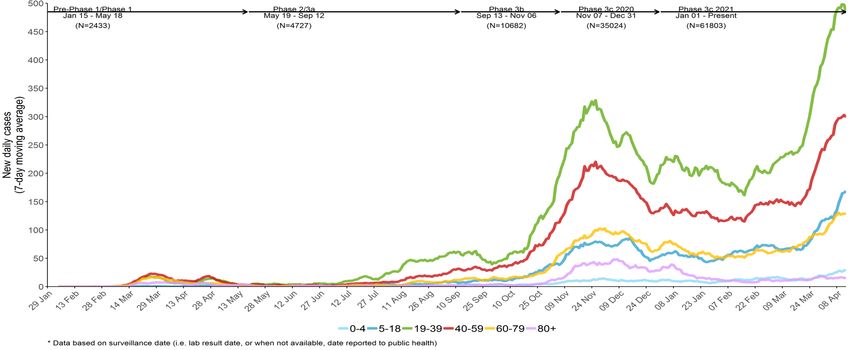
Average daily rate of new cases per 100,000 population by
          local health area April 7 to 13, 2021

                                                            5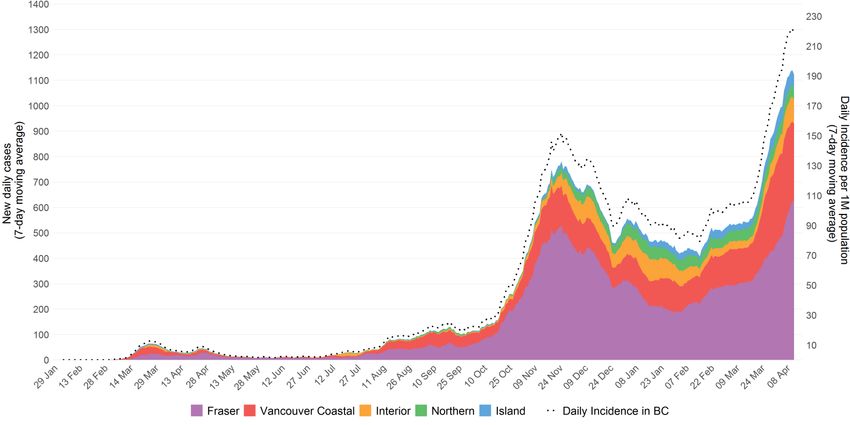
Total case counts by local health area April 7 to 13, 2021

                                                             6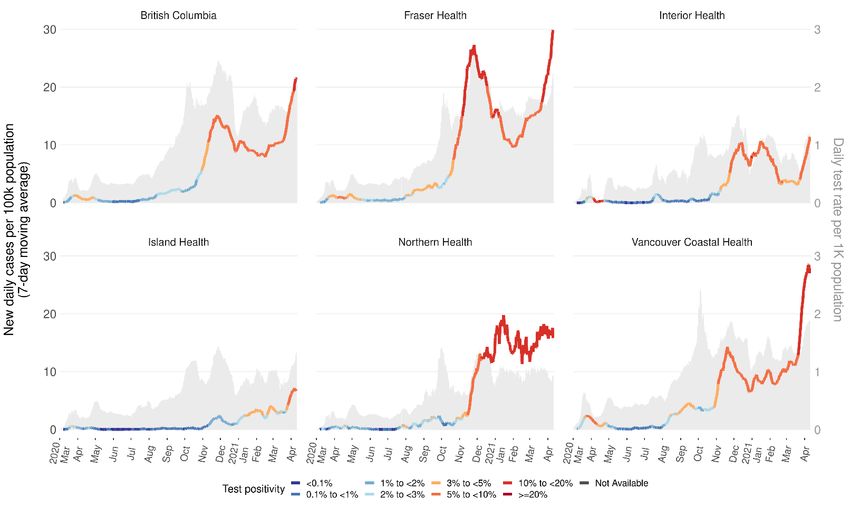
Daily cases, hospitalizations and deaths by surveillance date
                January 2020 to April 13, 2021

 114,870 total cases

 5,755 ever hospitalized

 1,521 deaths

 103,360 removed from isolation

                                                                7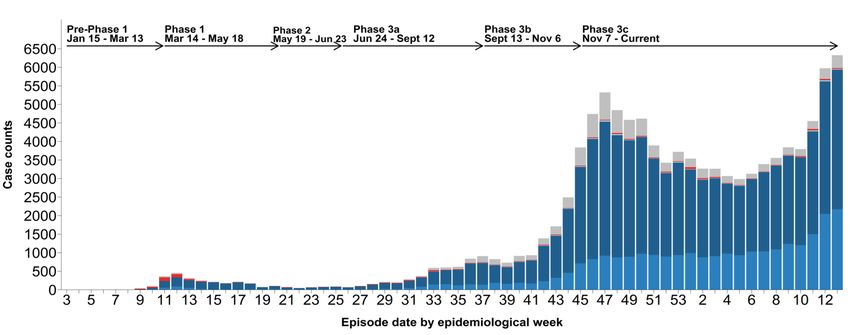
Epidemic curve, COVID-19 cases in B.C. by surveillance date
              January 2020 – April 13, 2021

                                                              8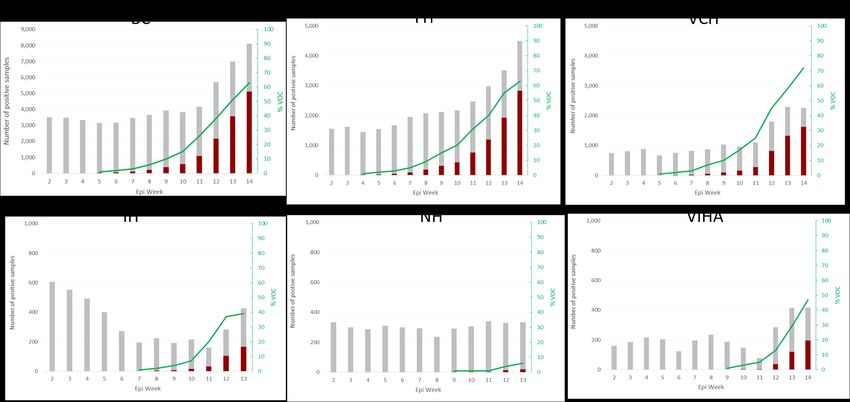
Likely source of COVID-19 infection by episode date, BC
            January 15, 2020 – April 3, 2021

                                                          9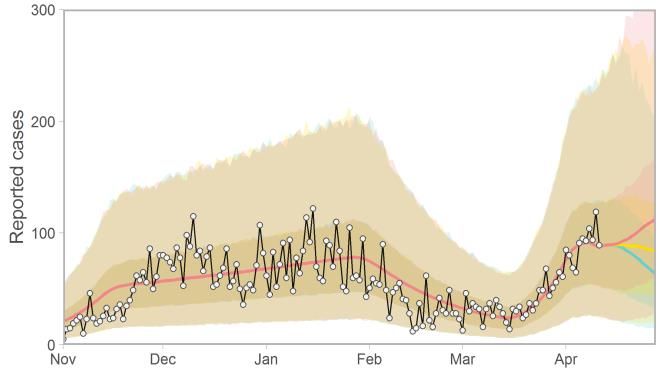
Daily case count by age January 2020 to April 13, 2021
              (7-day moving average)*

                                                         10
Daily case rate, testing rate and percent positivity by Health
Authority March 1, 2020 to April 13, 2021
11Vaccination progress in BC by age group up to 13 April 2021
Vaccinations
Hospitalizations
Deaths
12New daily COVID-19 hospitalization counts and
rates per 100,000 (August 2020 to April 2021)
Counts
Rates
13Age distribution of COVID-19 related hospitalizations and
deaths, Jan – Apr 2021
Data
incomplete
14Percentage distribution of COVID-19 cases, hospitalizations,
ICU admissions and deaths by age, British Columbia,
January 15, 2020 – April 3, 2021
15Variant of Concern (VOC) Detection Approaches in BC
16Estimated prevalence of presumptive VOCs and distribution of
confirmed viral lineages in BC, Jan – April 2021
P.1 B.1.1.7
49% 50%
B.1.351
Epi week 13* *Latest available. Not all sequencing
(Mar 28 – Apr 3) results for epi week 14 available.
17Approximate distribution of presumptive VOC prevalence by
Health Authority – estimates
P.1 B.1.1.7 P.1 B.1.1.7 P.1 B.1.1.7
Estimates of relative distribution of B.1.1.7 and P.1 are available for epi week 13, for BC, FH, and VCH only.
18School Exposures
April 15, 2021The start of school sessions do not appear to result in
significant increases in community transmission of COVID-19
at the provincial level in BC
1400
New daily cases (7-day moving
Sep 10, 2020
1200 1
1000
0.8
800
average)
0.6
600
0.4
400
0.2
200
0 0
Winter/spring break All ages 5-18 years Start of school
20COVID-19 Virus Has a Relatively Low Infection Rate
Among School-Aged Children (5 to 18 Years) in BC,
From September 7, 2020 to April 9, 2021
Age Groups Number of Cases Percent of Cases Percent of Population
0 – 4 Years 2113 2.07 4.41
5 – 12 Years 5468 5.37 7.65
13 – 18 Years 6350 6.23 6.16
19+ Years 87941 86.32 81.79
• No deaths among school age children due to COVID-19
• Less than 1 in 200 school aged children with COVID-19 hospitalized, which is
considerably lower than adults 19+ years (1 in 20)
21VCH and FHA School Transmission Studies
• In-depth reviews of COVID-19 cases among students and staff in
K-12 schools within the Health Authorities help us understand what
transmission looks like in the school setting.
• Identified cases where transmission likely occurred in school
through review of contact tracing records.
22Findings from the VCH Study (Sept 10 – Dec 18, 2020)
124,000 Staff and
Students and
teachers in VCH When transmission did occur within a school setting,
Region*
a case would typically lead to 1 or 2 other
cases in the school
699
(< 1% of COVID-19 Cases
students and among students
staff) (77%) and staff (23%)
55 Cases likely acquired in school
(8% of student
and staff cases)
During this time period there were a total of 8,746 cases reported in the VCH Region
*Approximate estimate based on those attending schools in person during this time period
23Student and Staff
Cases make up a small
proportion of overall
cases in VCH
School closures during holidays do not
appear to lead to reductions in overall cases
among students and staff.
24Findings from the Fraser Health Study (Jan 1 – Mar 7, 2021)
315,000 Staff and • When transmission did occur within a school
Students in Fraser
Region* setting, a case would typically lead to 1
other case in the school
2049 COVID-19 Cases
among students
• No transmission was identified in
(< 1% of students
and staff) (83%) and staff (17%)
approximately 85% of schools in the Fraser
region during this time period
267 Cases likely acquired in school
(13% of student
and staff cases)
During this time period there were a total of 16,053 cases reported in the Fraser Region
*Approximate estimate based Ministry of Education data
25Student and Staff Cases School closure
(Winter break)
make up a small
proportion of overall
cases in Fraser Health
Total
Cases
Student and staff cases follow
community trends – they are a
reflection of community
COVID-19 activity.
Student & Staff
Cases
26Key Messages
• COVID-19 cases in schools reflect community transmission
• Most cases of COVID-19 among students and staff are acquired
outside of school in their household or community
• When transmission occurs within the school, it is usually limited to
one or two additional cases
• School transmission does not appear to be a major driver of
community transmission
27Dynamic compartmental modeling: recent trends
Our model shows that Rt is above 1 in most regions of BC.
BC (1.37 → 1.26) Fraser (1.32 ≈ 1.31) Vancouver (1.49 → 1.13)
Coastal
Interior (1.62 ≈ 1.60) Vancouver (1.51 → 1.28) Northern (1.02 → 0.93)
Island
Solid black line: median Rt , data up to Mar 11, 2021; Grey band: 5%-95% credible interval; Purple bars: all reported cases.
Due to lag from symptom onset to reporting, most recent cases are not shown. Recent trend shown comparing 7 day average R t from (last week → this week).
28Dynamic compartmental modeling: recent trends
Rate of infectious
contact
Case Report Date
Solid blue line: median model fit; shaded bands: 50% and 90% credible intervals; Open circles: all reported cases, excluding reportable outbreaks, March 1 – April 11, 2021.
29Dynamic compartmental modeling: scenarios
Fraser Vancouver
Coastal Rate of infectious
contact
Interior Vancouver Northern
Island
Case Report Date
Solid blue line: median model fit; shaded bands: 50% and 90% credible intervals; Open circles: all reported cases, excluding reportable outbreaks, March 1 – April 11, 2021.
30BC COVID-19 Population
Health Survey – Round 2
Your Story, Our Future
We encourage all British Columbians to share
their experience and how they have been
affected by the COVID-19 pandemic one year
on, to help inform recovery and re-opening:
http://www.bccdc.ca/covid19survey
31You can also read