COVID-19 BCG Perspectives - Facts, scenarios, and actions for leaders
←
→
Page content transcription
If your browser does not render page correctly, please read the page content below

COVID-19

                                            Copyright © 2020 by Boston Consulting Group. All rights reserved. Updated 17 April 2020 Version 2.1.
BCG Perspectives
Facts, scenarios, and actions for leaders
Publication #2 with a focus on:
 • Preparing for the restart

Version: 20 April 2020
COVID-19
       BCG Perspectives
       Objectives of this document

                                                                                                                                   Copyright © 2020 by Boston Consulting Group. All rights reserved. Updated 20 April 2020 Version 2.3.
       COVID-19 is a global                                      Leaders need to drive an integrated
       societal crisis                                           response to navigate the crisis

       We at BCG believe that the COVID-19 outbreak is           It is the duty of health, political, societal, and business
       first and foremost a societal crisis, threatening lives   leaders to navigate through this crisis. A complex
       and the wellbeing of our global community. Society        interplay of epidemic progression, medical response,
       now, more than ever, needs to collaborate to protect      government action, sector impact, and company action
       people's lives and health, manage mid-term                is playing out jointly. This document intends to help
       implications and search for lasting solutions.            leaders find answers and shape opinions to navigate
                                                                 the crisis in their own environments. It encourages
                                                                 thinking across the multiple time horizons over which
                                                                 we see the crisis manifesting itself.

Source: BCG                                                                                                                    1
Executive Summary | COVID-19 BCG Perspectives

The COVID-19 disease progression continues to be a global challenge to societies, but interventions are starting to show positive effects
• Government measures to mitigate the spread are largely effective in slowing cases (doubling every ~10 days a week ago, to every ~15 days now)
• Testing is increasing, giving more transparency and control; in several countries, this is complemented by digitally enabled contact tracing
• While some countries are extending lockdowns and social separation, a few countries have started to progressively lift restrictions

Impact on sectors and business depends on intensity and shape of the health and economic recovery, especially in an extended fight phase
• Economic indicators and forecasts signal a severe downturn; global equity markets continue to be challenged and unemployment rates are rising

                                                                                                                                                                 Copyright © 2020 by Boston Consulting Group. All rights reserved. Updated 20 April 2020 Version 2.3.
• The last weeks showed a bounce in equity markets and in Total Shareholder Returns (TSR), but credit risks remain in many sectors
• It remains critical to understand the specific context and environment (e.g. geography, sector) to distill implications for future pathways of companies
• There will likely be an extended phase of 'fighting' the virus with many investments to bring forward therapies/vaccines in the next ~12-18 months
• Young consumers are largely worried about financial implications, but share positive sentiment about recovery across many geographies

Navigating the COVID-19 crisis, particularly an extended 'fight' the virus phase requires integrated action by governments and business leaders
• Governments need to ensure that reopening activities are guided by national health, and economic and social priorities, allowing for local adaptation
• Reopening requires careful preparation, for governments as well as business; e.g. Managing for a safe workplace also requires managing risks outside work
• Business leaders and governments can use this crisis as an opportunity to strengthen their cooperation for a united fight against the virus

                  We believe during this crisis, leaders need to be able to think along two dimensions:
         (1)Taking an integrated perspective on health/medical progression, governmental responses, societal
                   reactions, and economic implications to understand business/sector impacts and
            (2)Thinking multi-timescale (the now, near, and long-term future—in a flatten-fight-future logic).

Source: BCG                                                                                                                                                  2
COVID-19 will be a journey with three distinct phases requiring
an integrated perspective

                       Flatten                                               Fight                                         Future
Typically, the initial phase after a pandemic          Finding paths to collectively fight the virus,   Disease controlled through vaccine/cure/
outbreak – goal is to urgently limit number            restart the economy, and support society in      herd immunity, and treatment within
of confirmed cases, especially critical care           balancing lives and livelihood                   sustainable medical capacities possible

                                                                                                                                                          Copyright © 2020 by Boston Consulting Group. All rights reserved. Updated 20 April 2020 Version 2.3.
Social distancing (lockdown) and partial business      Moderate economic activity with recovering       Reactivated economy with strong business
closures outside a few, lead to economic               GDP, some business reopenings, and social        rebound and job growth, social restrictions
recession with large employment impact                 distancing on sustainable level                  limited or completely suspended

   1. Disease progression, health care system capacity, and response

   2. Government policies and economic stimulus

   3. Economic scenarios

   4. Business engagement and response

   5. Public engagement and response

                 All of the above five factors result in specific economic and social outcomes in each phase
Source: BCG                                                                                                                                           3
1   COVID-19 Context and Development
    Disease progression, health care system capacity, and response
    Government policies and action

                                                                                                                                                                          2.3. 2.1.
    Economic and Business Impact

                                                                                                                                                                      Version
                                                                                                                                                                  Version
2
    and Scenarios

                                                                                                                                                             20202020
                                                                                                                                                        17 April
                                                                                                                                                    20 April
    Economic response

                                                                                                                                                Updated
                                                                                                                                            Updated
    Scenarios and key drivers

                                                                                                                                      reserved.
    Business impact

                                                                                                                      All rights
                                                                                                                   Group.         reserved.
                                                                                                                           All rights
    Guide for Leaders

                                                                                                               Group.
3

                                                                                                        Consulting
                                                                                                    Consulting
    Determining government action

                                                                                              by Boston
                                                                                          by Boston
    Considering ecosystem interdependencies

                                                                                      © 2020
    Navigating businesses through the crisis

                                                                                   © 2020
                                                                            Copyright
                                                                         Copyright
                                                                     4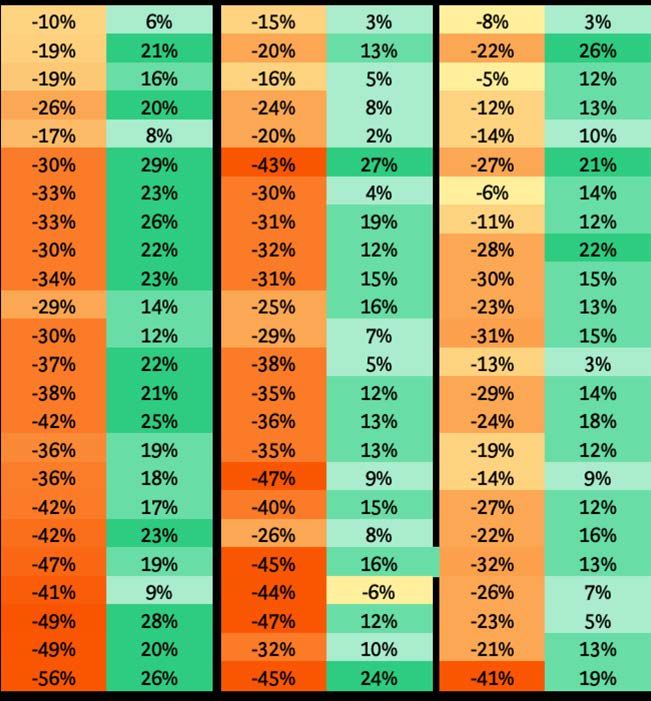
1   COVID-19 Context and Development
    Disease progression, health care system capacity, and response
    Government policies and action

    Economic and Business Impact

                                                                                                                                            Updated 20 April 2020 Version 2.3.
2
    and Scenarios
    Economic response
    Scenarios and key drivers

                                                                                                                                      reserved.
    Business impact

                                                                                                                      All rights
                                                                                                                   Group.         reserved.
                                                                                                                           All rights
    Guide for Leaders

                                                                                                               Group.
3

                                                                                                        Consulting
                                                                                                    Consulting
    Determining government action

                                                                                              by Boston
                                                                                          by Boston
    Considering ecosystem interdependencies

                                                                                      © 2020
    Navigating businesses through the crisis

                                                                                   © 2020
                                                                            Copyright
                                                                         Copyright
                                                                     5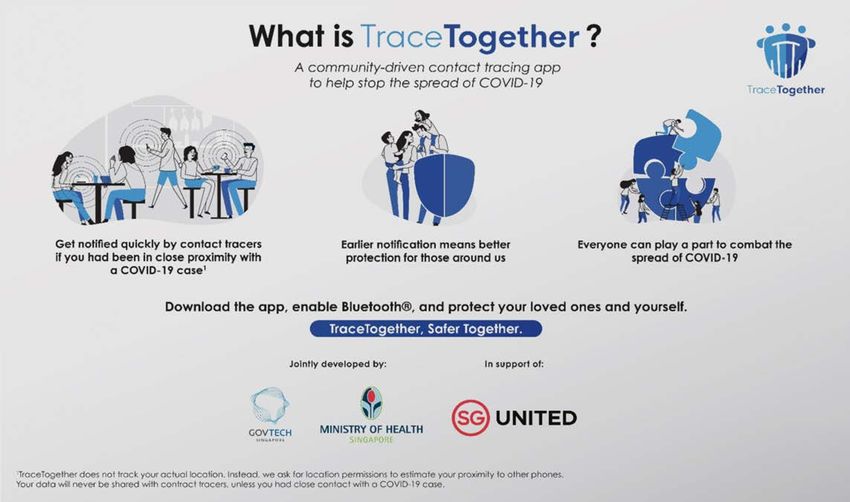
DISEASE PROGRESSION,
COVID-19 pandemic spread: Cases doubling every ~15                                                                                     days1 globally                        HEALTH CARE SYSTEM
                                                                                                                                                                             CAPACITY, AND RESPONSE

As of 16 April 2020

                                                        UK

                                                    France                                                                            2nd Apr'20          9th Apr'20            16th Apr' 20
                                                  Spain
                                                              Italy
                      USA                                                                   China                 Japan
                                                                               Iran
                                                                                                             South
                                                                                        India                Korea                       7                    10                     15

                                                                                                                                                                                                                                                                                                      2.3.
                                                                                                                                                                                                                                                                                17 April 2020 Version 2.1.
                                                                                                                                        days                 days                   days

                                                                                                                                           # of days for doubling1 the cases globally

                                                                                                                                                                                                      Copyright © 2020 by Boston Consulting Group. All rights reserved. Updated 20
                                                                                                                                         53k                  95k                   144k
Days of doubling cases:
                                                                                                                                                       # of fatality cases
      0-3 days                  3-6 days                     6-14 days                    14-30 days                   >30 days

           183                                  2.2M                   [∆5%]3                   144k                  [∆6%]3
                                                                                                                                         150                  163                    164

   Countries with cases2                      Confirmed cases globally                          Fatality cases globally
                                                                                                                                            # of countries with local transmission

Note: Continued cases and fatalities are subject to different testing, propensity, reporting standards and hence imperfect measures
1. No. of doubling days based on 7 day CAGR 2. Basis Johns Hopkins CSSE ; 3. Daily growth rate basis 7 day CAGR
Sources: Johns Hopkins CSSE, Our world in data, WHO situation reports, BCG analysis                                                                                                            6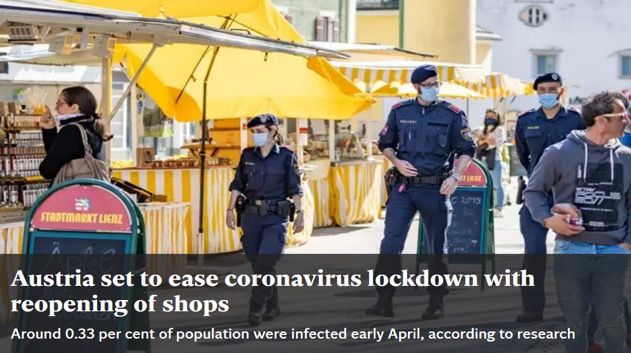
DISEASE PROGRESSION,
The week that was…                         HEALTH CARE SYSTEM
                                           CAPACITY, AND RESPONSE

From 11 to 17 April 2020

                                                                    Copyright © 2020 by Boston Consulting Group. All rights reserved. Updated 20 April 2020 Version 2.3.
                           14 April 2020

                                                           7
Doubling days is an early indicator of the phase a country is in;                                                                                                                   DISEASE PROGRESSION,
                                                                                                                                                                                    HEALTH CARE SYSTEM
flattening of the curve now evident in several countries                                                                                                                            CAPACITY, AND RESPONSE

As of 15 April 2020

                                          Daily growth rate of total cases (seven-day average)                        Total cumulative number of confirmed cases (log scale)
Flatten
                                          15%                                                                         1,000,000
                                                                                                                                               Countries2 with doubling rate > 14 days

                                                           Singapore                                                                                                                 Spain    Italy
  Rates improving from top to bottom

                                                                                                                                                                                                               Copyright © 2020 by Boston Consulting Group. All rights reserved. Updated 20 April 2020 Version 2.3.
                                                                                                                                                                                       Germany
                                                                       India                                            100,000                                                        France         China
                                                                                                                                                                                         Iran
                                          10%                     Japan                      Cases doubling: 8 days
                                                                                                                                                                                 Switzerland
                                                                                    Central & South America4                                                                      Netherlands
                                                                                                                                                                         Portugal
                                                                          Brazil                                                                                               Austria
                                                                                                                         10,000                                                                  South Korea
                                                                                           UK
                                                                           Canada                                                                                         Norway
                                                            Sweden     Africa   Belgium
                                           5%                                                        US
                                                               Portugal        Netherlands Cases doubling: 14 days                                                        Iceland
                                                                                       France                             1,000
                                                                                            Italy
                                                                                Iran          Spain
                                                           Norway Austria
                                                Iceland                              Germany
                                                                        Switzerland
                                                        South Korea                    Greater China
                                           0%                                                                                100
  Fight                                     1,000              10,000                100,000            1,000,000                  0           10         20        30          40       50         60
                                                    Cumulative number of confirmed cases (log scale)                                                                                  Number of days3
                                       Africa   Asia1     Central & South America         Europe    North America                                          Asia1          Europe

1. Includes Middle East 2. Countries selected from the chart on the left 3. # of days after exceeding 100 confirmed cases 4. Excludes Brazil                                                            8
Source: Johns Hopkins CSSE, Our World in data, WHO situation reports
Testing ecosystem is proliferating—across both                                                                                                                DISEASE PROGRESSION,
                                                                                                                                                              HEALTH CARE SYSTEM
high-throughput in-lab and rapid near-patient tests                                                                                                           CAPACITY, AND RESPONSE

As of 16 April 2020
                                                                                                                                                                              Not exhaustive

Test                                             Available for                                               Becoming available now            In
purpose                                          last 3+ weeks                                               (over last 1-2 weeks)             development

                                                   Examples

                           Lab-based

                                                                                                                                                                                               Copyright © 2020 by Boston Consulting Group. All rights reserved. Updated 20 April 2020 Version 2.3.
   Presence of
  viral genome
                         Near-patient/
                         Point-of-Care                                                                                        Rapid, on-site
                                                                                                                              portable test                Handheld digital PCR

                           Lab-based
    Immune
  response to
      virus              Near-patient/                                                                                                               Many players announced
                         Point-of-Care                                                                                                                development plans1

                                                                                                                                                        Biosensor, 1 min
     Presence of viral particle                                                                                                                         result (early stage
                                                                                                                                                         of development)

1. More that 90 serology test makers have notified FDA that they have serology tests available for use as of April 16, 2020
Source: CDC website, FDA website, company websites                                                                                                                                    9
DISEASE PROGRESSION,
Continued ramp-up of testing across countries HEALTH CARE SYSTEM
CAPACITY, AND RESPONSE
As of 15 April 2020
# of cumulative tests per million people # of cumulative tests per million people
100,000 100,000
Testing rates per million for countries2 across
United Arab Emirates Iceland
national income levels3
Germany
Italy
Spain 10,000
10,000
Copyright © 2020 by Boston Consulting Group. All rights reserved. Updated 20 April 2020 Version 2.3.
Russia
US
France
South Korea
South Africa 1,000
1,000
Japan
India 100
100
10
# of confirmed cases per million people Mar 16 Apr 1 Apr 13
10
1 10 100 1,000 10,000 High income Lower-middle Upper-middle
countries income countries income countries
Africa Asia1 Central & South America Europe North America
1. Includes Middle East 2. Data corresponds to 37 of 56 countries represented in the chart on the left 3. As per World Bank classification
Source: World Bank, Worldometers.info, Our World in Data, Johns Hopkins 10Several countries drive digitally enabled contact tracing to DISEASE PROGRESSION,
HEALTH CARE SYSTEM
increase speed to detect outbreak and protect people CAPACITY, AND RESPONSE
As of 14 April 2020 Non-exhaustive list
Example: Singapore's TraceTogether Various contact tracing
Developed by Government | Voluntary | 1M+ downloads
apps launched:
Down- % of
Country App
-loads Population4
Aarogya
India 50M1 4%
Updated 20 April 2020 Version 2.3.
Setu
Israel Hamagen 1.5M1 17%
TraceToget
Singapore 1M1 18%
her
South Corona
1M2 2%
Korea 100M
reserved.
reserved.
Rakning C-
Iceland 150k1 40%
19
All rights
All rights
Stopp
Austria 100k3 1%
Corona
Group.
Group.
Czech
Consulting
eRouška 50k3 0.5%
Republic
Consulting
by Boston
by Boston
Germany, Australia, and several others are
© 2020
in advanced stages of launching a contact
© 2020
Copyright
tracing application
Copyright
1. Basis Press Research 2. Google play link no longer available 3. Basis App Annie data base 4. Downloads as a percentage of population 11
Source: App Annie data base; Google Play store; Press research, BCGDISEASE PROGRESSION,
As of 16 April 2020 HEALTH CARE SYSTEM
CAPACITY, AND RESPONSE
Vietnam First patient: 23 January
Total cases: 268
Population: Tests: 120k+
~96 Million
Recovered Cases: 177 (66%)
Deaths: 0 (0.0%)
Area:
331,210 sq. km
• Early border control (e.g. China as early as 3 January, Korea, Europe)
• National risk assessment exercise in early January; guidelines issued when Wuhan
Copyright © 2020 by Boston Consulting Group. All rights reserved. Updated 20 April 2020 Version 2.3.
reported 27 infections
Select developing • Strict govt. facilities/home quarantines leading to effective tracing and monitoring
• Early precautions: Schools closed since 17 January
economies are • Entered nationwide “Strict Social Distancing Rule” on April 1
leading the way
in driving Kerala
(India)
First patient: 30 January (first to report infections in India)
Total cases: 394
containment Population:
Tests: 10k+
Recovered Cases: 245 (62%)
Deaths: 3 (0.8%)
~34 Million
Area: • Mandatory quarantines weeks before any other state
38,863 sq. km • Civil society leaders and call centers helped clear doubts and remove stigma
• Monitoring teams in every village; 100,000+ under observation
• Schools and colleges closed since 10 March
• Daily briefings by top political executives ensured information flow and reduced panic
movement
Source: John Hopkins CSSE; Corona Control in Kerala –Snehil Kumar Singh; Press research; BCG 12Race for a cure: Significant progress being made across DISEASE PROGRESSION,
HEALTH CARE SYSTEM
preventative measures and treatment (antibodies, antivirals) CAPACITY, AND RESPONSE
As of 17 April 2020 Not exhaustive
Preventive measures Treatment of infection
Vaccines Antibodies Antivirals
Prophylactic measure to prevent Passive immunity by administering Act by preventing viral entry to cells or
infection by training the immune neutralizing antibodies against inhibit viral replication within the cell;
Overview
Copyright © 2020 by Boston Consulting Group. All rights reserved. Updated 20 April 2020 Version 2.3.
system to rapidly eliminate circulating viral particles in the blood potential to leverage existing anti-viral Tx
under development globally,
~80 of which three are in
preclinical stage
>30 under development globally >20 under development globally
Ongoing
research Small-scale early access for a small
Early results likely in Q2 2020; use will Early efficacy signals of Chloroquine based
subset of patients possible in Q3 2020
be limited to small scale/at risk groups compounds expected in Q2 2020
assuming positive results
Companies
Not Exhaustive
While significant progress is being made, treatments and vaccines may be many months away
13
Source: WHO, Company websites, Press releases, Fierce biotech, Genetic Engineering and Biotech press researchDISEASE PROGRESSION,
Countries are acting to ensure potential resurgence is contained HEALTH CARE SYSTEM
CAPACITY, AND RESPONSE
As of 12 April 2020
Daily infections by country Measures to curtail resurgence
Previous pandemics like MERS # of confirmed cases 31 Mar: Statewide stay-at-home
and the Spanish Flu had disease extended till at least 30-Apr Louisiana (US)
1,000
resurgence two to three times Wave 1 • Ban on public gatherings of 50+ people
• Closure of schools, bars, salons, cinemas,
500
gyms, casinos
Copyright © 2020 by Boston Consulting Group. All rights reserved. Updated 20 April 2020 Version 2.3.
UK Deaths per 1,000 persons Spanish Flu • Statewide stay-at-home order until at least
0 30 April
30 nd 8-Mar 22-Mar 5-Apr
2 wave
20
3rd wave
# of confirmed cases 08 Apr: Extended prohibition of
10 1st wave
public gatherings
100
0 Hong Kong
6/29 9/21 11/16 1/11 3/8 Wave 1 • Continuing of shutdown/containment
1918 1919 50 measures
• Closure of bars, salons, cinemas, public
Number of monthly cases worldwide 0 places till 23 April
23-Feb 8-Mar 22-Mar 5-Apr
400 2014 outbreak
in Middle East
MERS # of confirmed cases
2015 outbreak Singapore
200 in Korea
400 03 Apr: Circuit breaker/lockdown • Lockdown/shut downs for one month with
Wave 1
hefty fines for violators
0 200 • Shifting of healthy migrant workers to
2013 2014 2015 2016 2017 2018 2019
"floating hotels"
0 • Masks mandatory for anyone leaving home
Source: John Hopkins CSSE, Press Search, 23-Feb 8-Mar 22-Mar 5-Apr
BCG Henderson Institute Analysis 14Government measures continue to be enforced GOVERNMENT POLICIES
AND ECONOMIC STIMULUS
US gets stricter in hard-hit areas; China, Spain, Denmark, Iran selectively opening up
As of 16 April 2020
International Non-essential
School Restricted Non-essential travel Domestic travel local mvmt. Stricter social distancing norms
closure assembly business closure restrictions restrictions2 restrictions imposed in hard hit areas of US; New
York, California, New Jersey,
China Connecticut
Spain
France Spain begins lifting restrictions on 13
April with construction and
Copyright © 2020 by Boston Consulting Group. All rights reserved. Updated 20 April 2020 Version 2.3.
Switzerland manufacturing workers resuming work
Italy
Iran Denmark announces concrete plan
to lift restrictions; primary schools
Denmark to reopen from 15 April
Germany
US Iran allowed government offices
and business outside the capital
South Korea Tehran to open from 11 April
Japan
UK China lifted the lockdown
restrictions on Hubei allowing
Turkey people movement subject to green
India code classification
Extensions / New interventions post 31 Mar Relaxation measures Continuing interventions
1. Includes nationwide actions and actions taken by major local or regional governments. 2 Some German + US rail services are being reduced but not through government mandate
International travel restrictions flagged if any bans put in place or limits in place; Internal travel restriction includes reductions in public transport, or restricted access; Non-essential businesses include at least restaurants, entertainment
venues; School closures are any mandatory state closures; Assembly restrictions include mandatory and advised restrictions on large groups, restrictions on e.g. faith based gatherings; Non-essential local mvmt includes stated restrictions on
being outside or curfews | Source: Government and media reports 2. France, India and UK have extended the lockdowns starting week ending 18 April; whereas Turkey has a weekend lockdown. Denmark has allowed primary school to
reopen; Spain has allowed non-essential businesses like construction and manufacturing workers to go back to work; US has instituted stricter social distancing norms; Iran has allowed government offices and businesses outside Tehran to
turn operational; China has lifted Hubei lockdown allowing people movement 151 COVID-19 Context and Development
Disease progression, health care system capacity, and response
Government policies and action
Economic and Business Impact
Updated 20 April 2020 Version 2.3.
2
and Scenarios
Economic response
Scenarios and key drivers
reserved.
Business impact
All rights
Group. reserved.
All rights
Guide for Leaders
Group.
3
Consulting
Consulting
Determining government action
by Boston
by Boston
Considering ecosystem interdependencies
© 2020
Navigating businesses through the crisis
© 2020
Copyright
Copyright
16Global equity markets trending upward but still at a lower mean; ECONOMIC
RESPONSE
unemployment rates rise
As of 15 April 2020
Global equity markets varying Highest level of seasonally adjusted
around a lower mean unemployment claims in history
Initial US unemployment insurance claims (millions)
Markets looked past virus' Inflection with virus' spread to
spread in China Europe, USA and beyond
Copyright © 2020 by Boston Consulting Group. All rights reserved. Updated 20 April 2020 Version 2.3.
7
Total of 22M initial
Cumulative returns (%)
6 unemployment insurance
5 Feb 21 claims for last one month
0 5 (3.3M, 6.8M, 6.6M and 5.2M
for the last 4 weeks)
-5 4
-10 3
-15 2
Korea (KOSPI)
-20
U.S. (S&P 500) 1
-25 Japan (Nikkei 225)
0
-30 UK (FTSE 100)
-35 German (DAX)
India (Nifty 50)
21 Jan 1 Feb 1 Mar 1 Apr 15 Apr
1970 1980 1990 2000 2010 2020
Steeper sell-off than More critical sell-off Higher volatility than
in 1929 than 30% in 20081 '08 credit crisis peak2
17
1. Financial Crisis S&P sell-off at comparable time frame: 26/09/2008 – 27/10/2008 and 19/02/2020 - 23/03/2020 2. Peak VIX recorded 16/03/2020
Source: OECD, Impact of the COVID-19 pandemic on global FDI and GVCs, UNCTAD, US Bureau of Labor Statistics, BCGEconomic forecasts point toward severe downturn ECONOMIC
RESPONSE
As of 14 April 2020
US Europe China
Forecast GDP growth vs. baseline before COVID-19 Forecast GDP growth vs. baseline before COVID-19 Forecast GDP growth vs. baseline before COVID-19
9.5% (09.4.) BNP Paribas
6.1% (10.4.) BAML 6.1% HSBC Holding (14.4.) 9.2% (09.4.) JP Morgan Chase
5.5% (10.4.) Goldman Sachs Group 5.6% Credit Suisse (14.4.) 9.2% (14.4.) IMF
4.7% (14.4.) IMF 5.5% Morgan Stanley (14.4.) 8.8% (03.4.) Nomura Securities
Copyright © 2020 by Boston Consulting Group. All rights reserved. Updated 20 April 2020 Version 2.3.
3.4% (10.4.) ING Group 4.7% JP Morgan Chase (14.4.) 8.8% (10.4.) BAML
2.9% (10.4.) Credit Suisse
4.7% IMF (14.4.) ` 6.5% (07.4.) ABM Amro
2.9% (10.4.) Danske Bank 6.3% (03.4.) Dankse Bank
2.4% (10.4.) Barclays 3.5% Standard Chartered (10.4) Baseline: 6.0% 5.8% Baseline
Baseline: 2.0% 2.2% (13.4.) Citigroup 3.2% ING Group (14.4) Caixa Bank (27.3.): 5.5%
2.7% DZ Bank (27.3.) 5.8% (07.4.) ING Group
Visa (06.4.): -1.1% 1.7% Baseline
Last week’s range
Last week’s range
Last week’s range
1.8% UBS (14.4.) Danske Bank (03.4.): 5.2%
ABN Amro (10.4.): 1.4% 5.6% (09.4.) Credit Suisse
Danske Bank (10.4.): -2.0%
1.6% (06.4.) Visa
Baseline: 1.3% 1.4% Baseline Commerzbank (09.4.): 4.0%
Credit Suisse (10.4.): -2.6% Fitch Solutions (14.4.): -1.3% 1.4% Fitch Solutions
(14.3.) ING Group (07.4.): 4.0%
Deutsche Bank (31.3.): -4.2%
Barclays (10.4.): -4.5% JP Morgan Chase (14.4.): -3.4% 1.4% Danske Bank Credit Suisse (09.4.): 3.3%
JP Morgan Chase (10.4.): -5.3% Standard Chartered (10.4.): --4.0% (03.4.)
ABN Amro (07.4.): 3.0%
Morgan Stanley (03.4): -5.5% UBS (14.4.): -4.5%) HSBC (03.4.): 3.0%
BNP Paribas (10.4): -5.7% Morgan Stanley (14.4.): -5.0% Morgan Stanley (03.4.): 2.0%
IMF (14.4): -5.9% Barclays (14.4.): -5.5% IMF (14.4.): 1.2%
BAML (10.4.): -6.0% Natixis (14.4.): -5.9% JP Morgan Chase(09.4.): 1.1%
Rabo Bank (09.4.): -6.4% HSBC Holdings (14.4.): -6.4%
Nomura Securities (03.4.): 1.0%
HSBC Holdings (03.4.): -6.5% IMF (14.4.): -7.5%
ING Group (10.4.): -7.0% BNP Paribas (14.4.): -8.3%
Nomura Securities (06.4.): -9.0% Citigroup (14.4.): -8.4%
2020 2021 2020 2021 2020 2021
(DD.MM) format used
Note: As of reports dated 27 March 2020 to 14 April 2020
18
1. Estimated since GDP growth mentioned for second half of 2020 as average
Source: Bloomberg, IMF, BCG analysisScenarios and potential outcomes driven by five key questions SCENARIOS
AND DRIVERS
Shape may vary in depth and duration depending on country and sector composition of the economy
As of 14 April 2020 Illustrative
Flatten Fight Future
Shut-down Re-start Cure
Economic
Copyright © 2020 by Boston Consulting Group. All rights reserved. Updated 20 April 2020 Version 2.3.
activity 1a 2a
100%
3 Some sectors
2b
1b
Critical care
patients
What will be the LENGTH
What will be the LENGTH of "Fight"?
of "Flatten"?
Five questions 1a What are the preconditions to 2a What are the preconditions to transition?
When will we achieve them? Where does the
will shape the transition? When will we achieve them?
economy return to
economic 3 relative to the pre-
outcomes To what DEPTH does the economy What LEVEL of recovery does the economy COVID era in "Future"?
1b drop in "Flatten"?
2b achieve in "Fight"?
Source: BCG 19Flatten: Key scenario inputs and implications SCENARIOS
AND DRIVERS
Prelim figures for USA
As of 14 April 2020
Flatten Fight Future Scenario overview
1a 1b
Copyright © 2020 by Boston Consulting Group. All rights reserved. Updated 20 April 2020 Version 2.3.
Scenario LENGTH DEPTH of
Economic
parameters of “Flatten” economic drop
activity
• Disease progression2 • Revenue loss/week
Key • Government response3 • Hospital capacity
scenario • Sector composition of • Societal adherence to
Critical care drivers economy physical distancing
patients • Employment
• Mid May (~7 wks) • 15-20% loss
Potential
• Mid June (~1o wks) • 20-25% loss
outcomes
• Mid July (~13 wks) • 25-30% loss
Example: Lockdown duration scenarios1
1. Lockdown duration based on empirically observed 4-8 weeks from peak infection. Does not reflect impact from peak infection per capita rate, local health care capacity, local
testing/monitoring capability or local government policies. Duration varies by state, but duration reflects March W3 start
2. Disease evolution, infection rate, fatality rate, mutation, etc. 3. Social/economic policies, immigration, fiscal and monetary stimuli, etc. 20Flatten: Scenario selection and impact driven by localized SCENARIOS
geography and sector factors AND DRIVERS
Prelim figures for USA
As of 14 April 2020
Annualized economic impact1
15-20% loss 2-3% 3-4% 3-5%
DEPTH of
Copyright © 2020 by Boston Consulting Group. All rights reserved. Updated 20 April 2020 Version 2.3.
1b
economic loss 20-25% loss 2-4% 3-5% 5-7%
(Weekly economic loss)
25-30% loss 3-4% 4-6% 6-8%
W2 May W1 June W4 June
(7 weeks) (10 weeks) (13 weeks)
Scenario and impact 1a LENGTH of suppression
outcome differs based on (weeks)
geography and industry
Example: Lockdown duration scenarios2
1. Lower end of ranges rounded down and upper end of ranges rounded up to reflect uncertainty. 2. Lockdown duration based on empirically observed 4-8 weeks from peak infection. Does not reflect
impact from peak infection rate, local health care capacity, local testing/monitoring capability or local government policies. 21Total shareholder return (TSR) rebound over last 15-20 days SCENARIOS
AND DRIVERS
across markets and sectors
Two time periods from 21 February 2020 to 15 April 2020
Decline reflects economic scenario and consumer sentiment
TSR performance1 Americas Europe Asia Observations
2/21-3/20 3/20-4/15 2/21-3/20 3/20-4/15 2/21-3/20 3/20-4/15
Food/staples Retail
Pharma
Household Products
Non-discretionary/essential service
Healthier sectors less hit but still had recovery
Copyright © 2020 by Boston Consulting Group. All rights reserved. Updated 20 April 2020 Version 2.3.
Food & Beverage
Telecom
Semiconductors
Utilities
Broad set of industries experiencing
Health Equipment
Software
pressure, with some regions
Materials
particularly affected for certain
Pressured sectors Tech Hardware sectors (e.g. transport in Europe)
Prof. Services
Utilities and health equipment
Transport
generally better off in Asia
Capital Goods
Retailing
Financials
Media
Insurance
Real Estate
Hardest hit sectors have rebounded,
Auto
Vulnerable sectors but still negative TSR YTD
Banks
Hospitality
Durable Goods
Energy
Note: As of 15 April 2020; Based on top S&P Global 1200 companies; Industries are based on GICS definitions 1) Performance is tracked for two periods, first from 21 February 2020
(before international acceleration of outbreak) to 20 March 2020 (trough of the market) and from 20 March 2020 through 15 April 2020 22
Source: S&P Capital IQ; BCG Henderson Institute; BCGSCENARIOS
Credit risk continues to be a concern for majority of sectors AND DRIVERS
As of 21 February 2020 to 15 April 2020 Number of
companies with
Median 5-year CDS1 5-year CDS
implied probability probability of Companies in
of default1 default >15% distress (%)3 Observations
Food/staples Retail 5% 0 0%
Pharma 3% 1 5%
Household Products
Healthier sectors 4% 0 0%
Food & Beverage 4% 0 0%
Copyright © 2020 by Boston Consulting Group. All rights reserved. Updated 20 April 2020 Version 2.3.
Telecom 6% 4 15%
Semiconductors 6% 0 0%
Utilities 4% 0 0% Hospitality, energy, retailing
Health Equipment 5% 0 0% industries facing greatest risk
Software 5% 0 0% of default based on current
Materials 6% 7 15% credit profile
Pressured sectors Tech Hardware 4% 0 0%
Prof. Services 5% 0 0% Less discretionary sectors are
Transport 3% 8 32% largely at lower risk of default
Capital Goods 5% 6 10% in current climate
Retailing 8% 8 47%
Financials 6% 0 0% Other sectors may
Media 8% 2 14% have individual companies in
Insurance 6% 0 0% specific default risk as well
Real Estate 8% 5 20%
Vulnerable sectors Auto 12% 7 33%
Banks 6% 2 4%
Hospitality 12% 6 43%
Durable Goods 6% 1 5%
Energy 13% 9 26%
Note: As of 15 April 2020; Based on top S&P Global 1200 companies; Industries are based on GICS definitions
1 Credit Default Swap; 2 Performance is tracked for the period 21 February 2020 (before international acceleration of outbreak), through 15 April 2020 3. Distressed comprises over
15% implied probability of default Source: S&P Capital IQ; BCG Henderson Institute; BCG 23Governments stepping in to provide impetus to stressed sectors SCENARIOS
AND DRIVERS
As of 15 Apr 2020
Loans/Guarantees/
Direct payments Scrapping of charges Grants for salaries Other Benefits
Example: Aviation
~$30B for airlines and cargo
Grants to ensure continued
carriers (excluding grant for ~$30B grant to continue salaries Fund for emergency loans;
US salaries)
operations; have to maintain
for airlines and cargo employees deferral of taxes
90% employment
$10B in grants for Airports
Copyright © 2020 by Boston Consulting Group. All rights reserved. Updated 20 April 2020 Version 2.3.
Relief from airport fees
Forego fuel excise, air service Lowered bank ratios to improve
Australia $3.2B 15-month incentive loan
charge and regional security liquidity
fees
Guarantee of 80% of loan upto 80% of the wages of any 100% business rates holiday for
UK £5M employee 12 months
Carriers and airport operators to Rebate on landing charges, Rental relief for ground handlers,
75% of the first ~$4,600 of
Singapore defer fee payment to government parking charges, and office
employees monthly pay
cargo agents
amounting to ~$140M rentals at the airport scrapping of property tax
HKAA (Public Airport Authority)
HK$2 billion purchase scheme for
allowed 70% discount on rent for
Hong half-million air tickets, as well as Waiver of aeronautical charges
airport concessionaires; subsidy
Kong buying back airport services reduction on landing charges
of HK$1M for each large aircraft,
equipment
HK$0.2M for smaller planes
Source: Government Websites; Press Search 24Focused support to small industries and services SCENARIOS
AND DRIVERS
As of 16 April 2020
Loans/Guarantees/ Grants for salaries/
Direct payments Tax rebates/extension Employee Retention Other Benefits
Example: Services
SBA1 to pay all principal, interest $349B paycheck –protection Loan advance up to $10k to
Deferred tax payments until
US and fees on all existing SBA loan
December
program - 100% federally backed affected businesses without a
products for 6 months loans of up to $10M need to repay
Copyright © 2020 by Boston Consulting Group. All rights reserved. Updated 20 April 2020 Version 2.3.
Deferred tax payments by up to 4 $1,500 per fortnight per
Moratorium on evictions over
Guarantee of 50% for new, months (ATO2) employee for up to 6 months
Australia unsecured loans Instant asset write-off threshold 50% wage subsidy of an
next 6 months for commercial
tenants
increased to $150k apprentice for up to 9 months
Additional 3 months to file
£10k one-off grant to businesses
Guarantee of 80% of loan up to accounts with Companies HMRC3 to reimburse employers
UK £5M by British Business Bank Deferred VAT payments by 3 up to 80% of the salary costs
Commercial tenants to be
protected from eviction
months
1 month of rental waiver to
Guarantee of 80% of loan up to 25% tax rebate capped at $15k 8% rebate of the wages for 3
Singapore $1M at 5% interest rate and 15% property tax rebate months ($1.3B program)
stallholders and .5 months to
other tenants
Up to 100% loan guarantee Increase in subsidies from 66.7%
Deferred tax payments by up to 1 Subsidies for capital investments
Japan under a framework of up to 280M
year
to 90% for part-time pay and
up to 10M Yen
Yen wages
INR 10M emergency working Waiver of minimum account
capital loans within 48 hours; Tax payments deadline extended Pay 12% EPF4
contribution of balance;
India 3 month deferment of loan EMI5 by 3 months employer for 3 months reduced bank charges for digital
repayments transactions
1. SBA refers to Small Business Administration 2. ATO refers to Australian Tax Office; 3. HRMC refers to Her Majesty's Revenue and Customs;
4. EPF is Employee Provident Fund 5. Easy monthly instalments
Source: OECD. (2020); Press Search; SME Policy Responses 25Fight: Key scenario inputs and implications SCENARIOS
AND DRIVERS
Prelim figures for USA
As of 14 April 2020
Flatten Fight Future Scenario overview
2a 2b
Copyright © 2020 by Boston Consulting Group. All rights reserved. Updated 20 April 2020 Version 2.3.
LEVEL of
Scenario DURATION
economic
parameters of "Fight"
recovery
Economic activity
• Cure development/deployment timeline
Critical care patients
• Health care, testing, and monitoring
capacity
• Continued government response
Key scenario
• Societal response to social distancing
drivers measures
• Economic result
• Consumer behavior
• Output of different industries
1. Based on vaccine treatment implemented; 2. Level of economic openness 26Duration of Fight: Aggressive movement toward SCENARIOS
AND DRIVERS
vaccine in 12-18 months
As of 15 April 2020
Timeframe (years) 0 1 2 3 4 5
Small-scale clinical trial material Commercial scale-up
Traditional paradigm
Copyright © 2020 by Boston Consulting Group. All rights reserved. Updated 20 April 2020 Version 2.3.
Discovery /
Phase 1 Phase 2 Phase 3 Commercial launch
takes > 5 years screening
Scale-up at risk Commercial scale-up Scale to support
global demand
Small-scale clinical trial material Key success factors/indicators:
Phase 3 • Published safety data to show vaccine has
Potential accelerated Disc
Phase 1 (1,000s Commercial
been well tolerated in healthy volunteers
(10s patients) launch
pathway for Covid-19 patients)
• Manufacturing scale-up beginning
vaccine Phase 2 immediately (expected ~6-12 month lead
(100s patients) time)
Emergency use • Expansion of clinical trials to include
authorization for a volunteers over 60 years old
Limited pre-
small volume release
clinical testing • Established a clear view on a surrogate of
Start Ph 2 with efficacy (e.g. challenge model)
interim Ph1 data Potential animal
challenge study in parallel
Source: Company websites, BCG analysis, https://www.fiercepharma.com/vaccines/china-s-cansino-bio-advances-covid-19-vaccine-into-phase-2-preliminary-safety-data, 27
https://www.weforum.org/agenda/2020/04/bill-gates-7-potential-coronavirus-vaccines/, https://academic.oup.com/jid/article/doi/10.1093/infdis/jiaa152/5814216,
https://www.nature.com/articles/d41586-020-00927-3Duration of Fight: Data from therapeutics will likely emerge SCENARIOS
AND DRIVERS
in a few months; drugs will likely reduce severity of infection
As of 15 April 2020
Drug Current use Q2 2020 Q3 2020 Q4 2020
Remdesivir
• Ebola and other Currently used under Gilead may apply for ultra-quick review if Key success factors/
coronaviruses early trial data looks positive ; potential to
(investigational)
compassionate use
supply 140k treatment courses indicators:
Copyright © 2020 by Boston Consulting Group. All rights reserved. Updated 20 April 2020 Version 2.3.
• Clinical data from
Hydroxychloro- • Malaria and lupus Currently used under If clinical data is positive, high potential
controlled trials showing
compassionate use to scale production quickly
quine (Plaquenil) reduced hospitalization
time or infection level
Tocilizumab • Rheumatoid Likely to see data readout in Q3 2020 for
(Actemra) arthritis 28-day controlled study • Demonstrated safety
profile at the dose required
to achieve efficacy
Sarilumab • Rheumatoid Trials with severe or critically ill patients
started in late March 2020
(Kevzara) arthritis
• Bio-banking infrastructure
to support convalescent
• N/A (previously used Johns Hopkins team has begun to build a network
Convalescent of 40 sites across 20 states to biobank plasma; plasma
in H1N1 and Ebola
Results from the trials in the two New York scale will be a big limitation
serum outbreaks) hospitals are expected around the end of April
Synthetic • N/A Targeting clinical trials to begin
in Summer of 2020
antibodies Expect to have capacity to provide small
(i.e. produced scale access by late Fall 2020 (Regeneron)
in bioreactor)
Key: Prelim. data Early access Broad availability 28
Source: Company websites, WHO, https://milkeninstitute.org/covid-19-trackerFight: Likely very different ramps by geography and by sector SCENARIOS
AND DRIVERS
China example
As of 07 April 2020 Figures for China
People and goods are Coal consumption Property transactions
starting to move again moving higher are restarting
Copyright © 2020 by Boston Consulting Group. All rights reserved. Updated 20 April 2020 Version 2.3.
17-Jan 12-Feb 12-Mar 10-Apr 17-Jan 12-Feb 12-Mar 10-Apr 17-Jan 12-Feb 12-Mar 10-Apr
Areas with early intervention show signs of V-shaped ramp;
Wuhan/Hubei trending toward U shape
Note: China data re-based for weekdays excl. weekends relative to start of Chinese New Year. Congestion delay index average include Beijing, Shanghai, Guangzhou,
Shenzhen, and Wuhan; Daily coal consumption of major power plants = sum of daily average coal consumption of Jerdin Electric, Guangdon Yudean Group, Datang 29
International Power Generation, and Huaneng Power International, Inc. Source: Wind, www.cqcoal.com, and BCG Center for MacroeconomicsIn developed markets, younger consumers are concerned about BUSINESS ENGAGEMENT
virus's financial impact, but confident about restart and recovery AND RESPONSE
As of 30 March 2020 US Canada UK Germany France Italy
Financial security Strength in savings Economic outlook Return to normalcy
More worried Less worried Weaker Stronger Negative Positive Slower Faster
–20 pp Average –20 pp Average 20 pp –20 pp Average 20 pp –20 pp Average 20 pp
20 pp
Copyright © 2020 by Boston Consulting Group. All rights reserved. Updated 20 April 2020 Version 2.3.
Gen Z
(18–
25) Younger generations feel
more positive
Millennials
(26–40)
Gen X
(41–
55) Older generations
feel more secure
Baby
boomers+
(56+)
I am worried about my I have enough savings There will be an My spending habits will quickly
personal finances due to to get through economic recession due return to normal after the
the coronavirus to the coronavirus coronavirus is under control
Source: BCG COVID-19 Consumer Sentiment Survey, March 27–30, 2020 (N = 2,928 Canada; 2,985 France; 3,085 Germany; 2,150 Italy; 2,984 UK; 2,944 US), unweighted, representative within 3% of 30
census demographics. Note: Question text: “How much do you agree with each of the following statements about the coronavirus?”1 COVID-19 Context and Development
Disease progression, health care system capacity, and response
Government policies and action
Economic and Business Impact
Updated 20 April 2020 Version 2.3.
2
and Scenarios
Economic response
Scenarios and key drivers
reserved.
Business impact
All rights
Group. reserved.
All rights
Guide for Leaders
Group.
3
Consulting
Consulting
Determining government action
by Boston
by Boston
Considering ecosystem interdependencies
© 2020
Navigating businesses through the crisis
© 2020
Copyright
Copyright
31DETERMINING
Several countries have already announced restart ambitions GOVERNMENT ACTION
As of 09 April 2020
Transition timeline from 'Flatten' to 'Fight' phase for selected countries Initial details of restart
Mar Apr May
01. 08. 15. 22. 29. 05. 12. 19. 26. 03.
Denmark: Proposing to lift some restrictions on
Denmark business and schools, ban on gatherings until 10 May
Copyright © 2020 by Boston Consulting Group. All rights reserved. Updated 20 April 2020 Version 2.3.
Czech Republic: Planning to lift restrictions on some
Czech Republic home repair and household goods shops
Austria: Proposing to reopen small shops, large shops to
Austria remain closed until May
Malaysia: Proposing to reopen selected economic
Malaysia
sectors in phases, following strict hygiene rules
United States United States: State-led reopening potentially starting
beginning of May
Norway Norway: Proposing to resume some businesses, schools,
and travel
Germany Germany: Planning to begin lifting restrictions for some
businesses and shortly after for schools
Proposed re-entry plans dependent on disease evolution in each country
Start of lockdown
Notes: '(Began…)' refers to the start date of a country's lockdown, lockdown definition varies between countries; Italy, Spain
have announced some intention to lift some restrictions in April, but without specific dates stated Potential start date of 'Fight' phase
Source: Lit search; BCG analysis 32To transition from 'Flatten' to 'Fight' phase, leaders need to think
through multiple key questions
Flatten Fight Future
Governments Ecosystems Businesses
Copyright © 2020 by Boston Consulting Group. All rights reserved. Updated 20 April 2020 Version 2.3.
How to balance containment Under what context should
and mitigation with employees be allowed to return to
socioeconomic recovery? their workplace?
Which employees should return
When is the right time to reopen? to their workplace?
What is the optimal sequencing What interventions should be
of reopening? How to manage taken to ensure a safe work
uncertainty given winning environment?
requires coordination of
many stakeholders?
Source: BCG 33Reopening activities need to be guided on a national level DETERMINING
GOVERNMENT ACTION
and adapted to local realities
National advisory guidelines articulate a common framing of risk
Establish and assign risk
National 1 levels and provide practical advice on actions to take for each risk
government levels to local regions level (transportation, gathering size, PPE, etc.)
• Federal public health officials advise on disease management
activities by risk level
Copyright © 2020 by Boston Consulting Group. All rights reserved. Updated 20 April 2020 Version 2.3.
Develop discretionary • Risk levels a function of health care readiness (and in some
2
guidelines by risk level instances public engagement)
Region Region Region Regions establish oversight Actual sequence of reopening activities needs to go from de-
A B C
3
and 'control tower' averaged and responsive to locally driven, customized to on-the-
ground facts
• Result is decision-makers adopting different strategies for
recovery by locality based on how to best meet requirements for
Set specific policies at
Municipalities 4 the local risk level, and tailored to their local conditions
local level
Governments should actively involve the private sector in creation
Private and public actors
Private/public actors 5 of sector-specific playbooks to achieve guidelines including industry
develop unique playbooks associations, trade and labor unions, chambers of commerce
Source: BCG 34Local risk assessments determine need for application DETERMINING
GOVERNMENT ACTION
of differentiated guidelines
Each area is to be categorized into four risk Case study: National guidelines in Germany vary by
clusters with varying degrees of openness region based on assessed risk
Severe Red Mecklenburg-Vorpommern
Areas with high case load, high Current case load1: 15/100k
Copyright © 2020 by Boston Consulting Group. All rights reserved. Updated 20 April 2020 Version 2.3.
growth, and high risk of
Growth rate (7-day avg.): 1.5%
transmission Extended lockdown Population density: 69/km2
except for essential
Red goods and services
Areas with high case load but low Bayern
growth rate of new cases
Current case load1: 136/100k
Growth rate (7-day avg.): 2.7%
Population density: 185/km2
Yellow
Areas with no new cases in last Selectively open up and
week and all prior cases isolated/ prepare for full opening
contained In Bayern, an area with a comparatively higher current
caseload, growth rate, and population density,
Green restrictions are tighter and reopening of shops and
Open up to the extent
Areas with no new cases in the feasible while monitoring
schools will happen later than in the rest of Germany,
last 3 weeks and all prior cases risk of outbreak such as Mecklenburg Vorpommern
recovered
1. Not all recovered cases get reported; Source: Bayerisches Landesamt für Statistik, Regierung Mecklenburg Vorpommern, Zeit, BCG analysis 35DETERMINING
Governments need to get the preconditions for opening right GOVERNMENT ACTION
Health care readiness Public/economic readiness
Disease Health care Virus moni- Business Public Government
Copyright © 2020 by Boston Consulting Group. All rights reserved. Updated 20 April 2020 Version 2.3.
conditions capacity toring system preparation response preparation
Control of virus impact Adequate supply of Widespread virus Workplace health Training and availability Federal framework for
in terms of case growth hospital supplies, testing relative to new protocols and business of hygiene products public health, sectors,
and disease impact trained workers, case volume, serological readiness and PPE; high and global politics
(e.g. high risk treatment spaces testing, and contact compliance rates
populations) tracing
Leading indicator that Capacity sufficient to Testing to inform Businesses ensure Public educated and Clear guidance,
measures are effective, care for COVID-19 and decisions, resource workplace safety for empowered to adhere to expectations, and legal
public health is other health allocation, and outbreak those returning to guidelines, play role in protection for system
protected needs resolution work containment actors
Source: BCG analysis 36DETERMINING
Five different factors should inform the sequencing decision GOVERNMENT ACTION
Example Country
Three factors are primary determinants Weekly income at risk and virus resurgence risk factors
for country-specific sequencing are two starting considerations
1 Virus resurgence risk factor 3 Employment: 500k jobs
1 Virus resurgence
3
Copyright © 2020 by Boston Consulting Group. All rights reserved. Updated 20 April 2020 Version 2.3.
Stage
35 Arts and entertainment Three
2 Income at risk
3 Employment Accommodation & food 2 Stage
Two
30 Education
However, additional considerations Finance, insurance & RE Wholesale & retail
1
Other services Stage
play an important role, too Transport One
25 Construction
Professional services
4 Geographical specificity Resources & utilities
Manufacturing
5 Sector interconnectedness
0.0 0.5 1.0 1.5
2 Weekly income at risk
during major lockdown ($B)
Note: The virus resurgence risk factor takes into account frequency of contact, contact with external customers, physical proximity during
interactions, likelihood of exposure to illness Source: BCG analysis 37CONSIDERING
Ecosystems and a global view will be required as economies open ECOSYSTEM INTER-
DEPENDENCIES
Illustrative
Global integration of electronics
supply chain – key regional steps
Metals imported, rare earth metals
1
Copyright © 2020 by Boston Consulting Group. All rights reserved. Updated 20 April 2020 Version 2.3.
mined in China
Components like silicon wafers, chips,
2 and PC boards made in SEA, China, and
US Silicon mining
1 (China)
LCD Screens
Larger assemblies fabricated in the (South Korea)
3 3
US, Taiwan, Japan, and Philippines 2,3 Batteries
3
1,2, (Japan)
Final assembly and testing in 4,5
4 3
Chongqing 2 Components
(Southeast Asia)
Products shipped through Chongqing
5
Port/Shenzen Port worldwide 1
1
Mining: Cobalt, niobium,
gold, lithium, platinum
Note: Based on Dell/Apple laptop supply chains
Source: BCG research 38Existing industry associations can bridge the gap between CONSIDERING
ECOSYSTEM INTER-
governments and companies to set standards DEPENDENCIES
Business for South Africa: Companies across Suraksha stores: Public/private partnerships to
sectors joining forces to define COVID response ensure safety and hygiene practices
Business for South Africa (B4SA) is a conglomerate of Government sets up 2 million 'Suraksha Stores' to provide daily
businesses and leaders essentials to citizens
Copyright © 2020 by Boston Consulting Group. All rights reserved. Updated 20 April 2020 Version 2.3.
Its purpose is to jointly develop a strategic and sustainable The initiative will convert small shops to retail outlets selling
response to COVID-19 daily essentials
B4SA works in close collaboration with the government, the India's top 12 packaged consumer goods companies support the
media, and NGOs implementation
It consists of four workstreams: Each company will be given one or twostates to execute this plan
effectively
Companies include:
Health care Economics
Labor Communications
Source: The Economic Times, Business Standard, BCG 39NAVIGATING BUSINESSES
THROUGH THE CRISIS
Guiding principles Be visible, purposeful, Leverage the principle
and authentic of “commander’s intent"
for leadership Communicate in ways that engage and Share only key objectives and rationale
in crisis increase the relevance of your teams of required actions to allow the
and clarify the reasons underlying your organization to be flexible and adaptive,
communications and allow a focus on execution
Copyright © 2020 by Boston Consulting Group. All rights reserved. Updated 20 April 2020 Version 2.3.
“THESE are the times that try Use multiple clock-speeds Engage externally
men's souls. The summer soldier
and the sunshine patriot will, in Think on multiple timescales by Communicate with customers and
this crisis, shrink from the service considering the now, the next, and the stakeholders to gather frequent, fresh,
of their country; but he that later. Ensure that leadership teams look firsthand information to adapt and
stands by it now, deserves the love ahead and prepare for the future respond effectively
and thanks of man and woman.
Tyranny, like hell, is not easily
conquered; yet we have this
consolation with us, that the Cut through bureaucracy Keep imagination alive
harder the conflict, the more
glorious the triumph." Assemble a multi-functional task force Look out for new needs and opportunities
that is empowered to make decisions to serve clients now and beyond the crisis.
and suspend normal decision protocols We will not be reverting to a 2019 reality
Thomas Paine, The Crisis
Source: When Leadership Matters Most, BCG Henderson Institute 40Business leaders need to consider their employees’ risk profile NAVIGATING BUSINESSES
THROUGH THE CRISIS
holistically, not take an isolated view of the workplace
Copyright © 2020 by Boston Consulting Group. All rights reserved. Updated 20 April 2020 Version 2.3.
Home environment/ Employees commute to Employees interact with
work via public/group their colleagues or
community transport where they are clients at the workplace
exposed to other commuters depending on the type of work
Employees might have exposure to other
in confined space like buses and workplace
people in their home environment like
family, roommates, or people they have to
Commute from/ Workplace
care for (like grandparents); or live in
more densely populated communities to work
Source: BCG 41NAVIGATING BUSINESSES
THROUGH THE CRISIS
Flatten Fight Future
To know more Establish crisis 1 Develop Scenario-Based 2 Create a Rapid Response
and Transformation
about the management
Planning Approach to
(RR&T) team
manage uncertainty
9
Copyright © 2020 by Boston Consulting Group. All rights reserved. Updated 20 April 2020 Version 2.3.
action areas
for business 3 Revamp Organization and
People for the new normal 6 Manage Cost, Cash, and
Liquidity
leaders
Navigate 4 Drive Topline Security
and Customer trust 7 Emerge Stronger; drive
advantage in adversity
refer to the through
previous edition Flatten, Fight,
and Future 5 Stabilize and restart Supply
Chain, Manufacturing 8 Accelerate Digital and
Technology transformation
9 Help Society during
COVID-19
Note: RR&T = Rapid Response and Transformation Team
Source: BCG 42Detailed measures across priority action NAVIGATING BUSINESSES
areas (1/3) THROUGH THE CRISIS
Flatten Fight Future
Establish crisis
management
• Deep-dive into possible outcomes of disease spread, demand • Frequently run scenarios and update plan; focus
shifts, supply/ops issues, regulatory requirements, and on understanding the de-averaged impact by
1 Develop Scenario-Based
Planning Approach to
potential operations restart; adjust for sector-specific issues
• Perform scenario stress tests around cash-flow
geography and line of business, depth of demand
drop, duration of Fight phase
• Establish preconditions for what it will take to get workforce • Develop recommendations for daily planning,
manage uncertainty back to offices, factories, etc. resources, supply chain, workforce, and other
Copyright © 2020 by Boston Consulting Group. All rights reserved. Updated 20 April 2020 Version 2.3.
• Set up teams to work on different time horizons (flatten, fight, stakeholder management as per modeled
future) to avoid reverting to crisis management across all scenarios
• Establish nimble cross-functional Rapid Response & • To manage the massive complexity of "restarting",
Transformation team (RR&T) enhance Rapid Response & Transformation team
2 Create a Rapid Response
and Transformation
• Refine processes to manage the crisis situation, remote
working, disruption in supply
structures
• Develop approach for how to bring people back to
(RR&T) team • Ensure smooth transition of operations and workforce to work, how/when to engage customers
the 'new reality' • Establish governance and standardization to
• Shift to digital/remote customer interactions effectively coordinate other areas from the RR&T
Navigate through
• Define policies to keep employees safe with high morale • Get ahead of the curve on team to manage policies
Flatten, Fight, and Future • Engage across levels to retain talent to get teams back to work safely
• Move to online/remote working; redefine rosters and train • Take a clear view of forward demand and the new
3 Revamp Organization
and People for the new
for efficiency/effectiveness
• Establish preconditions for coming back to the working
normal: manage/restructure organization to fit
capacity needs
environment; clearly communicate • Create dedicated focus to accelerate digital,
normal • Build SWAT teams to address critical business areas, process automation, new ways of working
such as product launch, digital channel redesign, retail
delivery models
Source: BCG 43Detailed measures across priority action NAVIGATING
BUSINESSES
areas (2/3) THROUGH THE CRISIS
Flatten Fight Future
Navigate through
Flatten, Fight and Future
• Reach out to customers for their situation and needs, • Assess changes in customers' behaviors
• Drive actions to inspire confidence and ensure ability to • Adapt and transform channels
4 Drive Topline Security &
Customer Trust
deliver (e.g., multichannel, people-light approaches)
• Manage volatility in demand, and refine sales motions
(e-commerce), sales, marketing spend, pricing,
and support
(e.g. to virtual) and objectives • Ramp up commercial efforts significantly to
Copyright © 2020 by Boston Consulting Group. All rights reserved. Updated 20 April 2020 Version 2.3.
seize market shifts; leverage learnings to
accelerate digital capabilities
• Take measures to ensure operations continuity: • Ensure quick and safe restart of facilities; drive
Workforce safety and management, stop-gap measures centrally driven efficiency measures
for supply chain, site readiness (access, maintenance,
5 Stabilize & restart Supply
Chain, Manufacturing
services, suppliers)
• Set up capabilities (org, control tower) to
manage unstable supply chain; explore alternate
• Ensure open and direct communication with employees networks, dual/multiple suppliers for critical
• Explore solutions to retain key talent goods and services, delivery methods, etc.
• Accelerate production as demand rebounds;
account for product shifts
• Build forecasts for COVID-19 impact on P&L, balance • Build central team to simulate financials as per
sheet, investor base evolving scenarios; drive agile working ways
6 Manage Cost, Cash, &
Liquidity
• Review capital sufficiency scenarios and possible effects
on credit risk
• Decisively take structural actions: TURN PMO,
zero-based budgets, delayering/restructuring,
• Manage credit and debt commitment for short term re-base tech portfolio, etc.; deploy rapidly as
• Create agile FY20-21 business plans and budgets to deal speed is predictive of success in downturns
with uncertainty
Source: BCG 44You can also read


